Join a community of the most creative Business Intelligence Professionals
Join a community of the most creative Business Intelligence Professionals
View the DataDNA Data Visualisation portfolios below
Browse AI-reviewed portfolios from our global community of data professionals
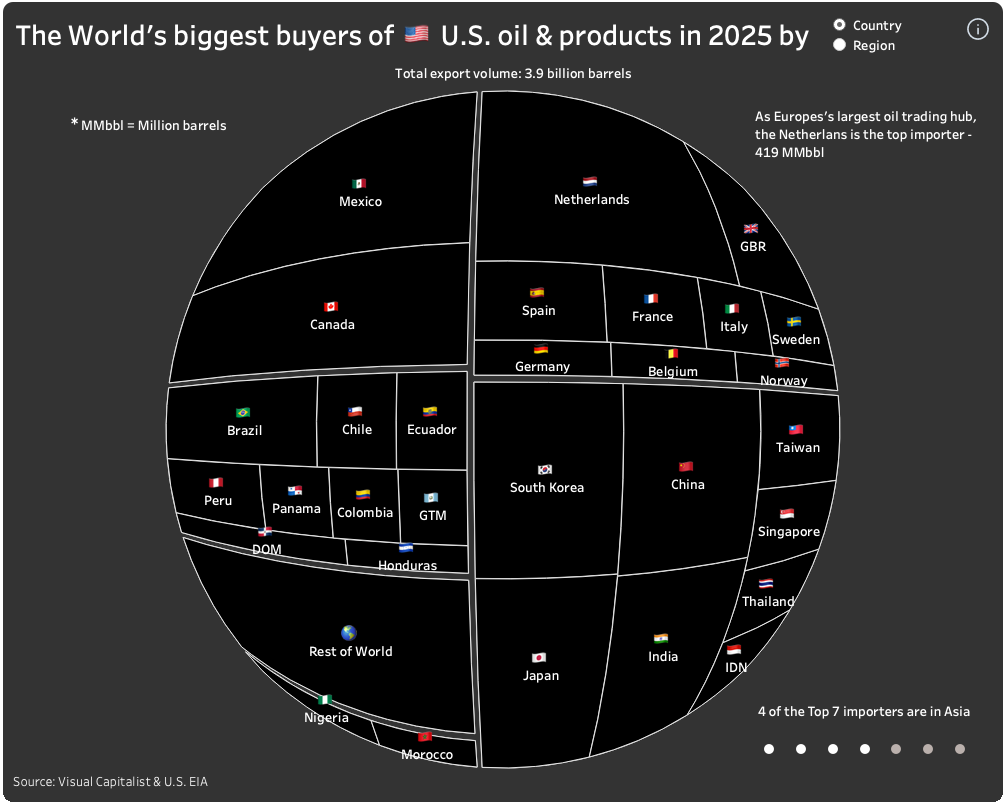
A detailed analysis of U.S. Energy Information Administration data on U.S. exports of crude oil and petroleum products, by country...
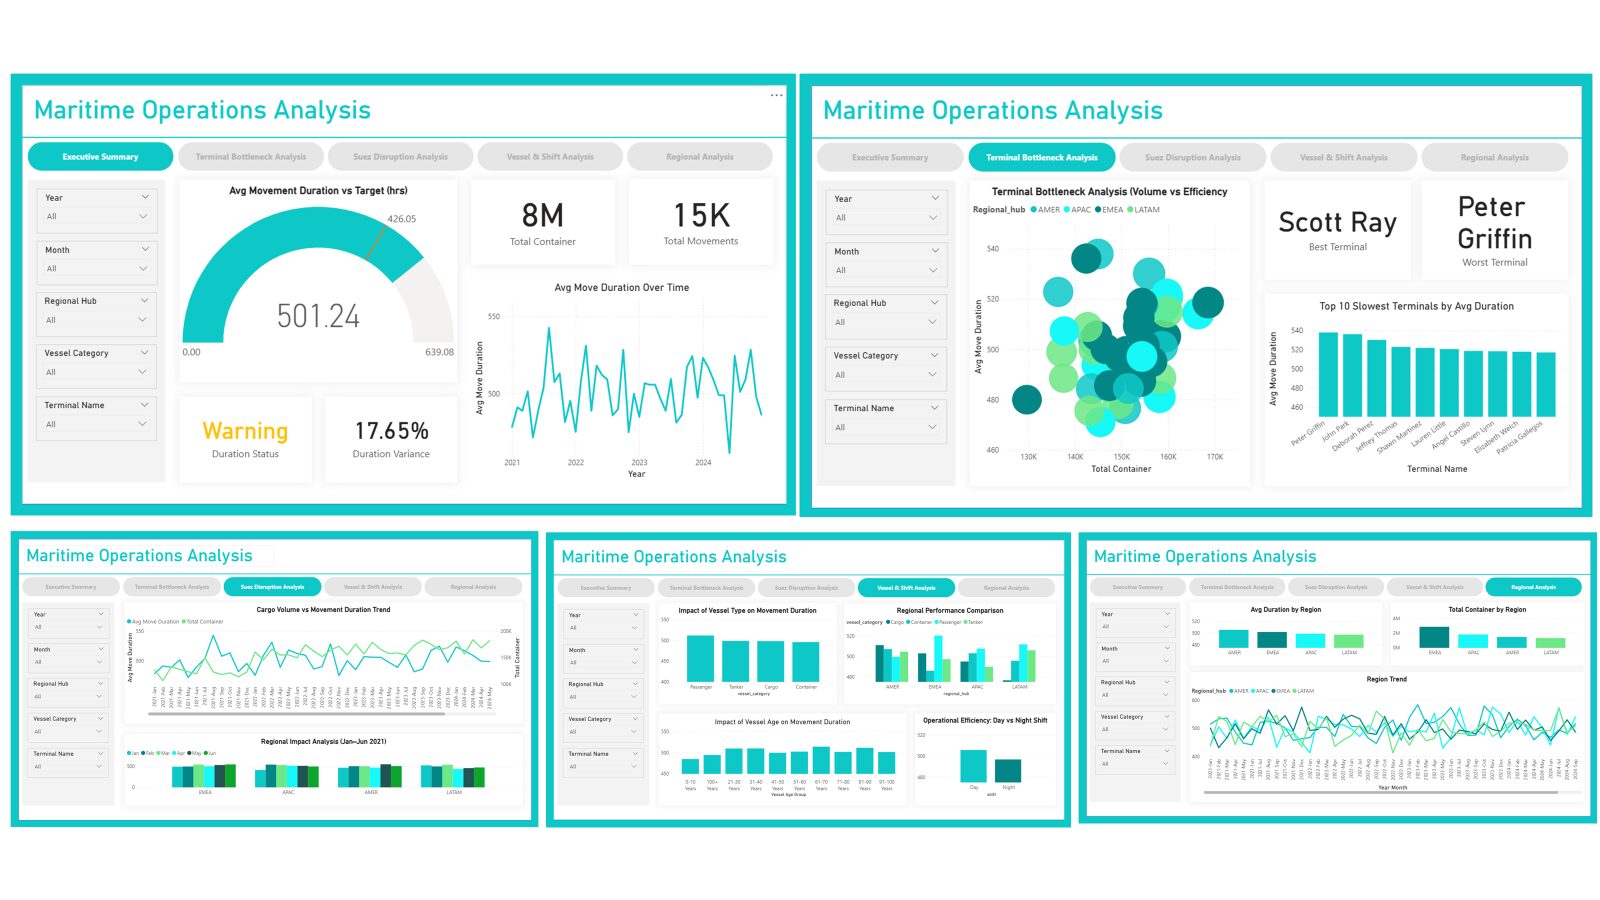
This project analyzes maritime cargo operations to identify bottlenecks, evaluate disruption impacts, and uncover key drivers of operational inefficiency.
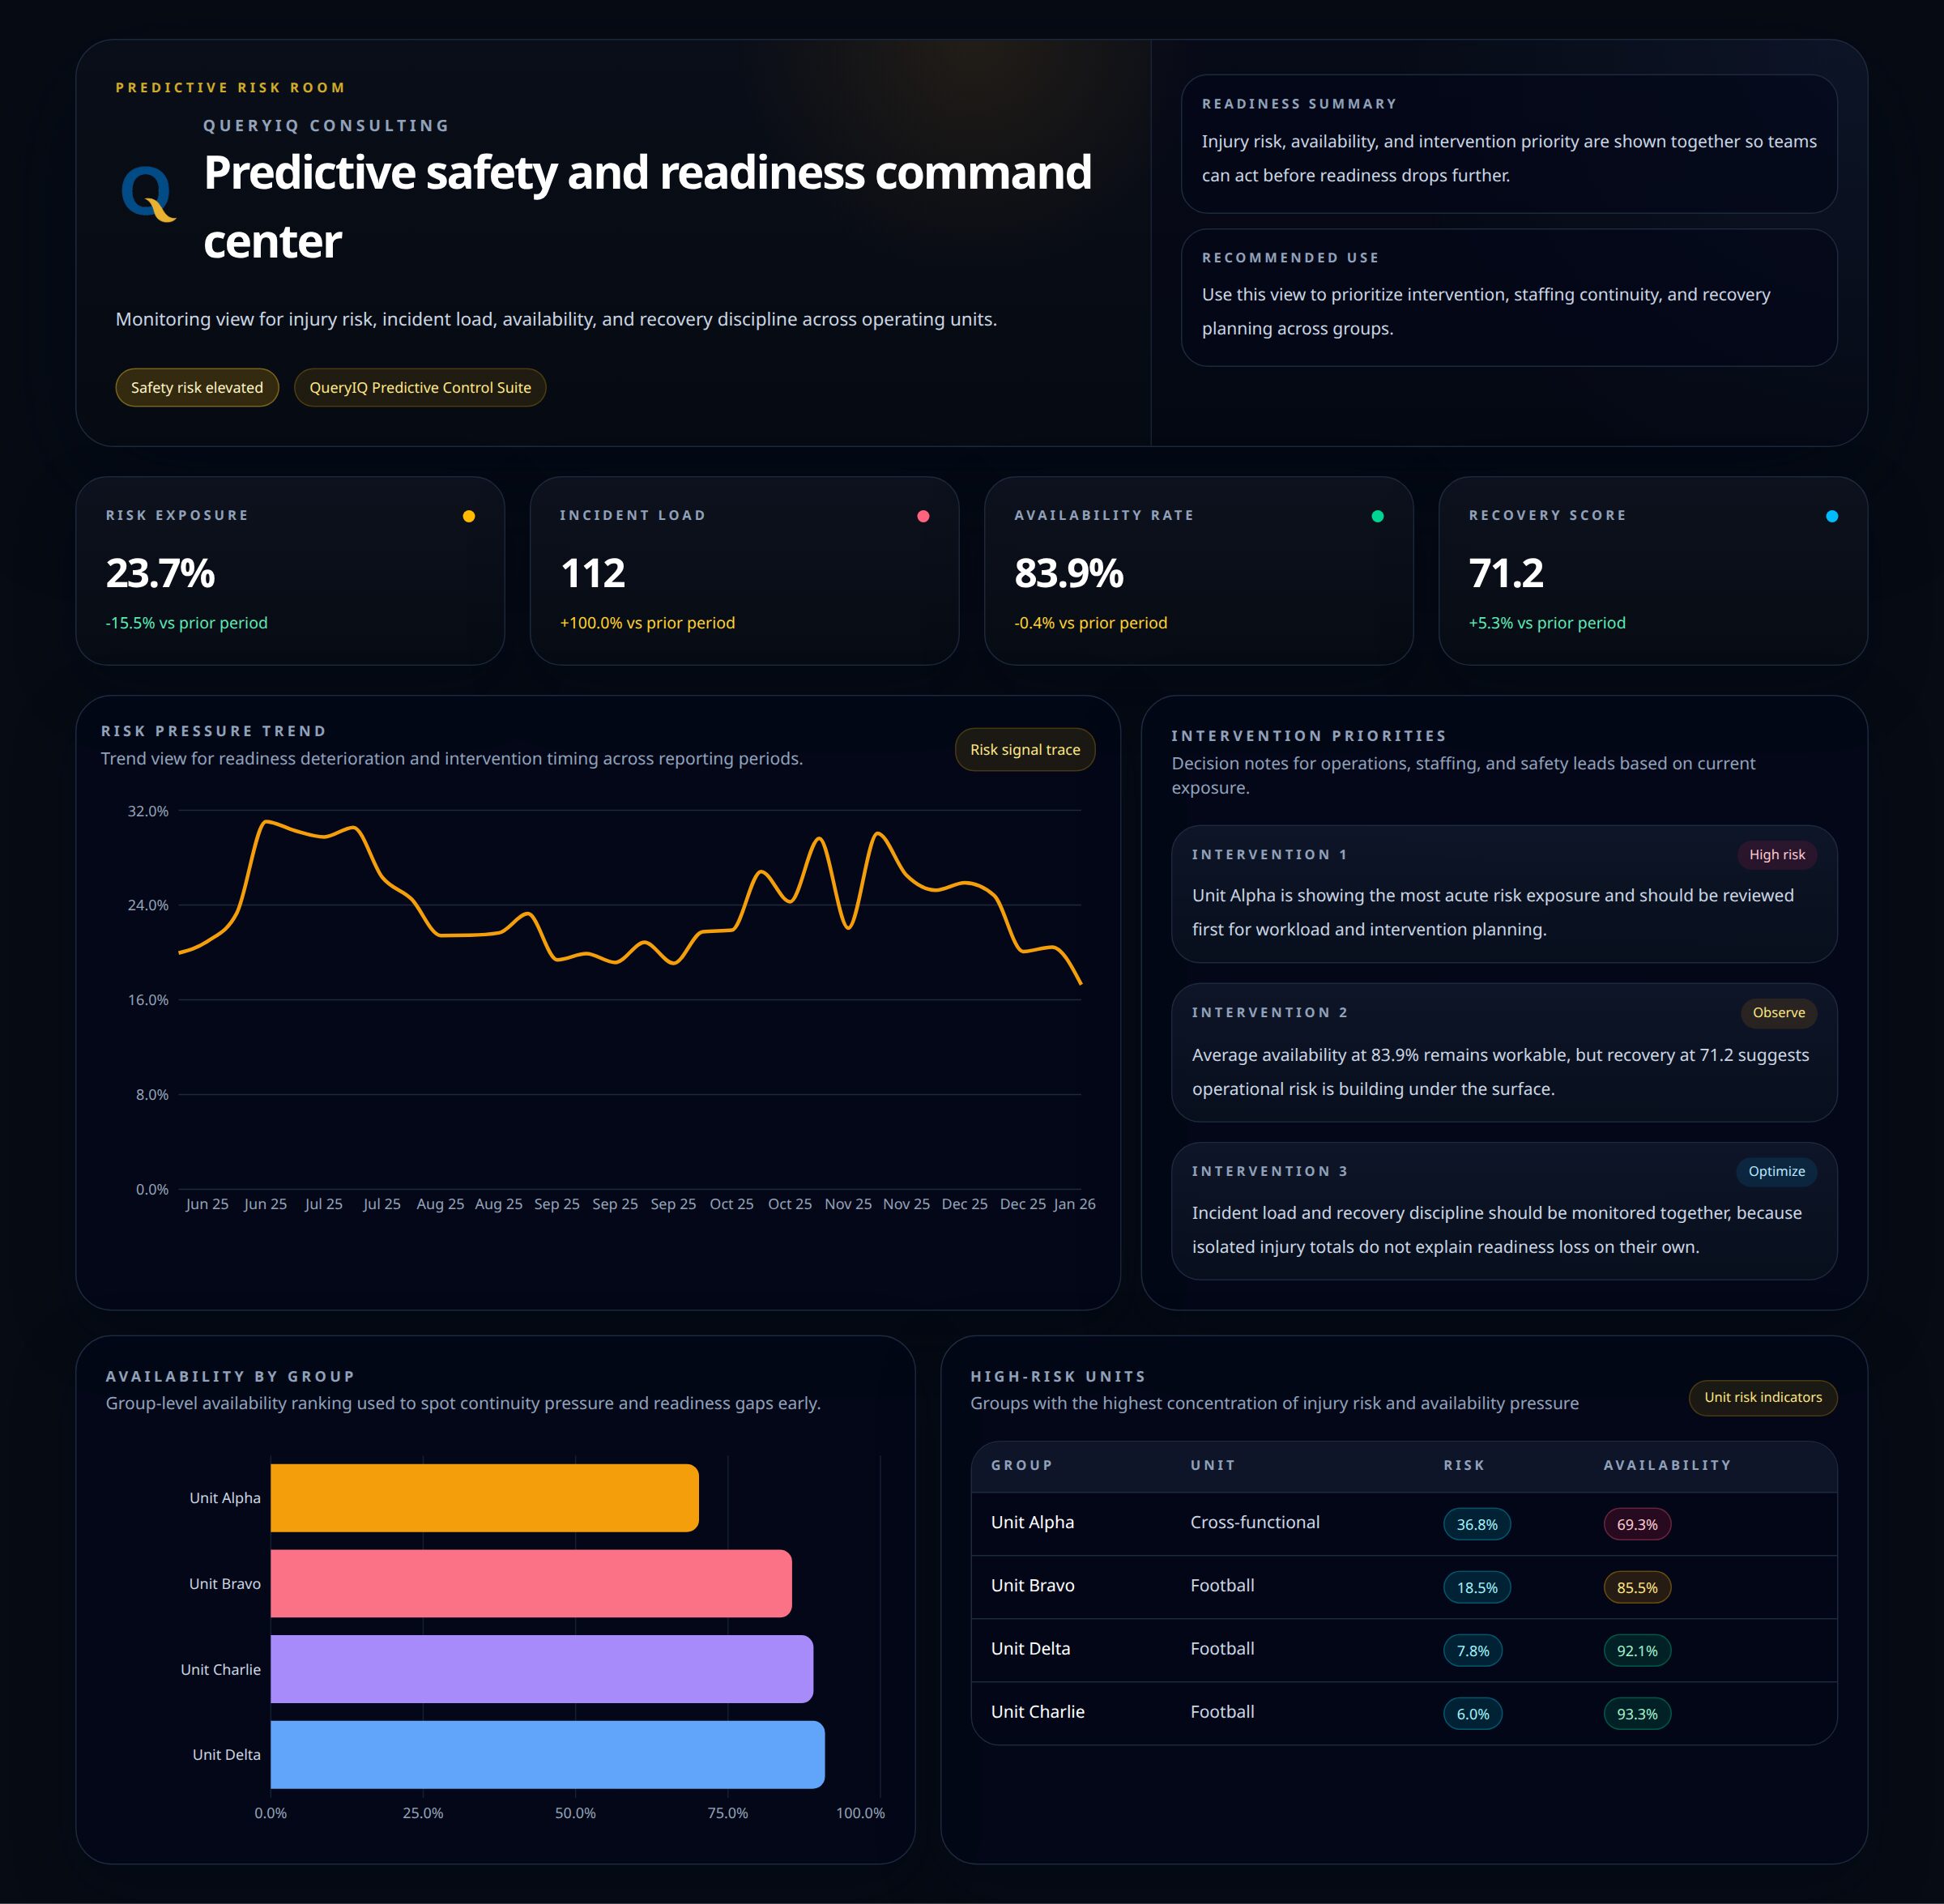
Selected BI work across operations, logistics, workforce, aviation, and predictive monitoring.
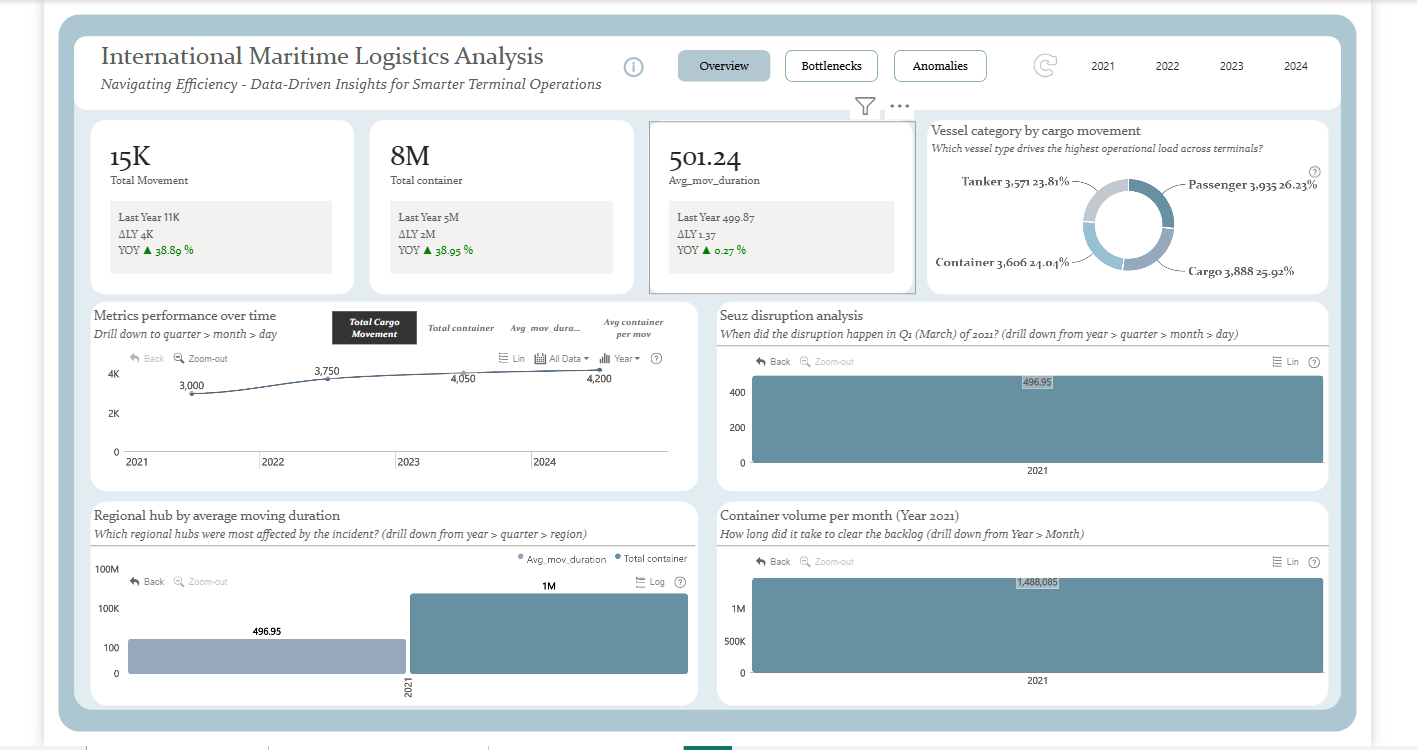
A comprehensive analysis of maritime logistics operations; uncovering disruption recovery patterns, efficiency anomalies, and infrastructure bottlenecks across global terminals.
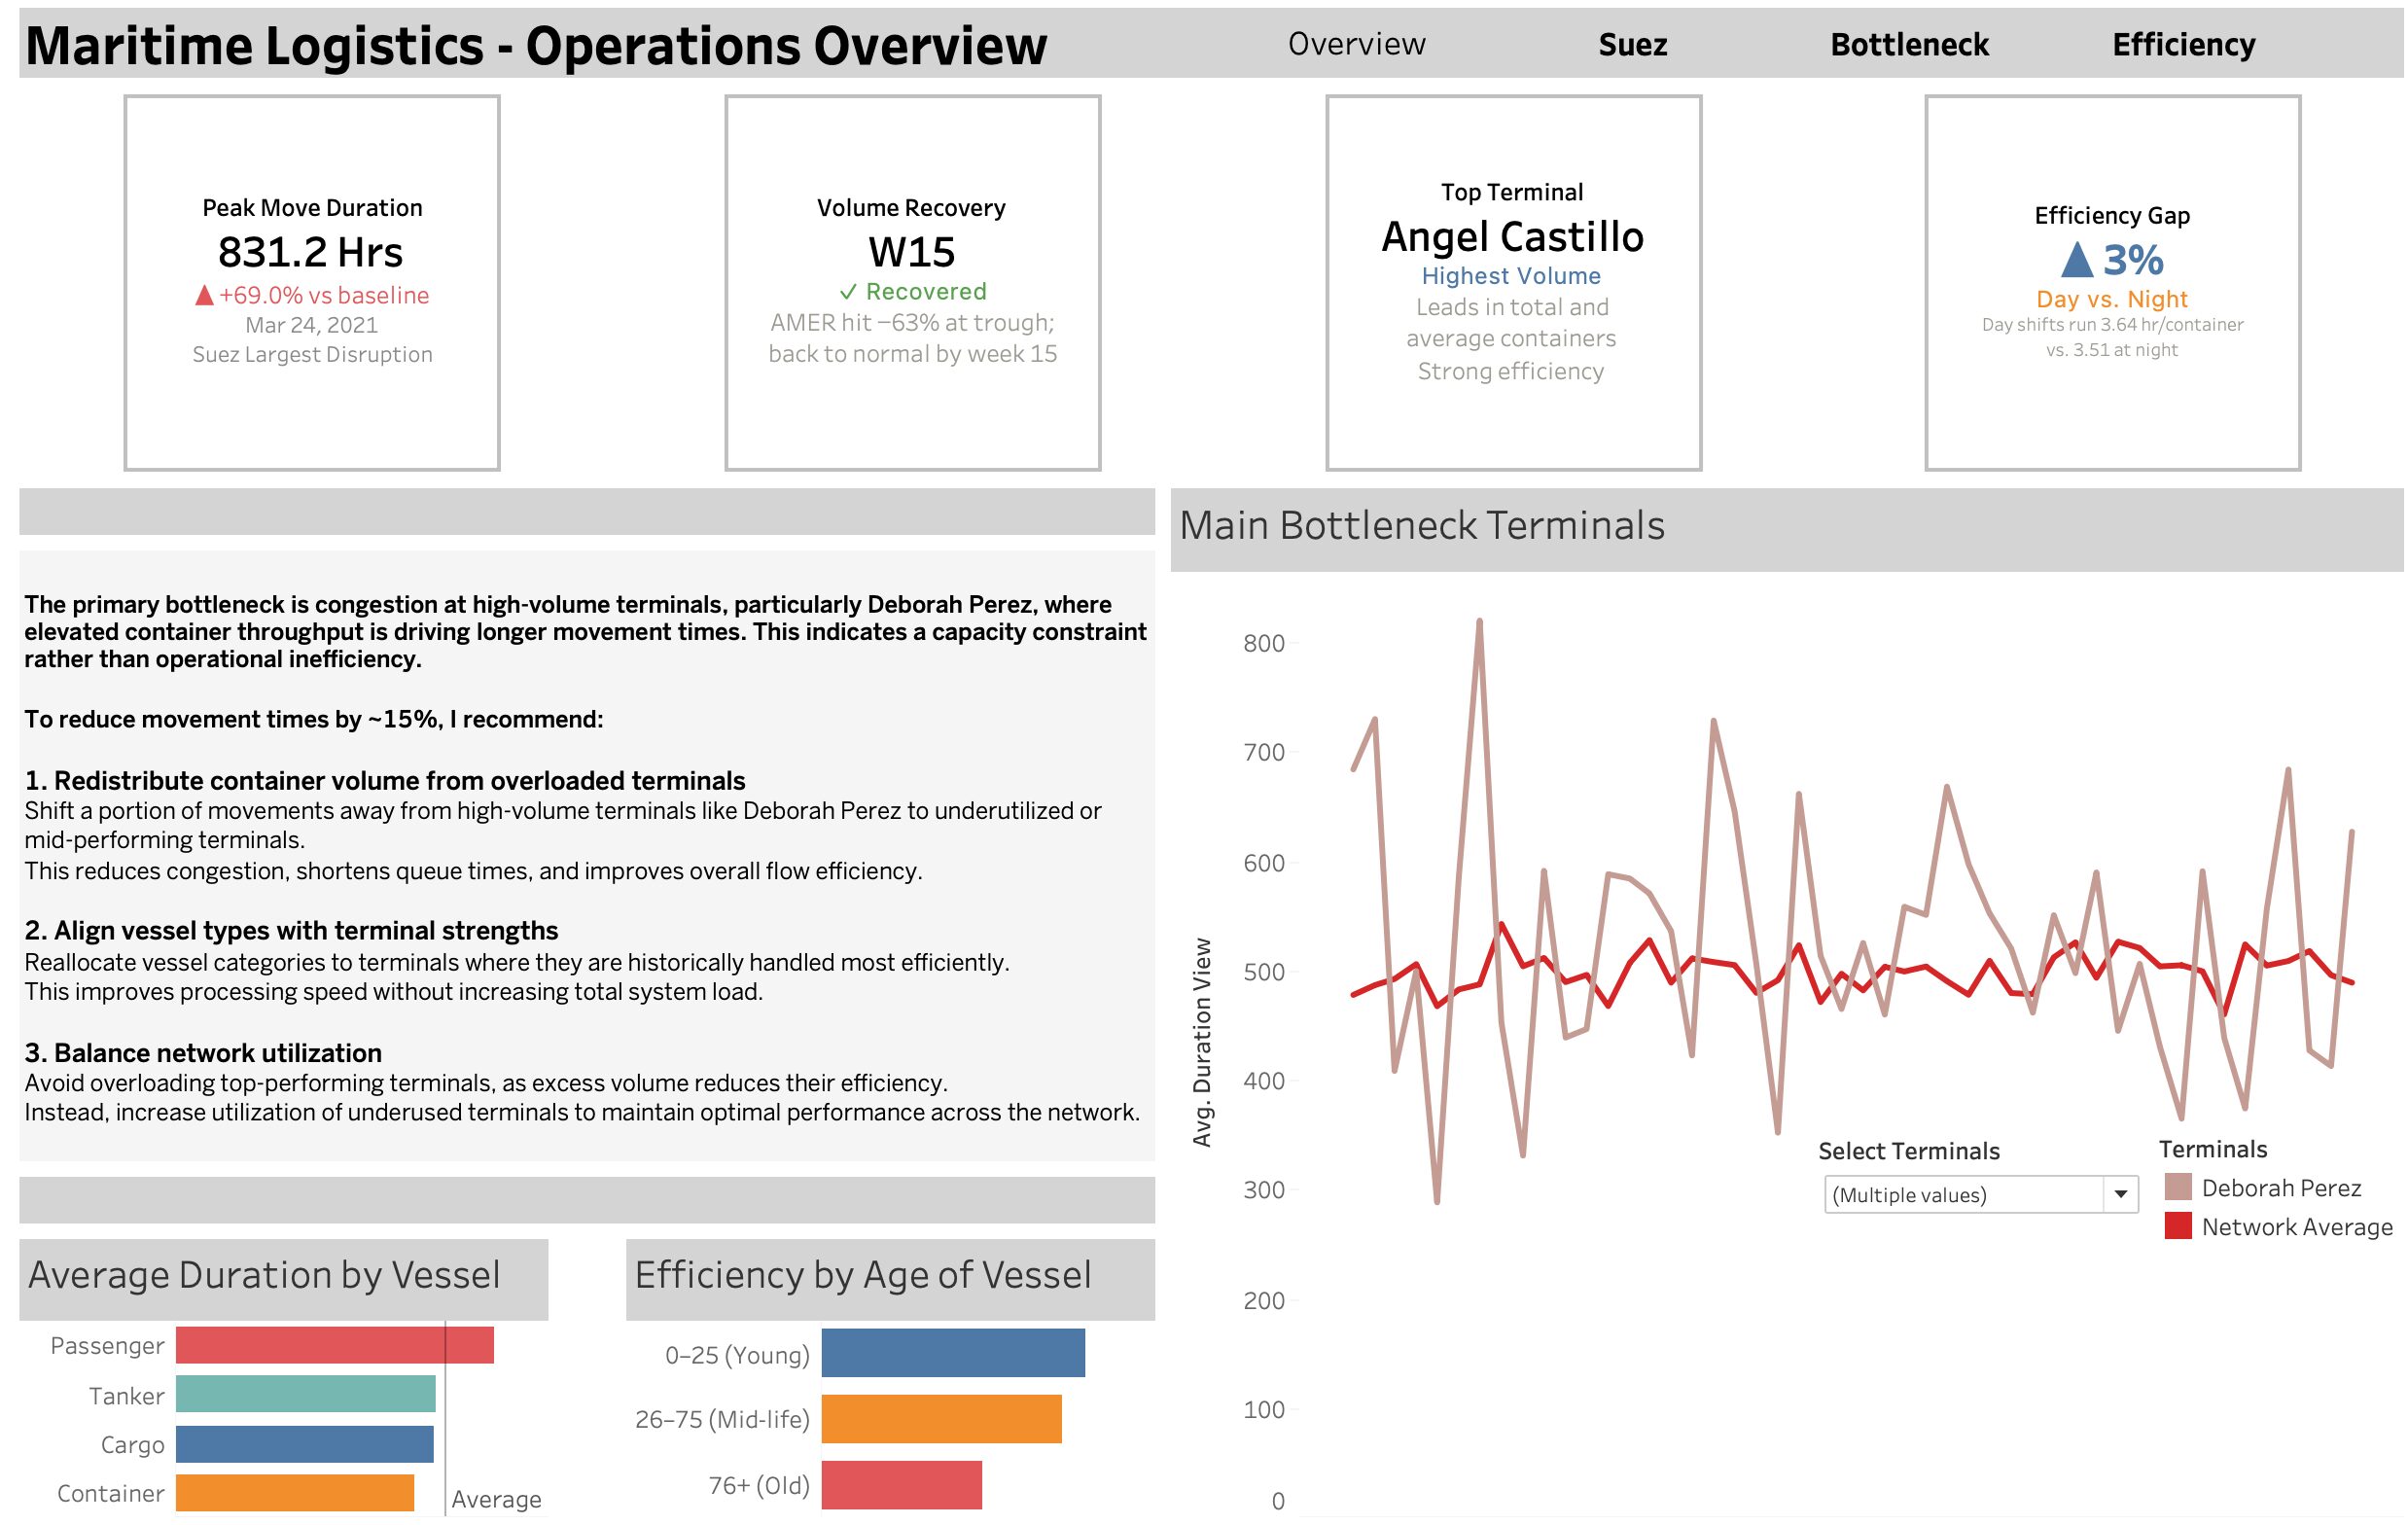
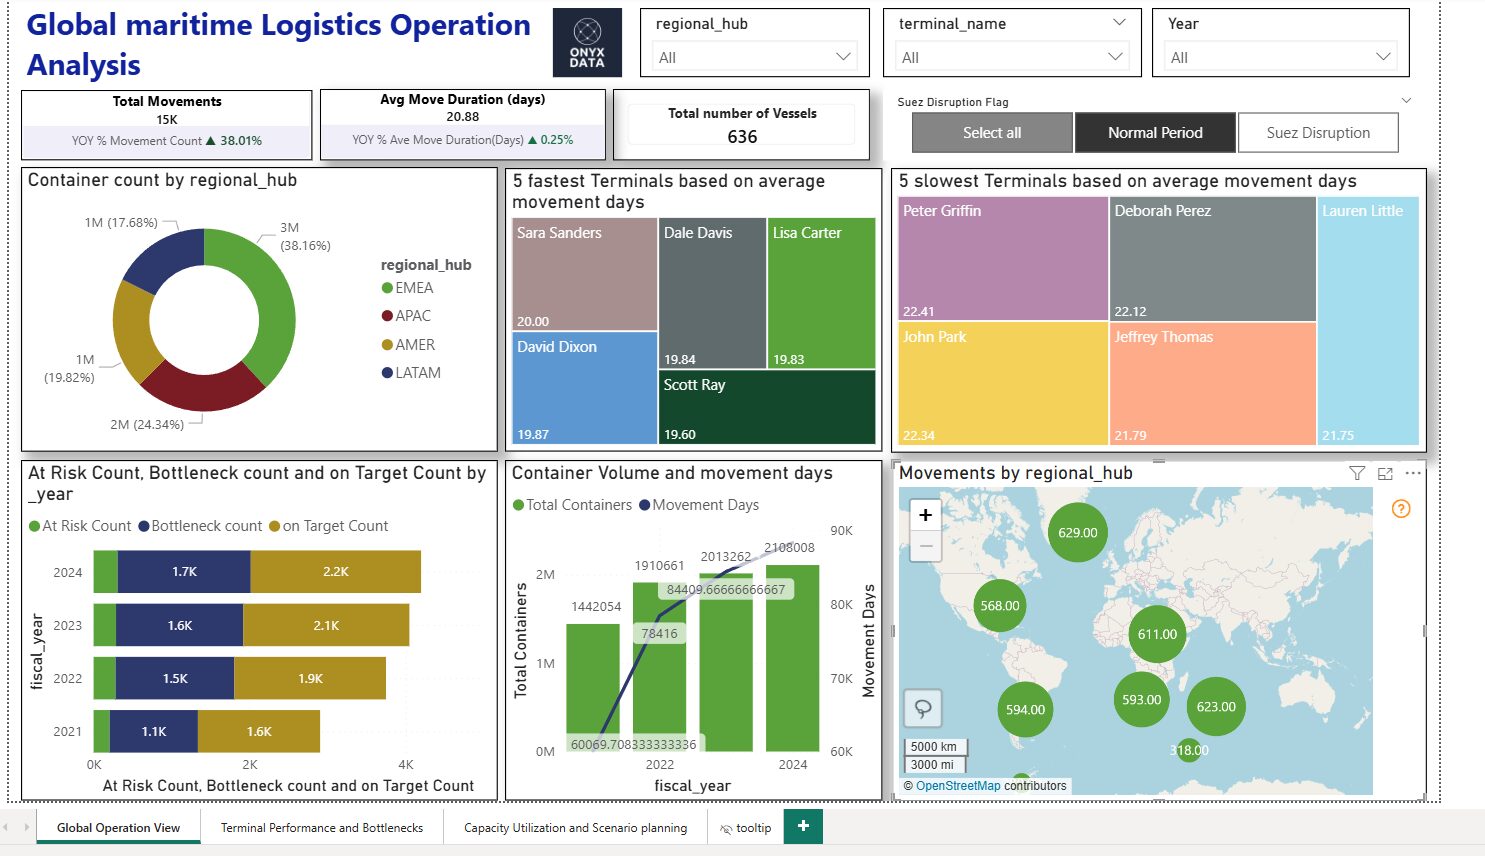
I designed and developed three interactive Power BI dashboards focused on maritime cargo analytics. This project gave me valuable insight...
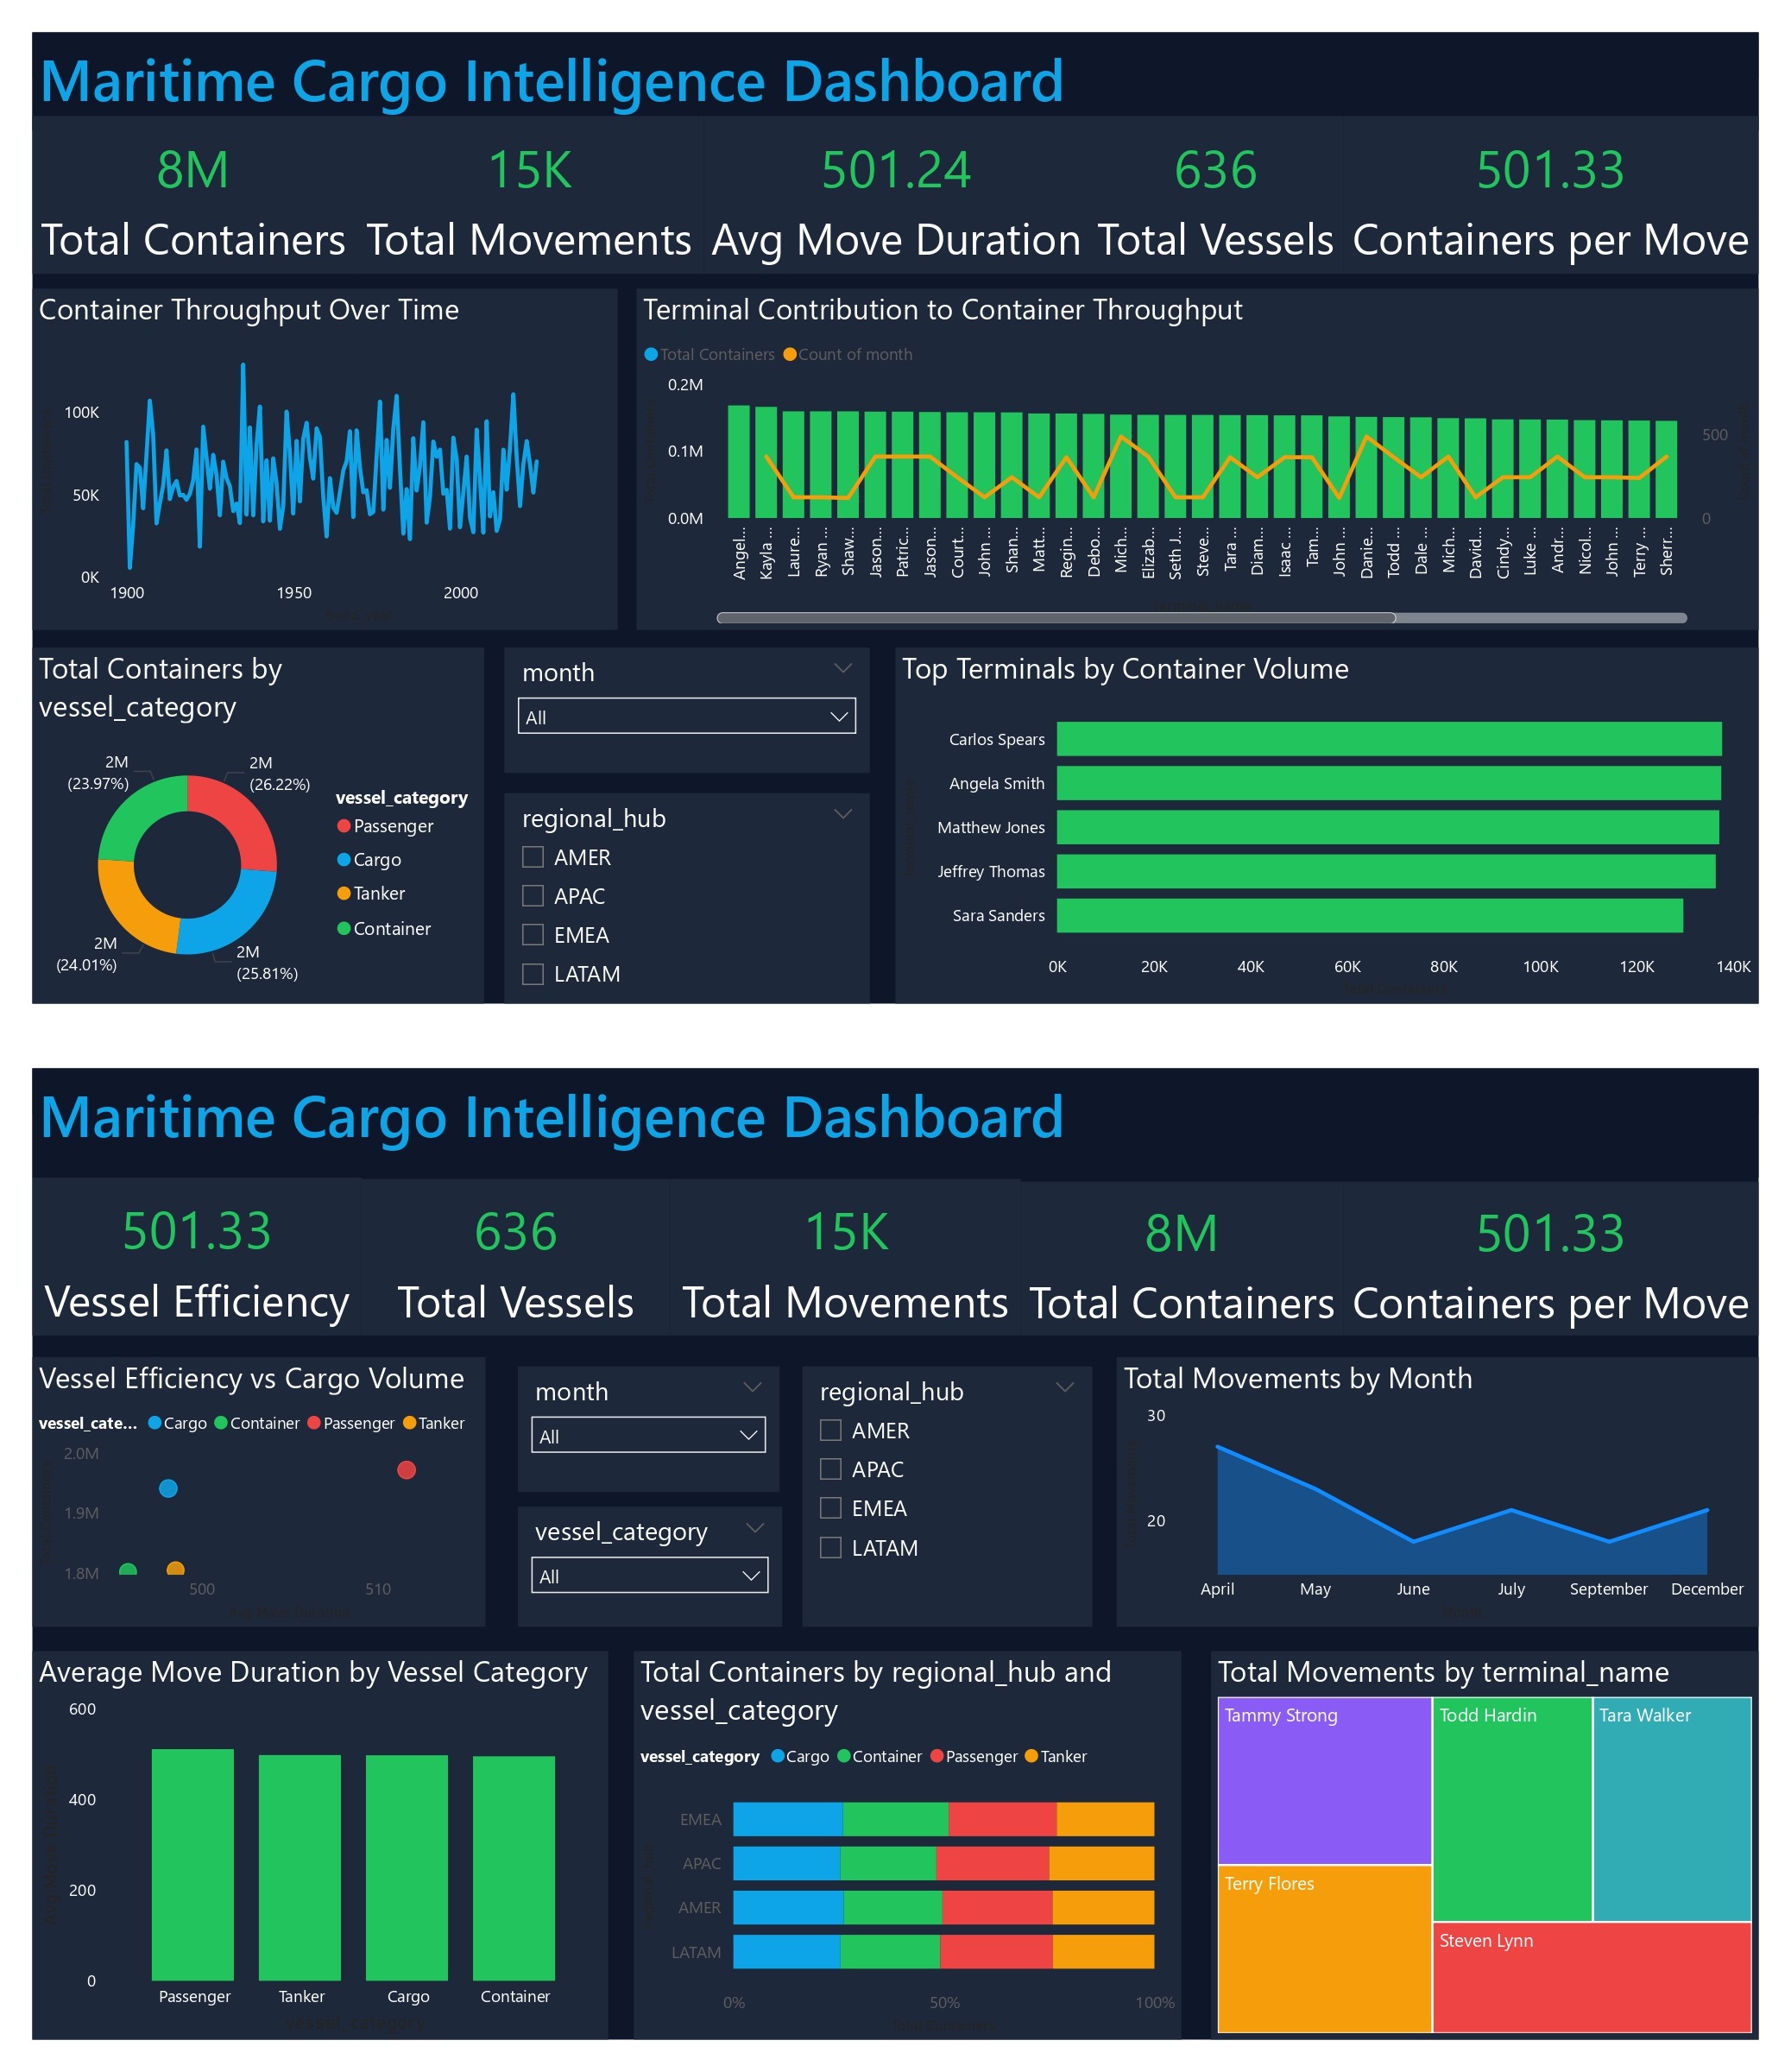
🚢 Maritime Cargo Intelligence Dashboard | DataDNA Challenge (March–April 2026) Excited to share my participation in the DataDNA Dataset Challenge...
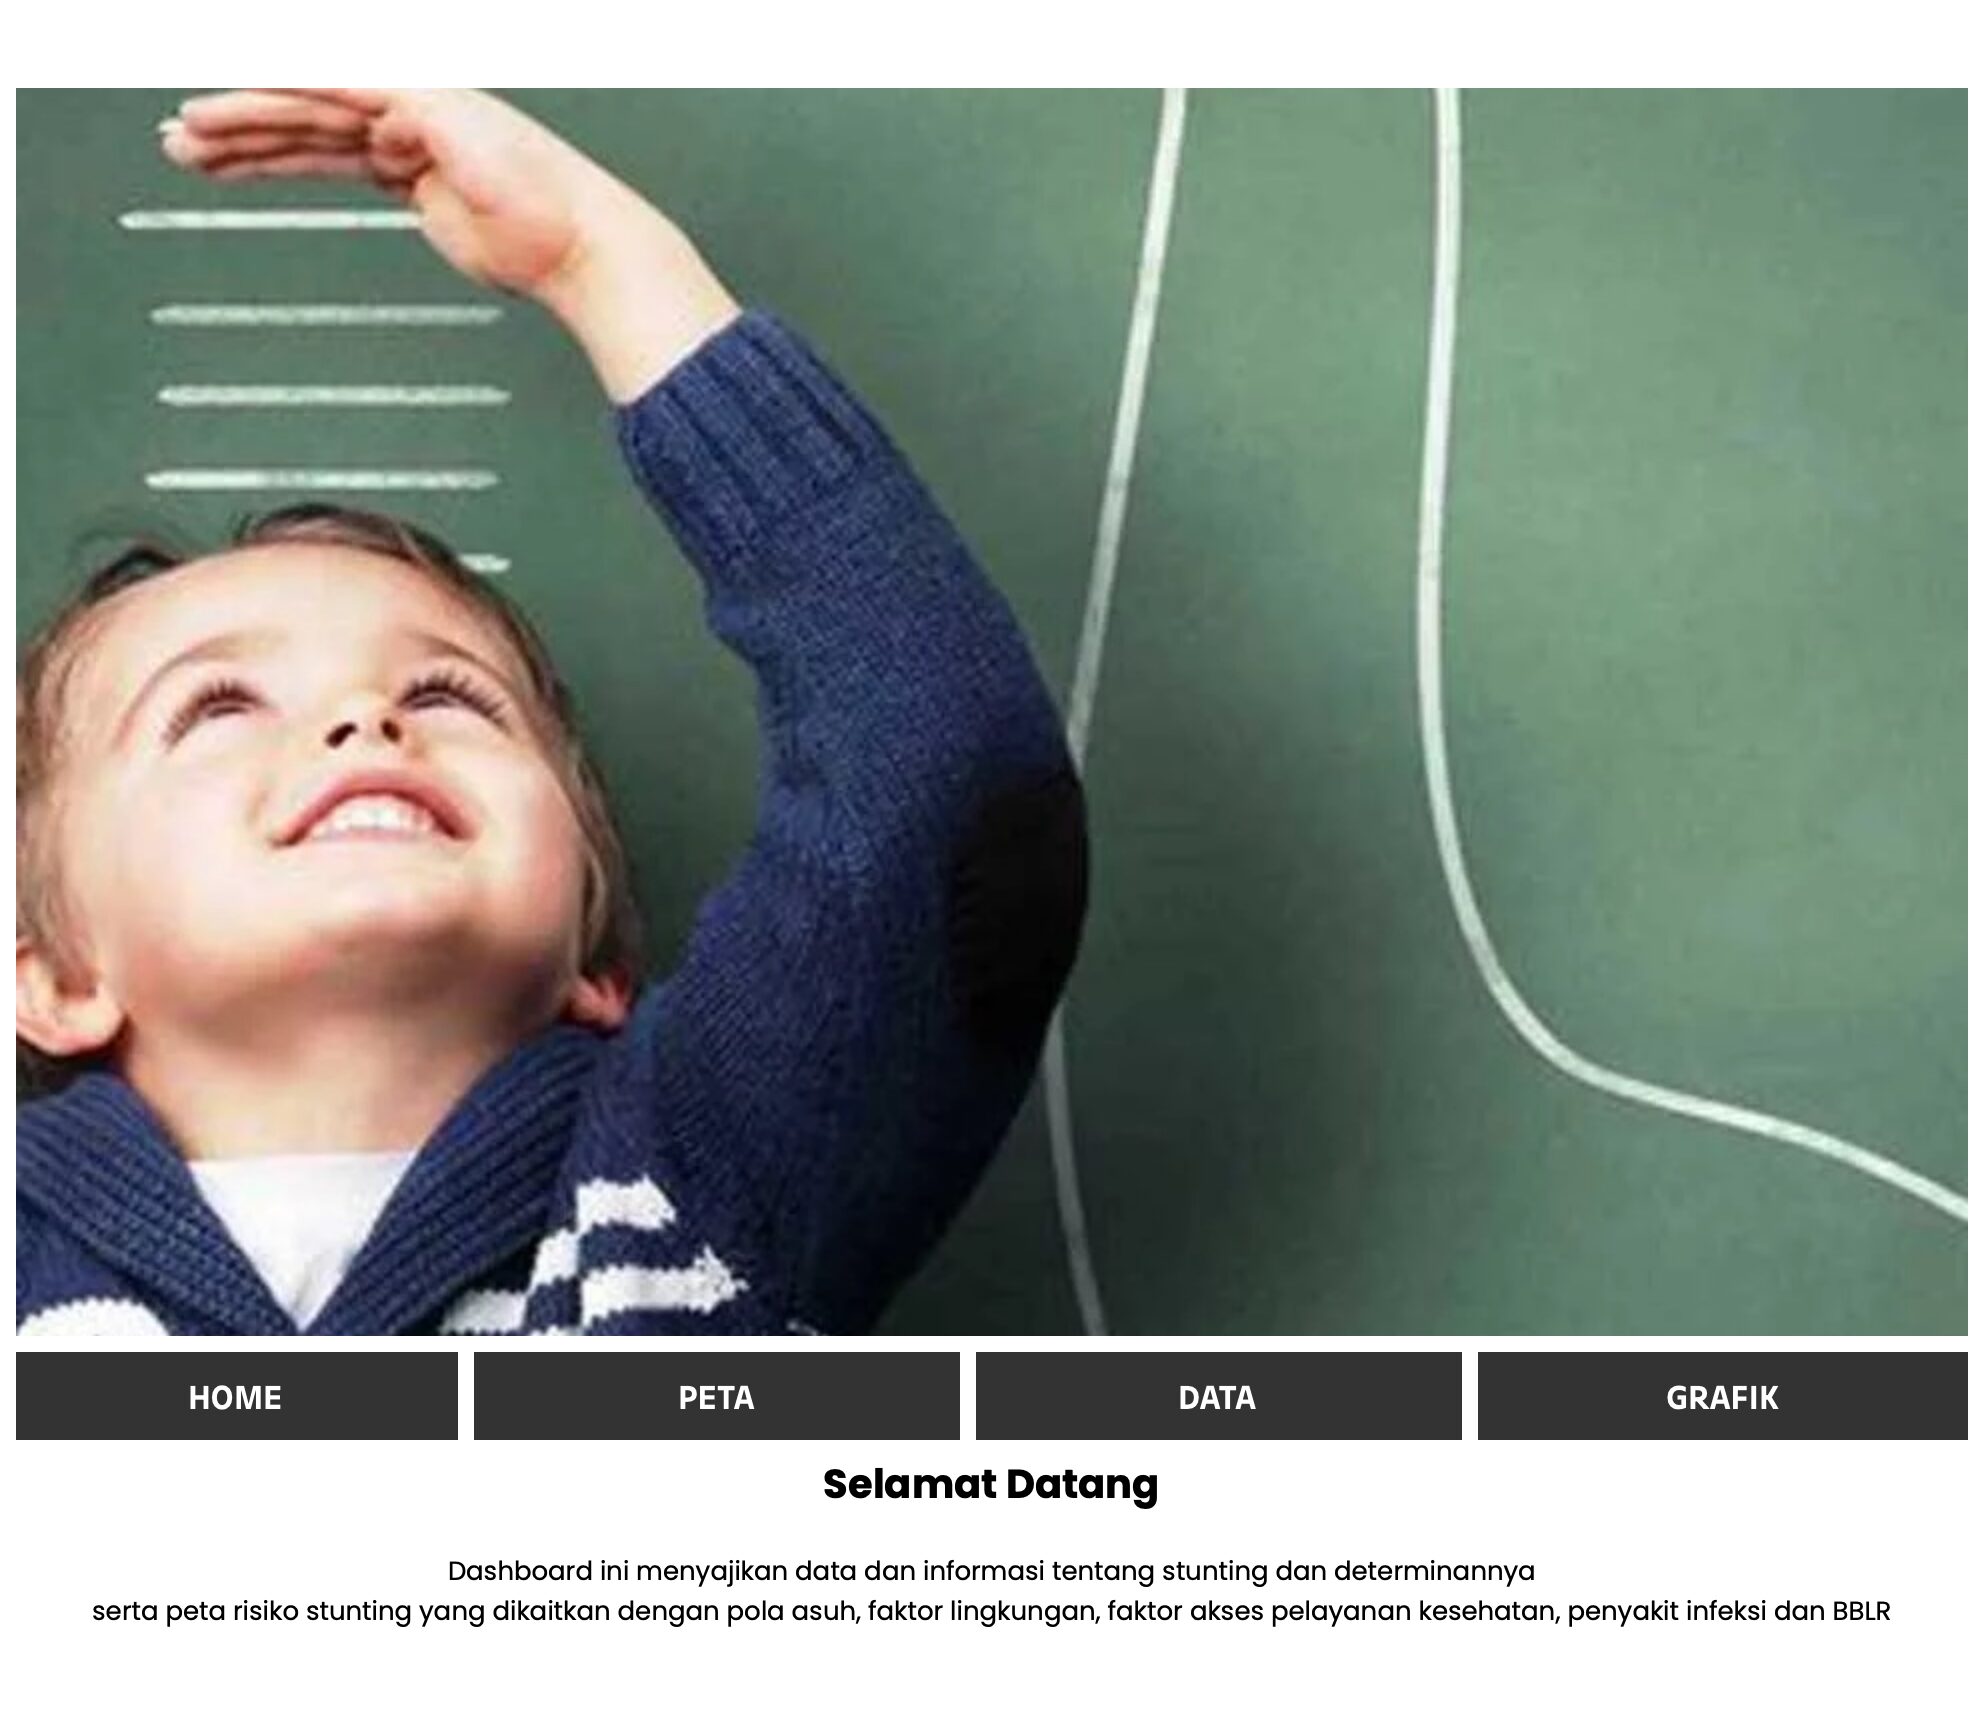
This dashboard provides a comprehensive spatial analysis of stunting rates at the regency level. By integrating various determinants—such as access...
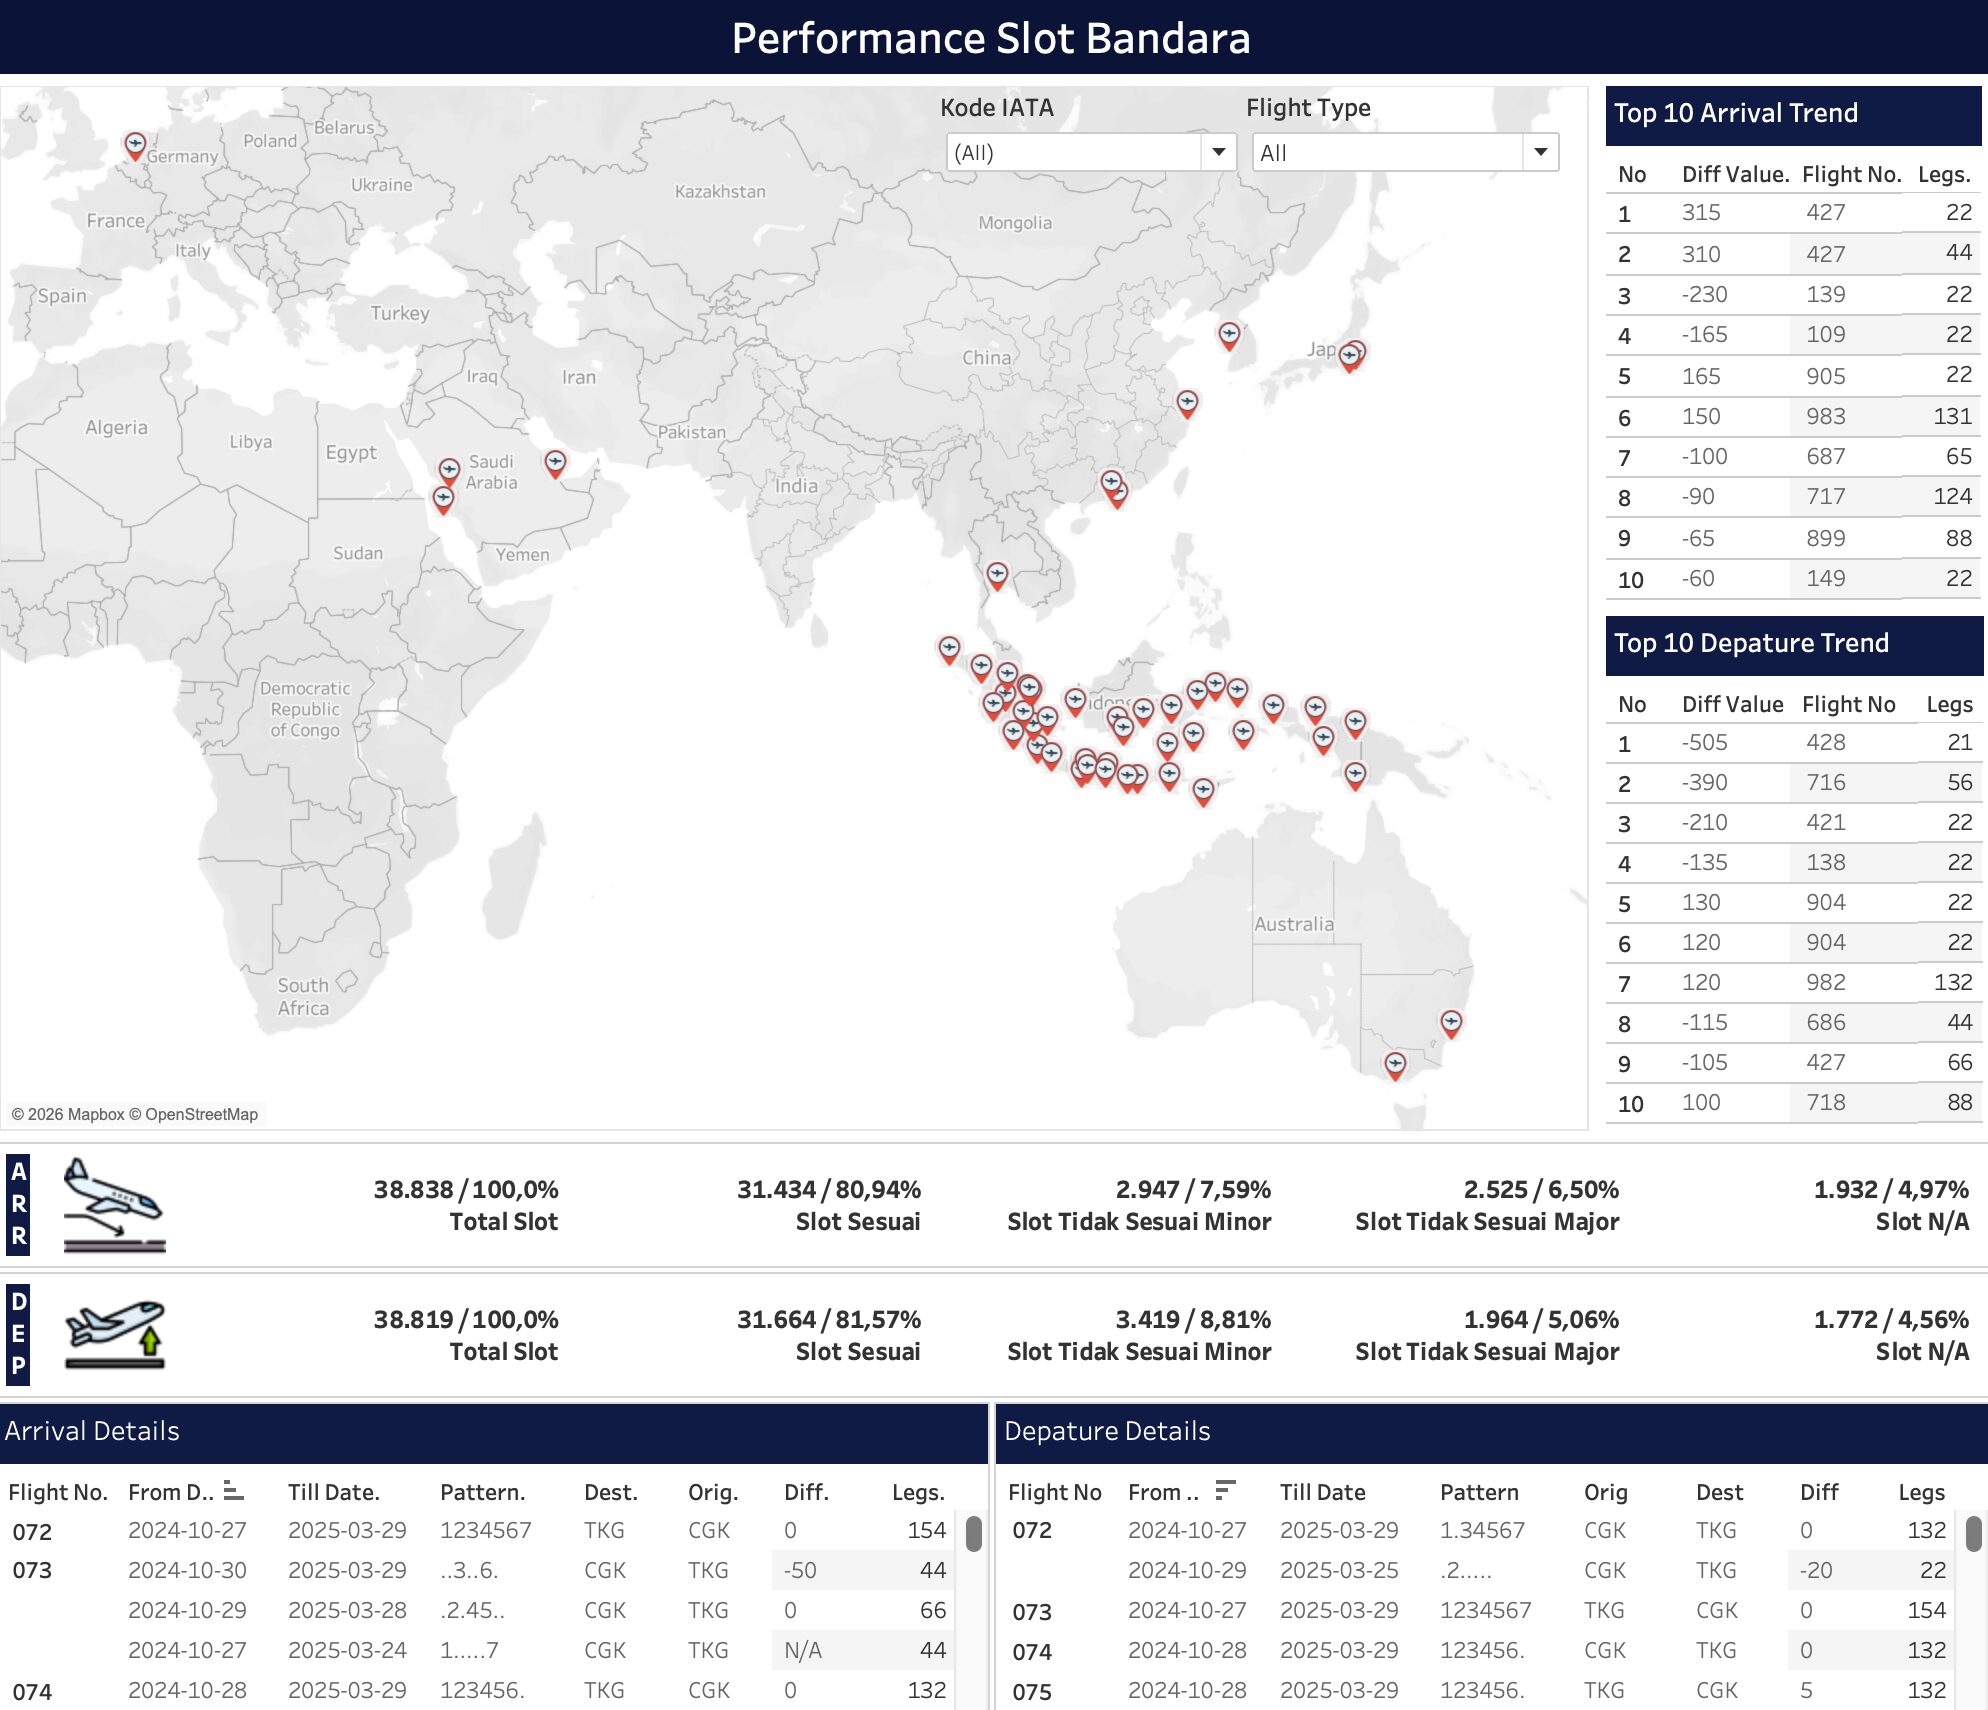
Airport slot performance visualization involves using data analytics to monitor how effectively airlines use their allocated takeoff and landing times...
Discover the latest AI & Data challenges






 Get In Touch
Contact our team

16 Upper Woburn Place, London, Greater London, WC1H 0AF, United Kingdom