Join a community of the most creative Business Intelligence Professionals
Join a community of the most creative Business Intelligence Professionals
View the DataDNA Data Visualisation portfolios below
Browse AI-reviewed portfolios from our global community of data professionals

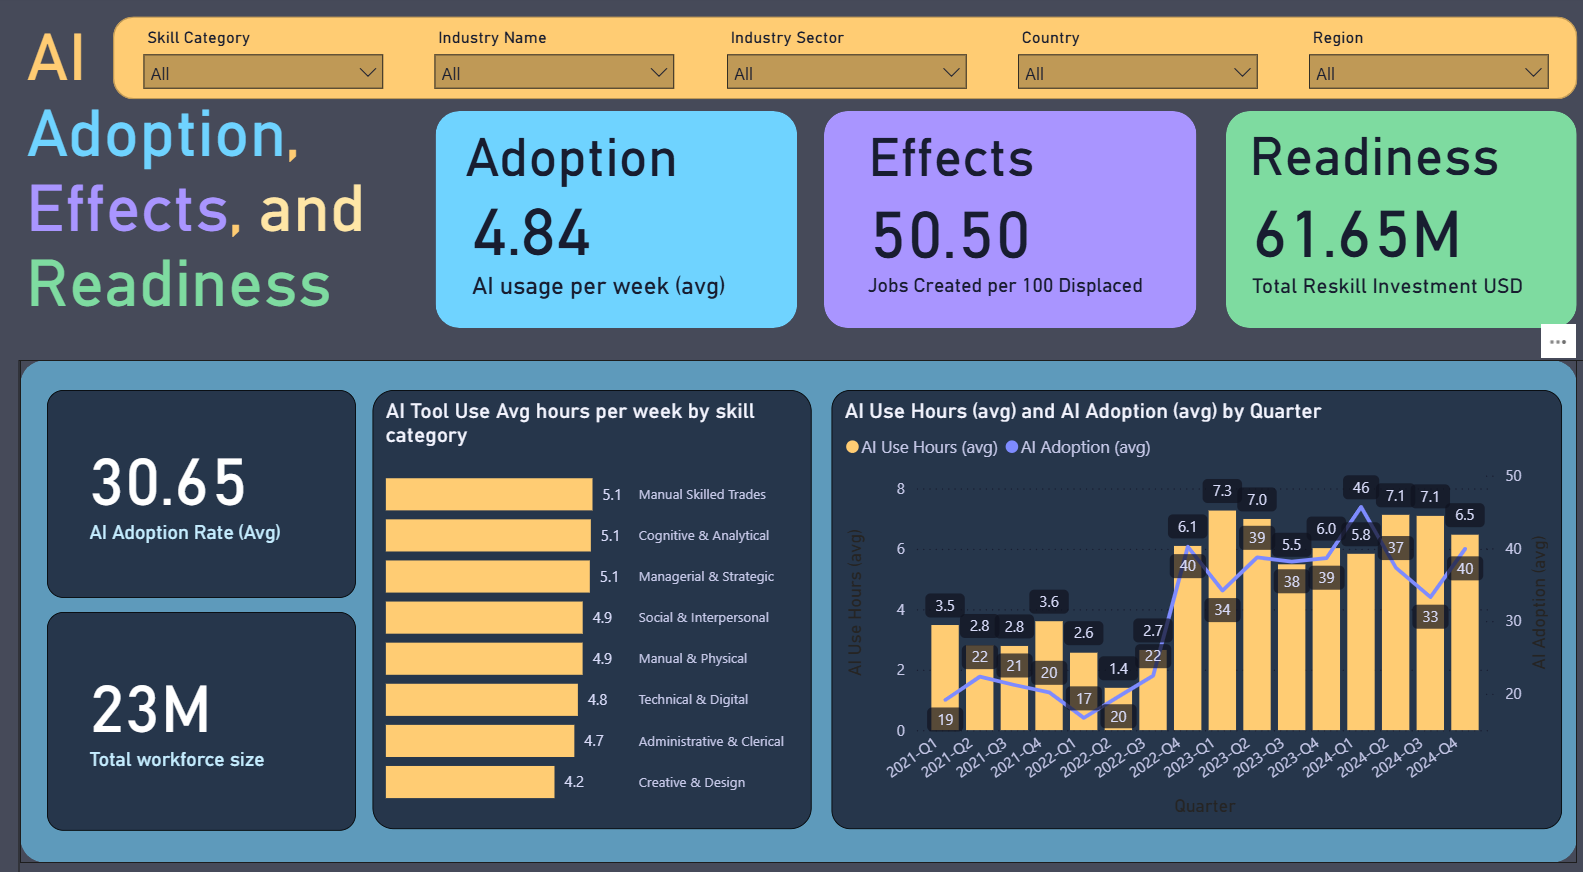
The dashboard provides an in-depth analysis of the rapid adoption of Artificial Intelligence (AI) technologies, particularly following the advent of...
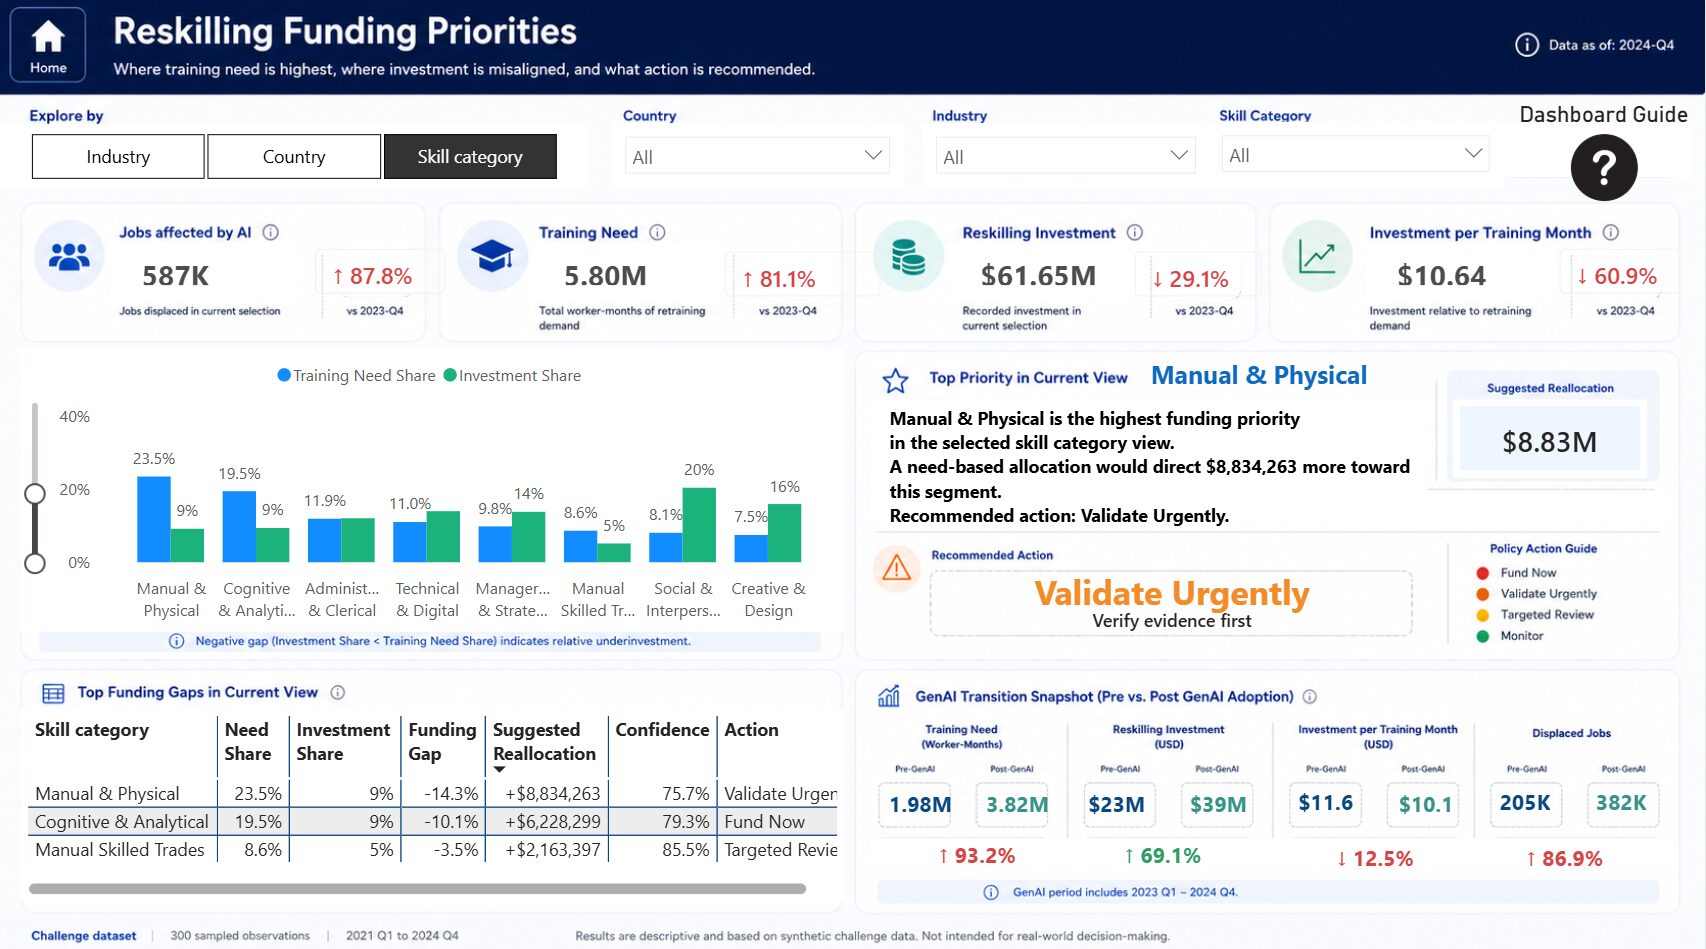
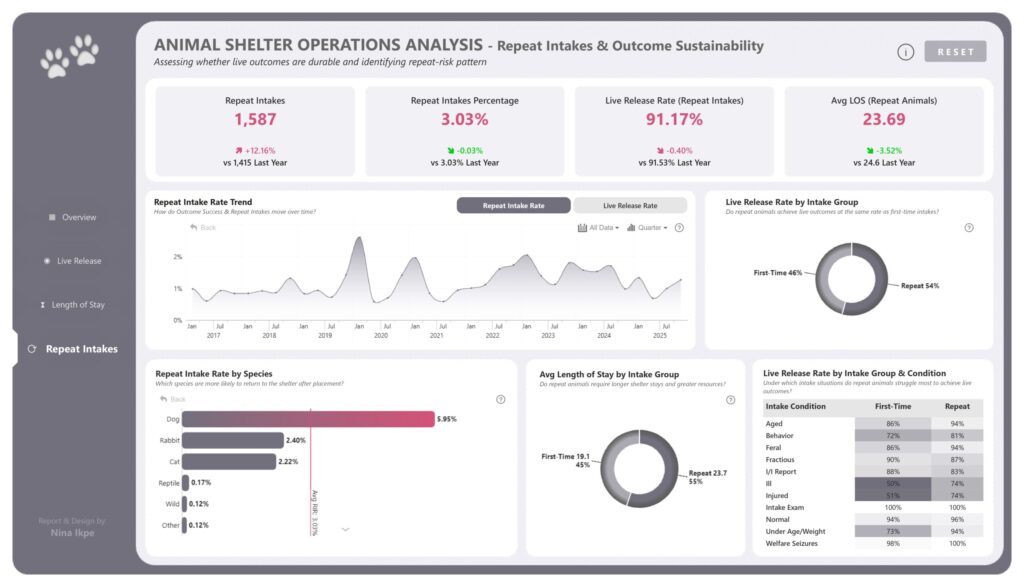
I built this report to explore whether reskilling investment is reaching the workers and sectors facing the greatest pressure from...
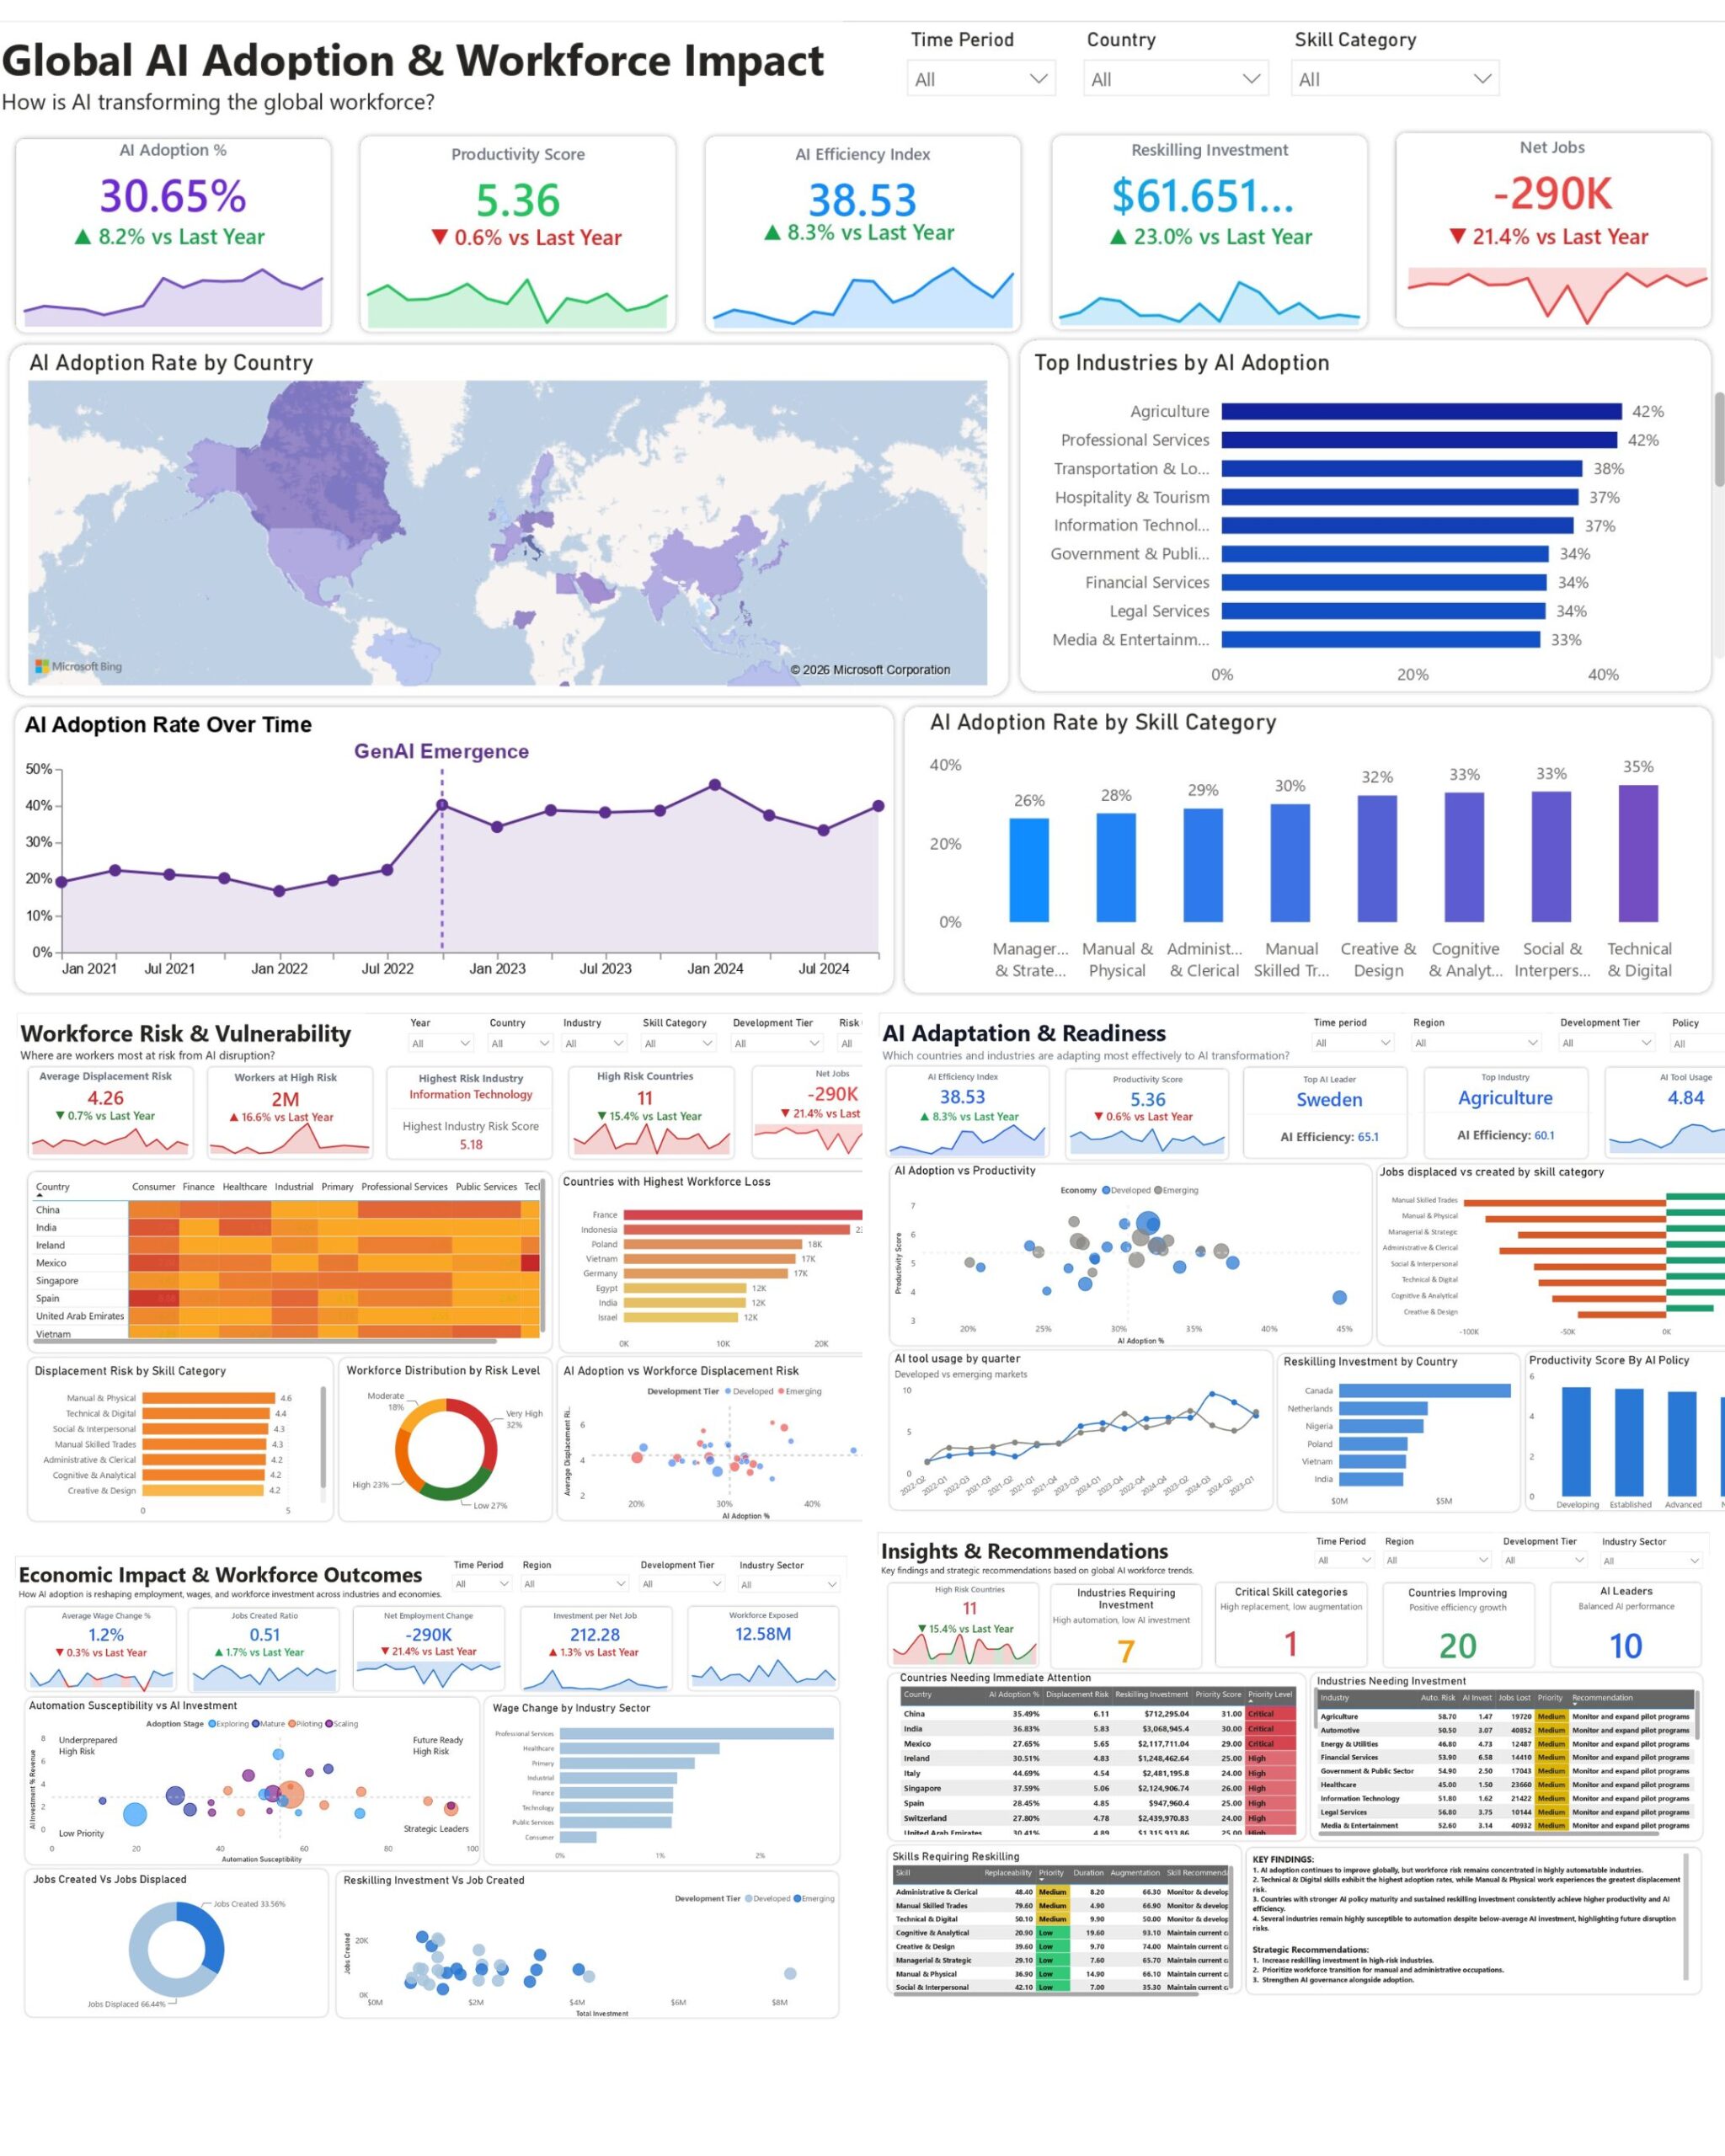
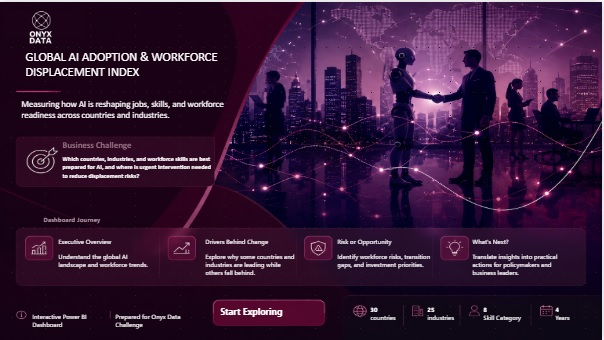
For this project, I designed and developed a five-page interactive Power BI dashboard analyzing global AI adoption and its impact...
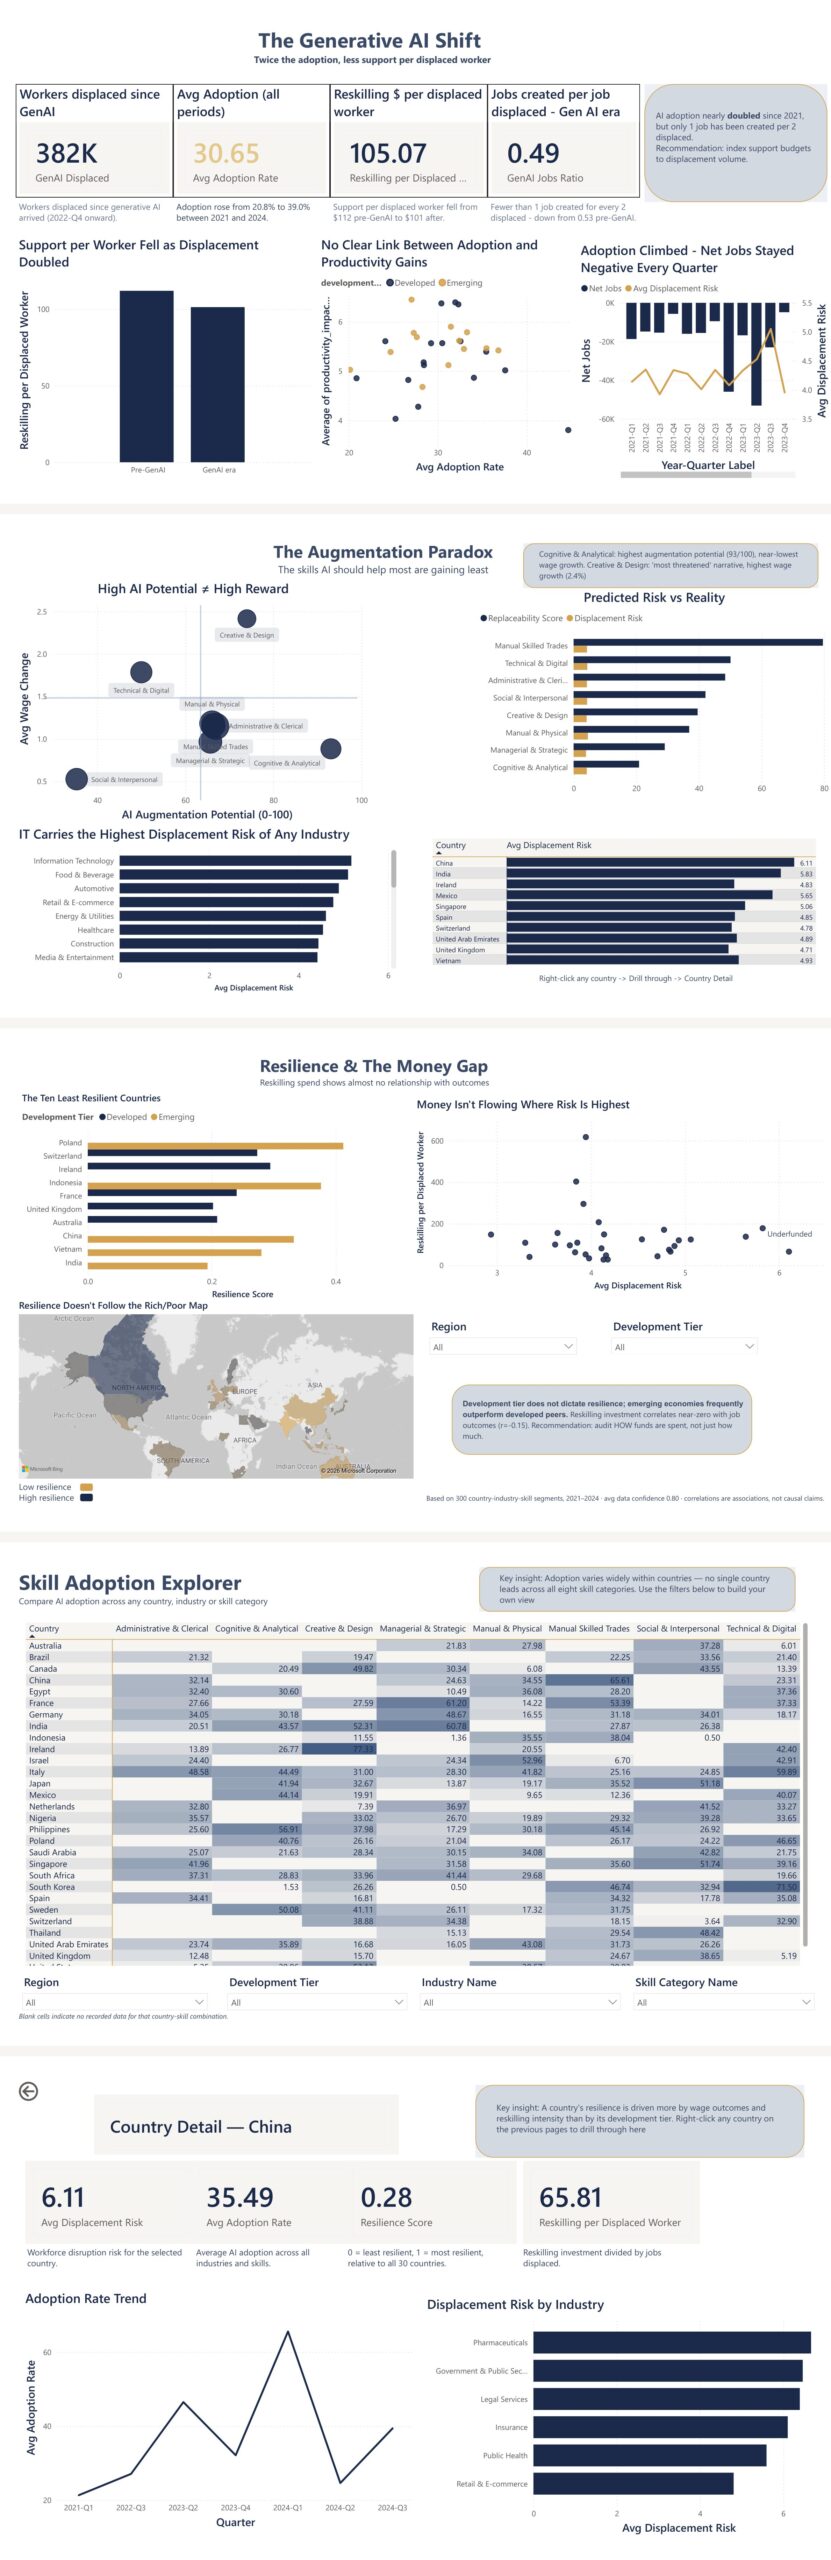
A five-page Power BI report analysing AI adoption and workforce displacement across 300 country–industry–skill segments and 30 countries (2021–2024). The...
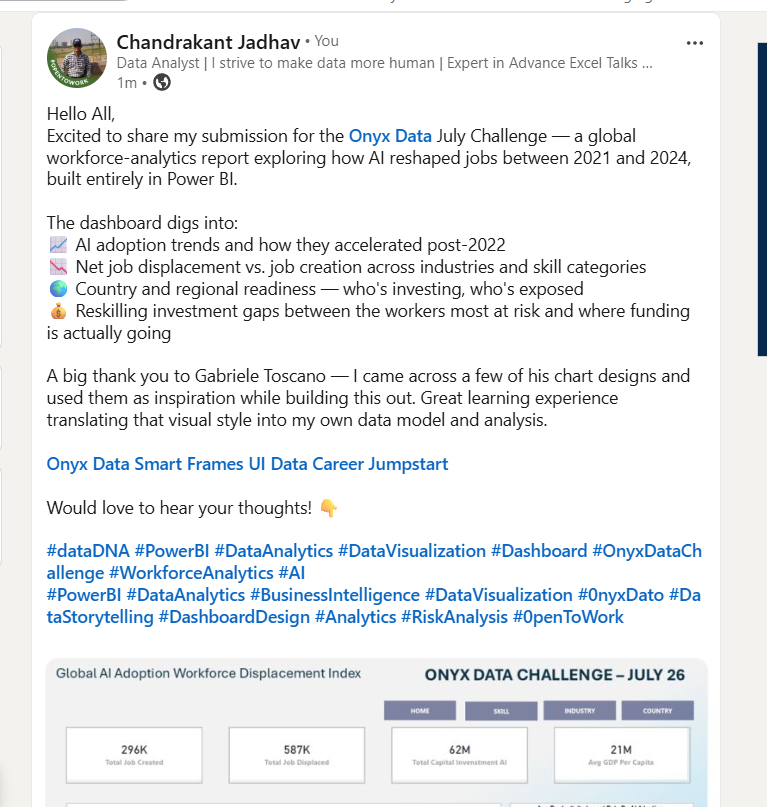
The dashboard digs into: 📈 AI adoption trends and how they accelerated post-2022 📉 Net job displacement vs. job creation...
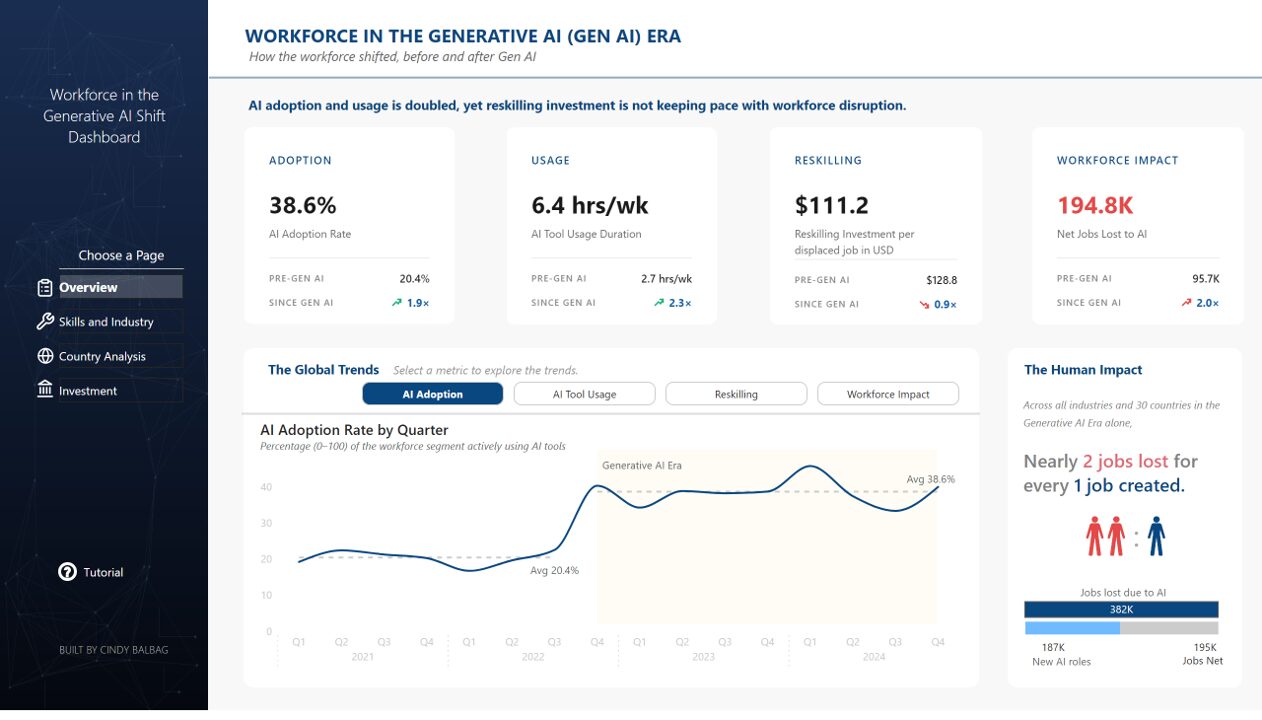
The report was divided into 4 pages: 1. Overview Showcases the shift in AI adoption, AI tool usage, and workforce...
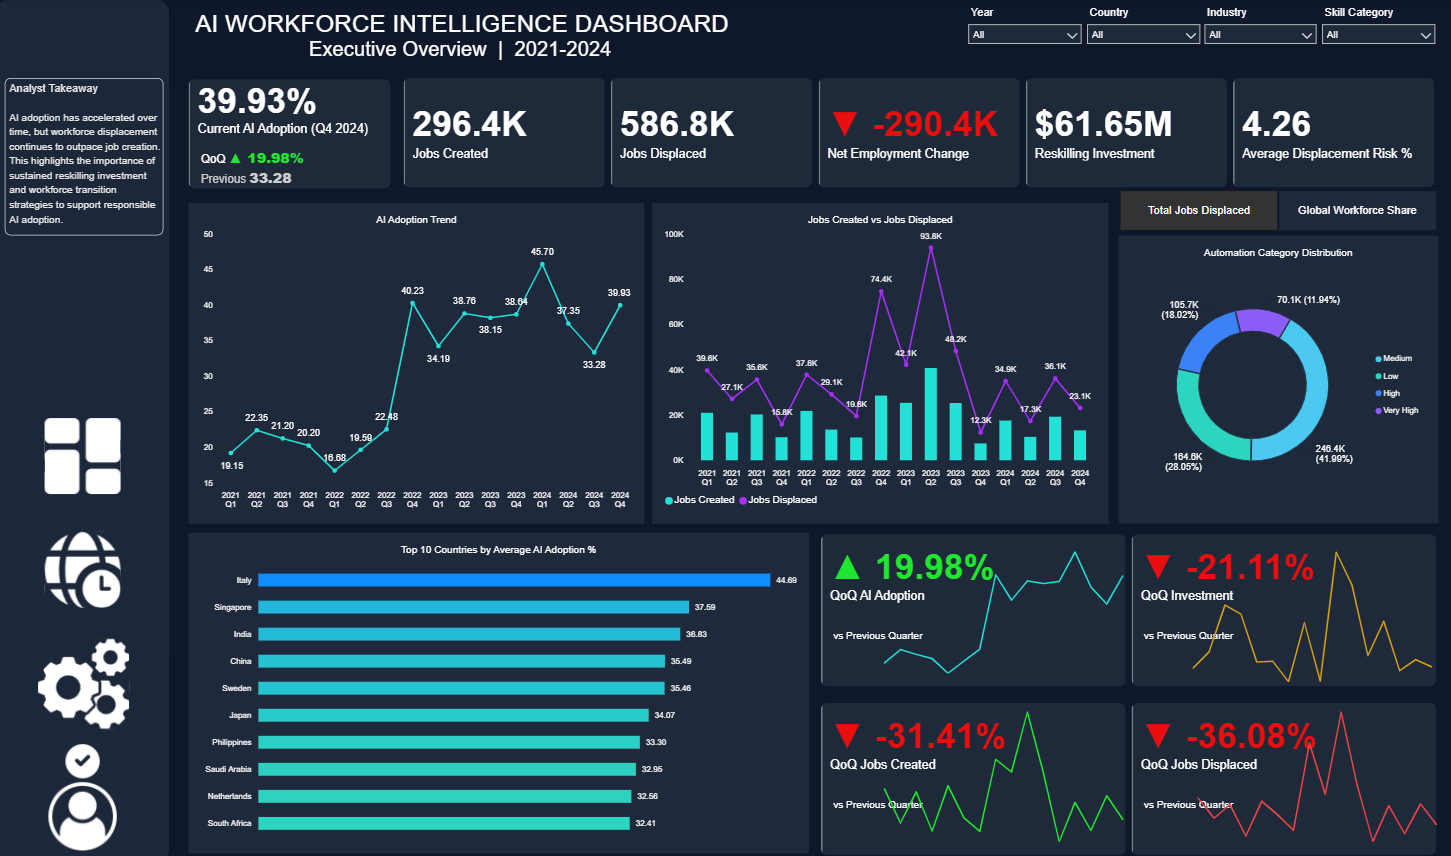
Developed an interactive Power BI dashboard for the July 2026 DataDNA Challenge to analyze global AI adoption and workforce displacement...
Discover the latest AI & Data challenges


Contact our team

16 Upper Woburn Place, London, Greater London, WC1H 0AF, United Kingdom