Join a community of the most creative Business Intelligence Professionals
Join a community of the most creative Business Intelligence Professionals
View the DataDNA Data Visualisation portfolios below
Browse AI-reviewed portfolios from our global community of data professionals
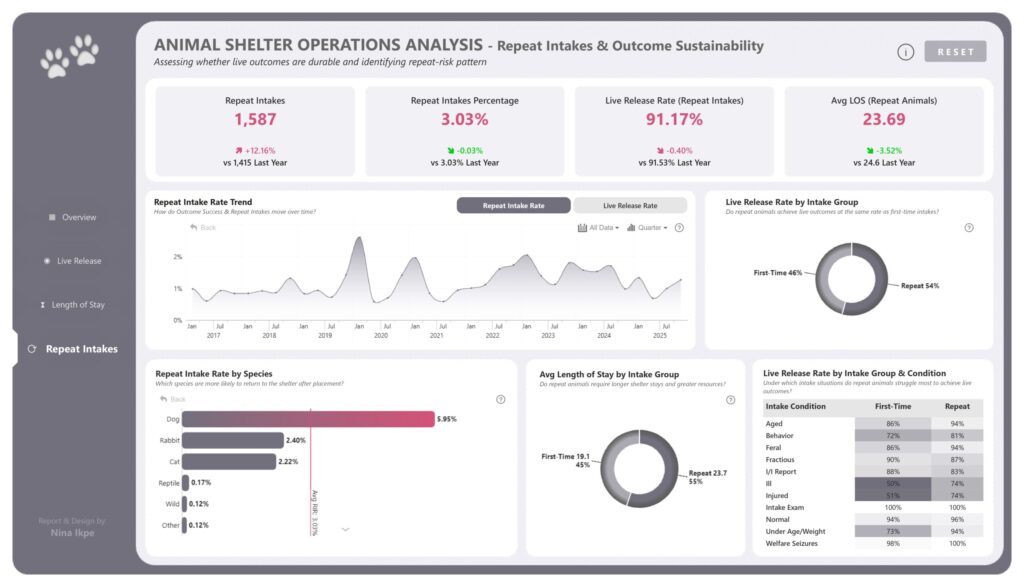
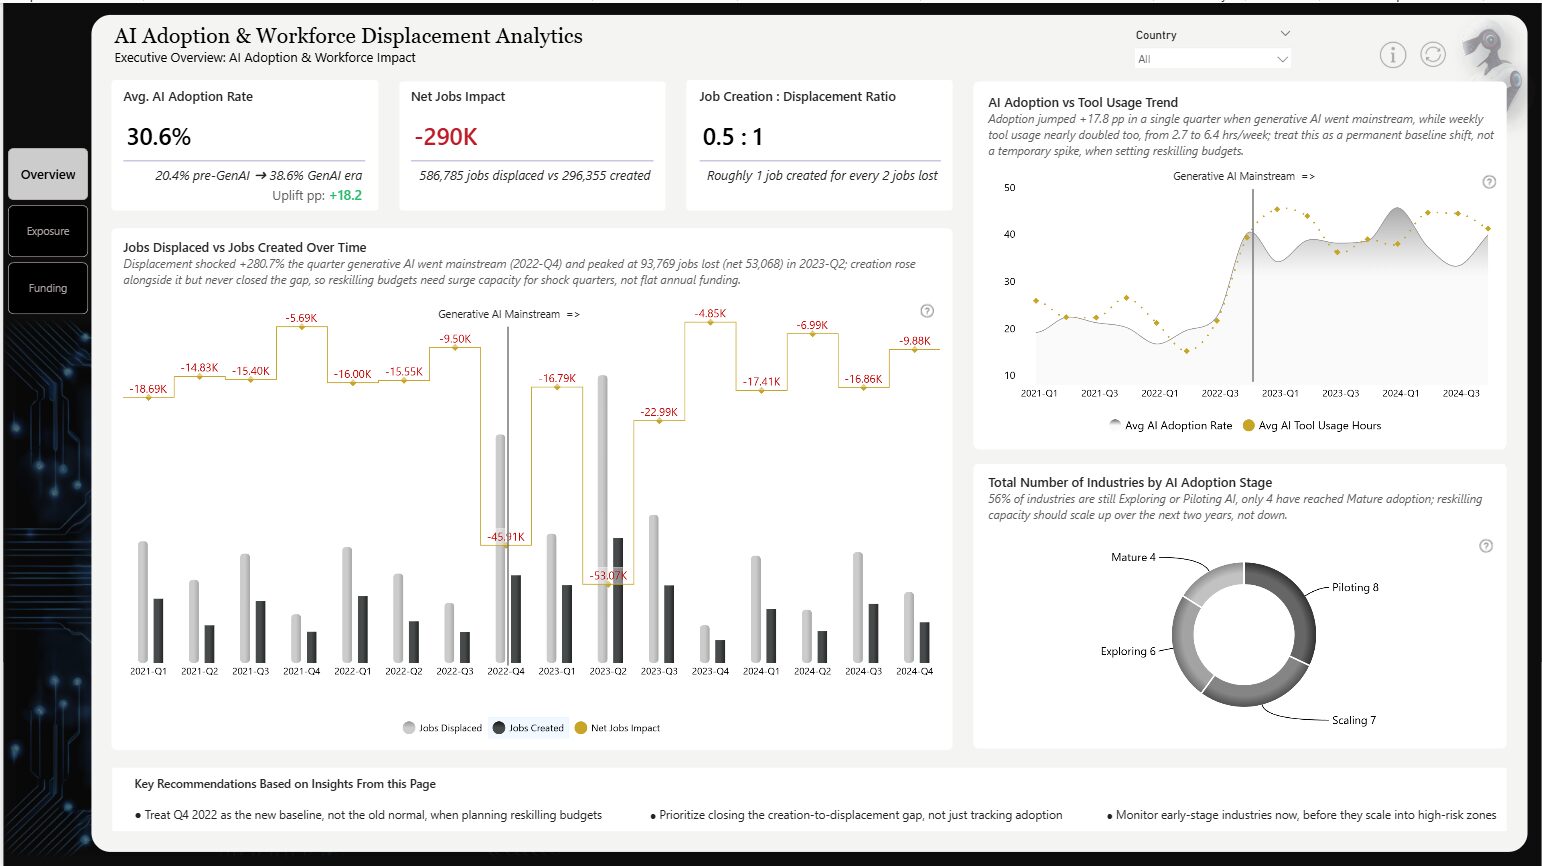
Global AI Report created and submitted for ONYX july data challenge
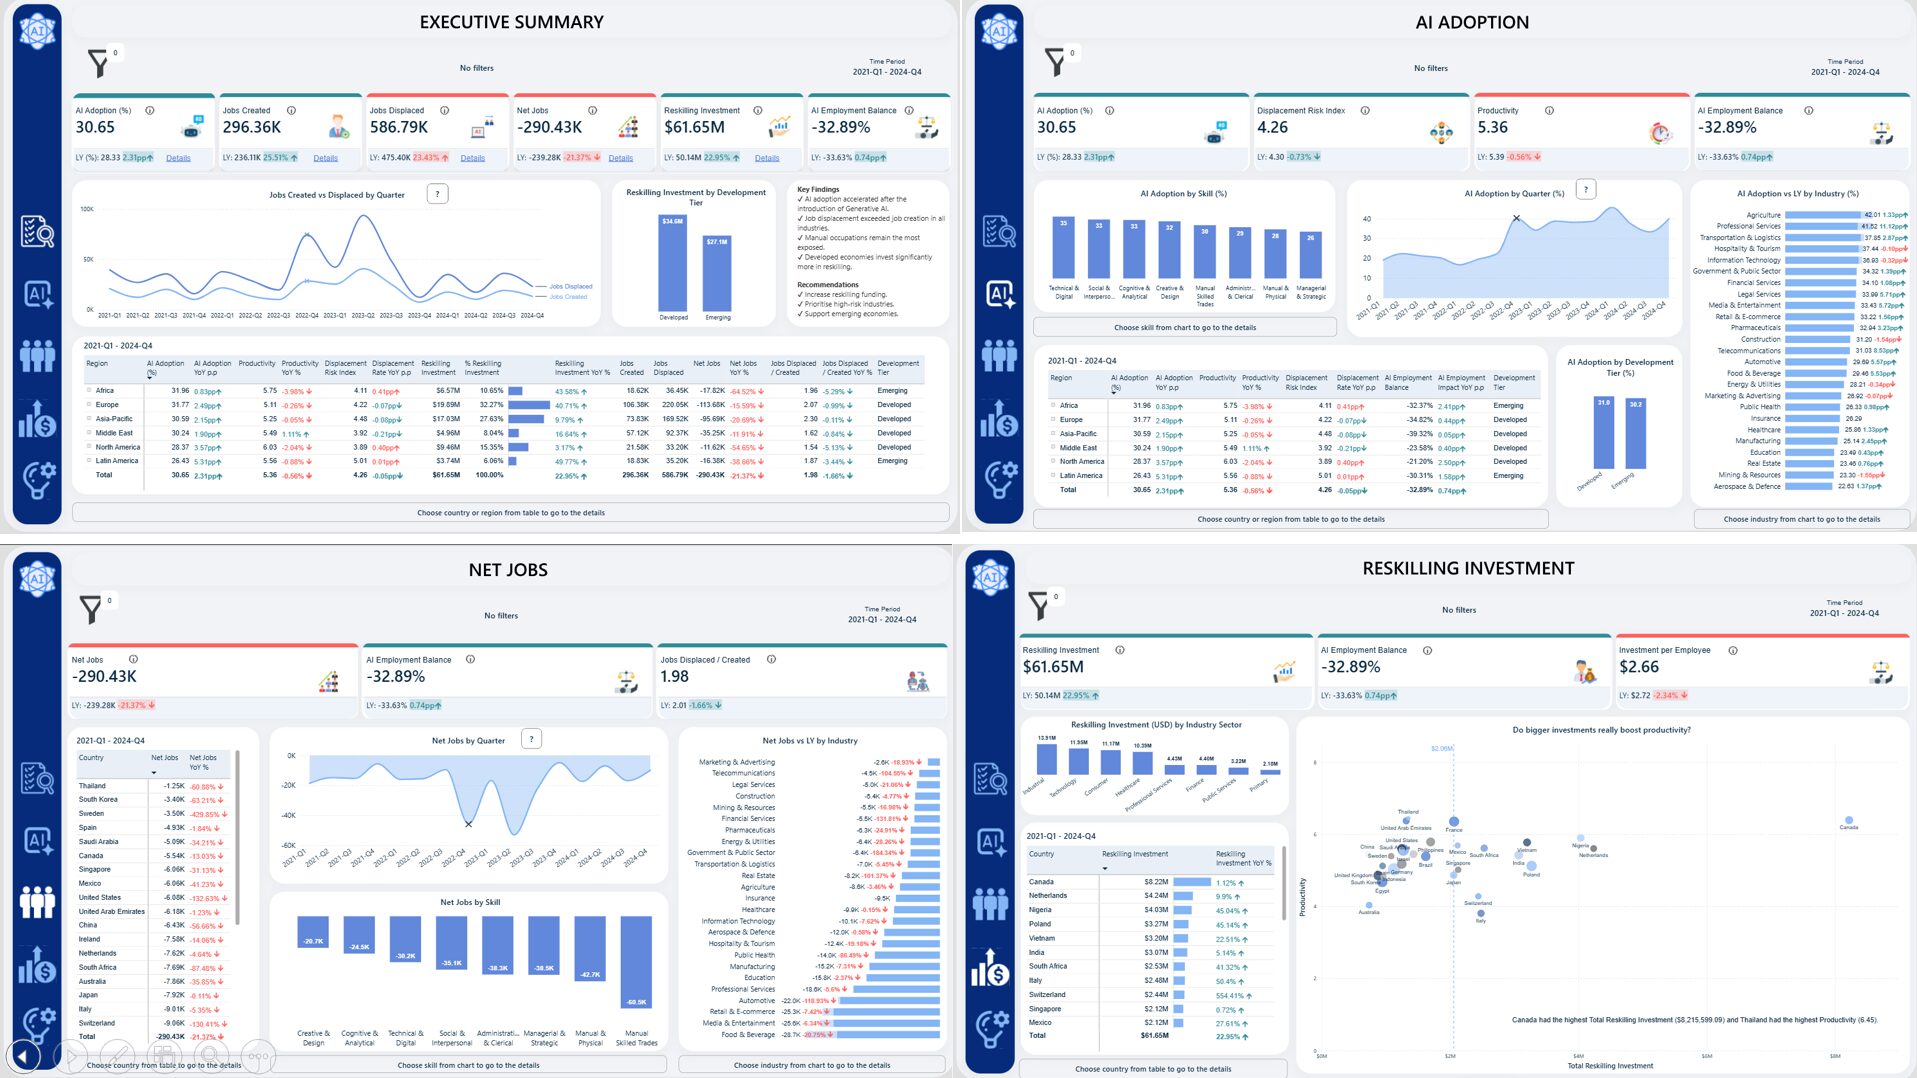
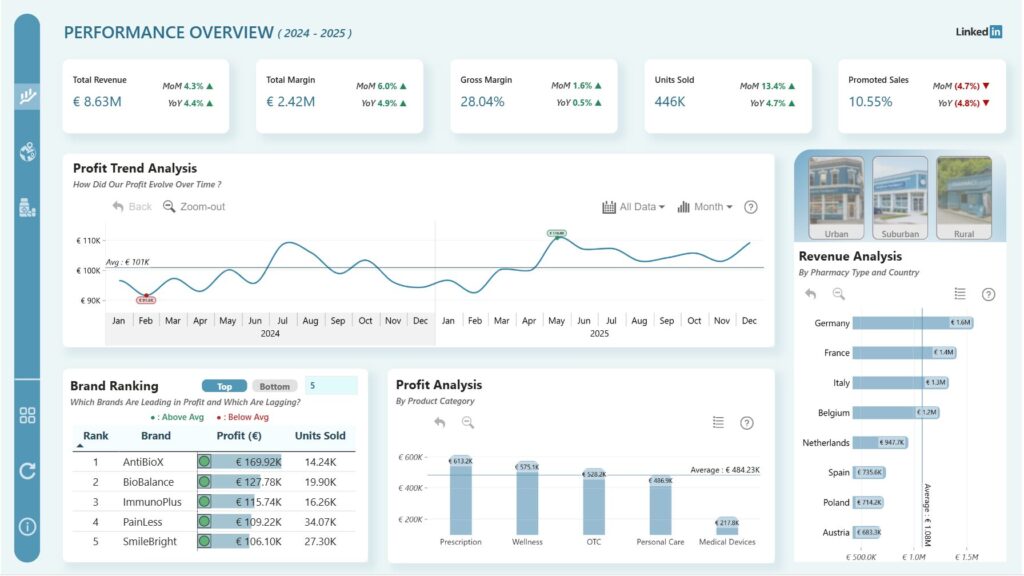
My goal was to create an executive-ready Power BI dashboard that helps policymakers understand how Artificial Intelligence is transforming labour...
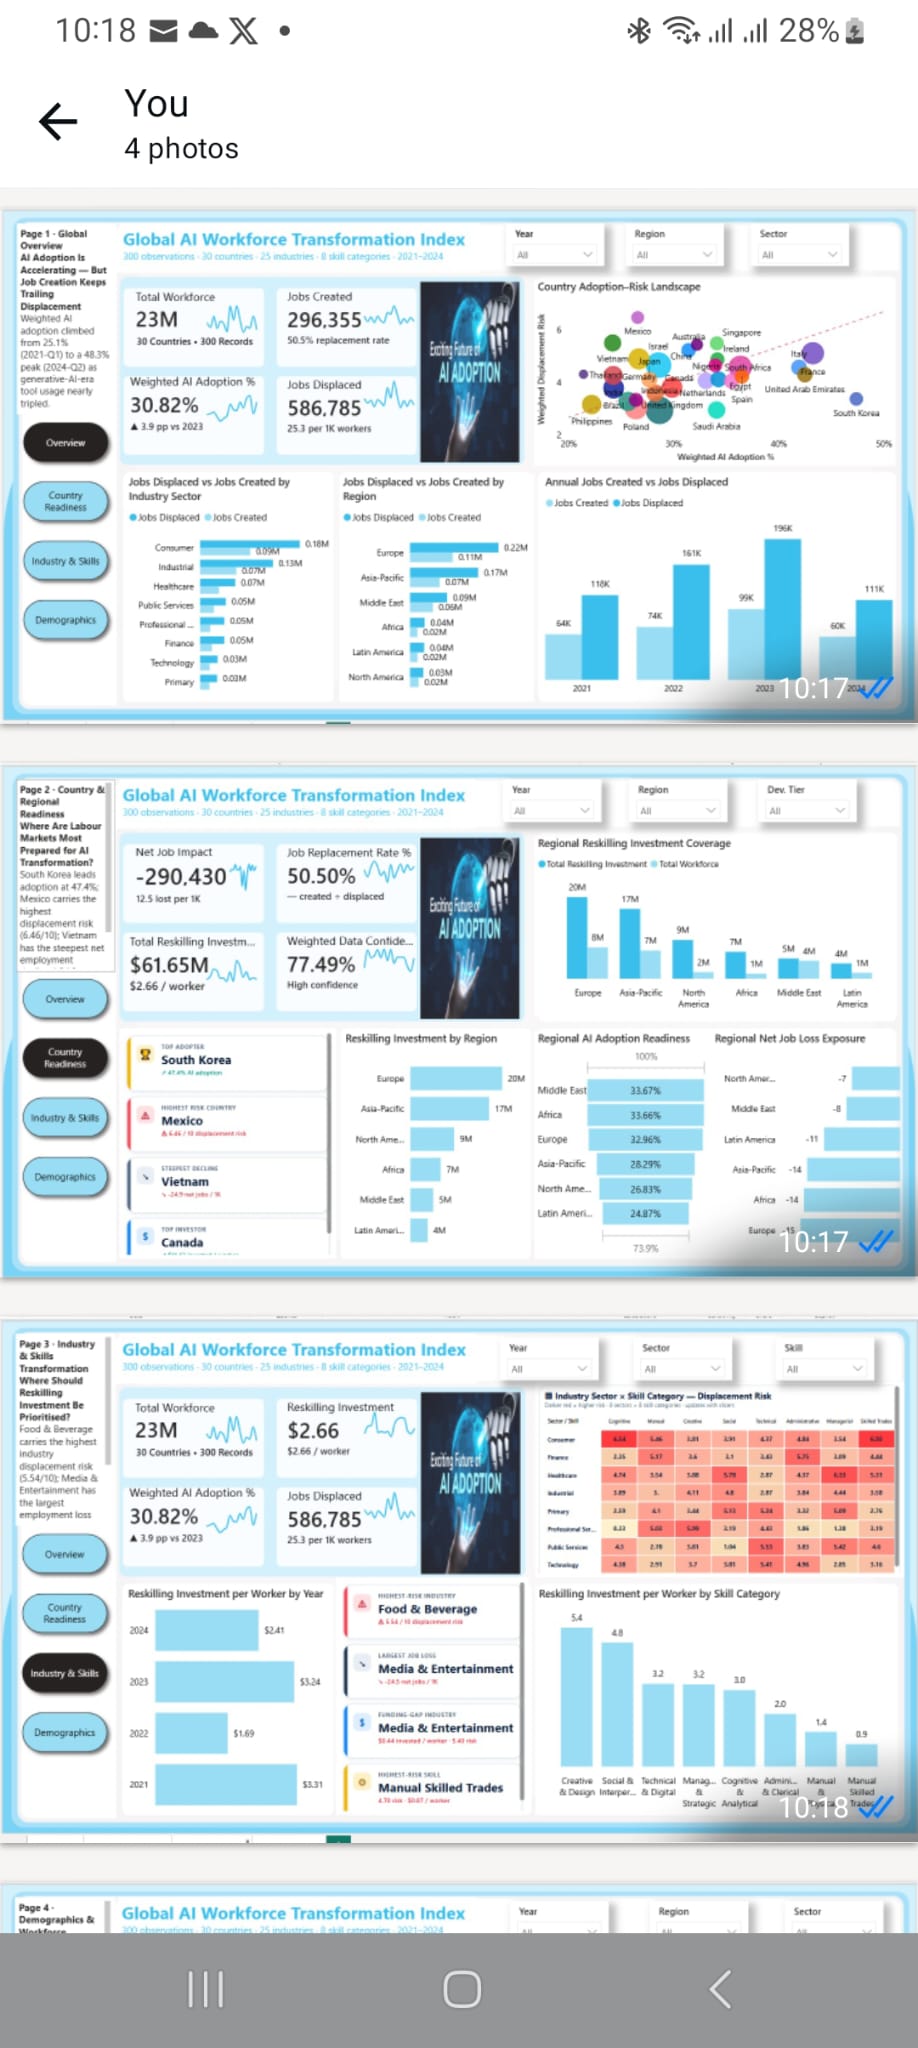
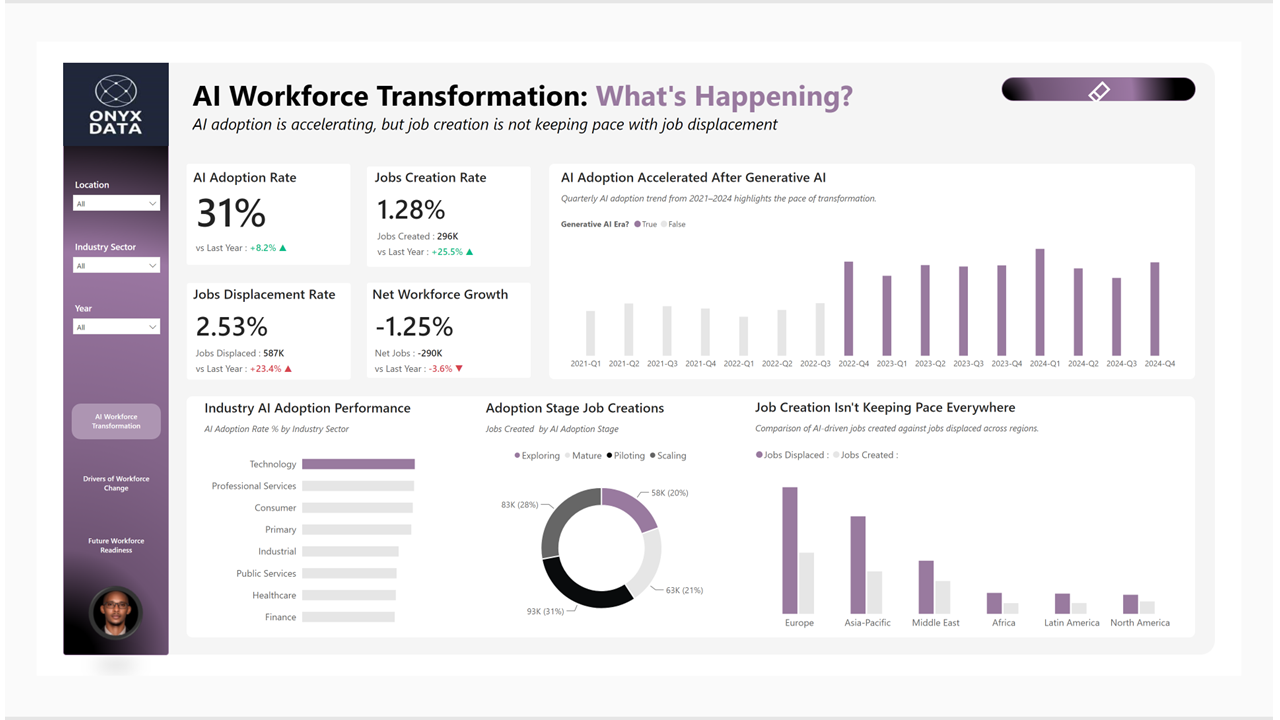
For this project, I developed a four-page Power BI dashboard to analyse how AI adoption is transforming the global workforce...
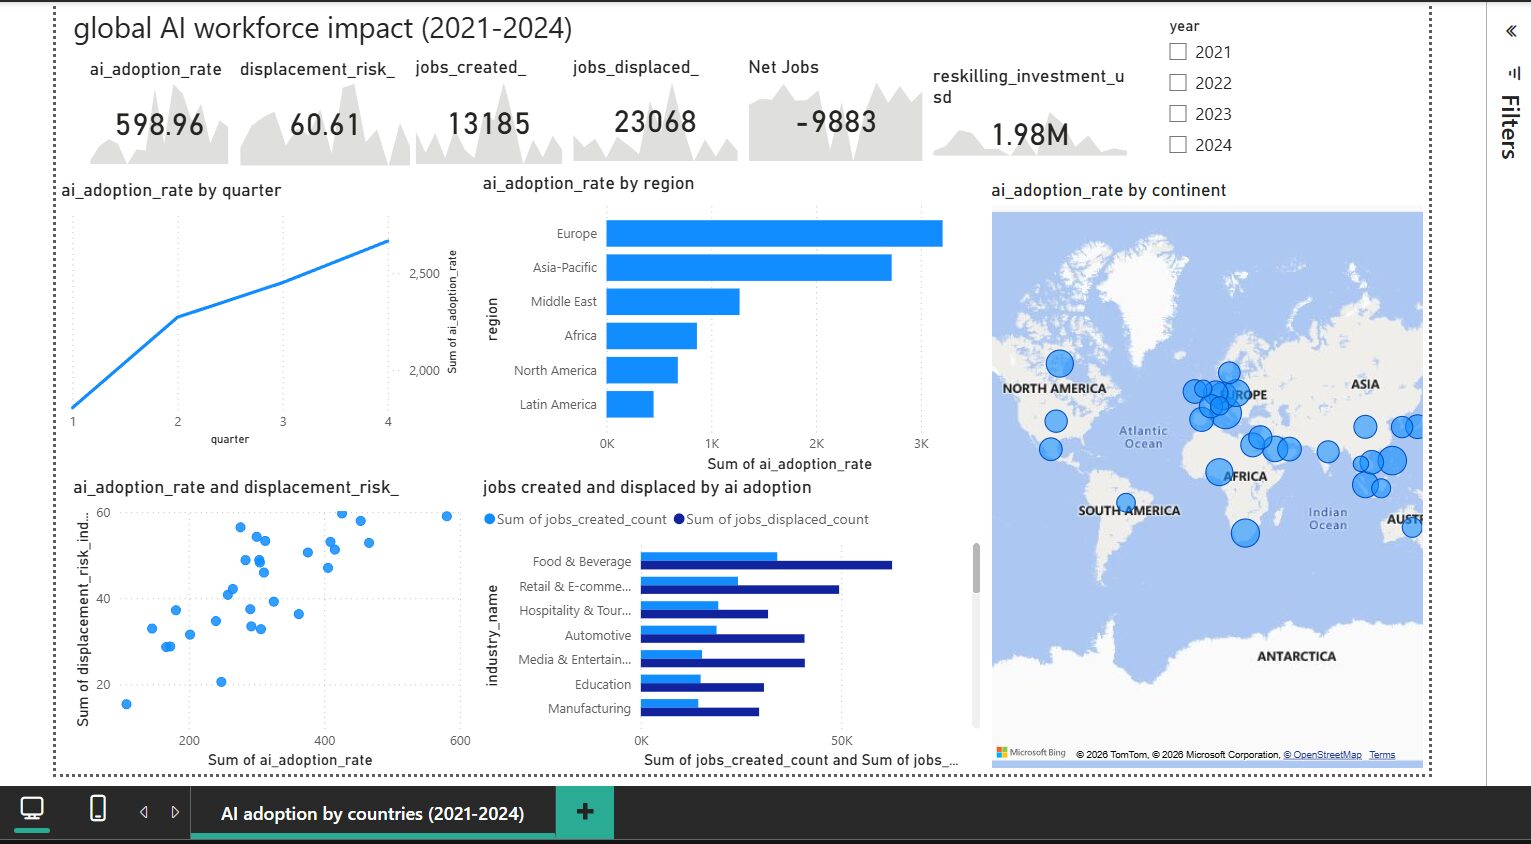
Excited to share my latest Power BI project – Global AI Workforce Impact Dashboard (2021–2024), created as part of a...
My approach to this dataset was to tell a compelling story about how AI adoption has accelerated over time and...
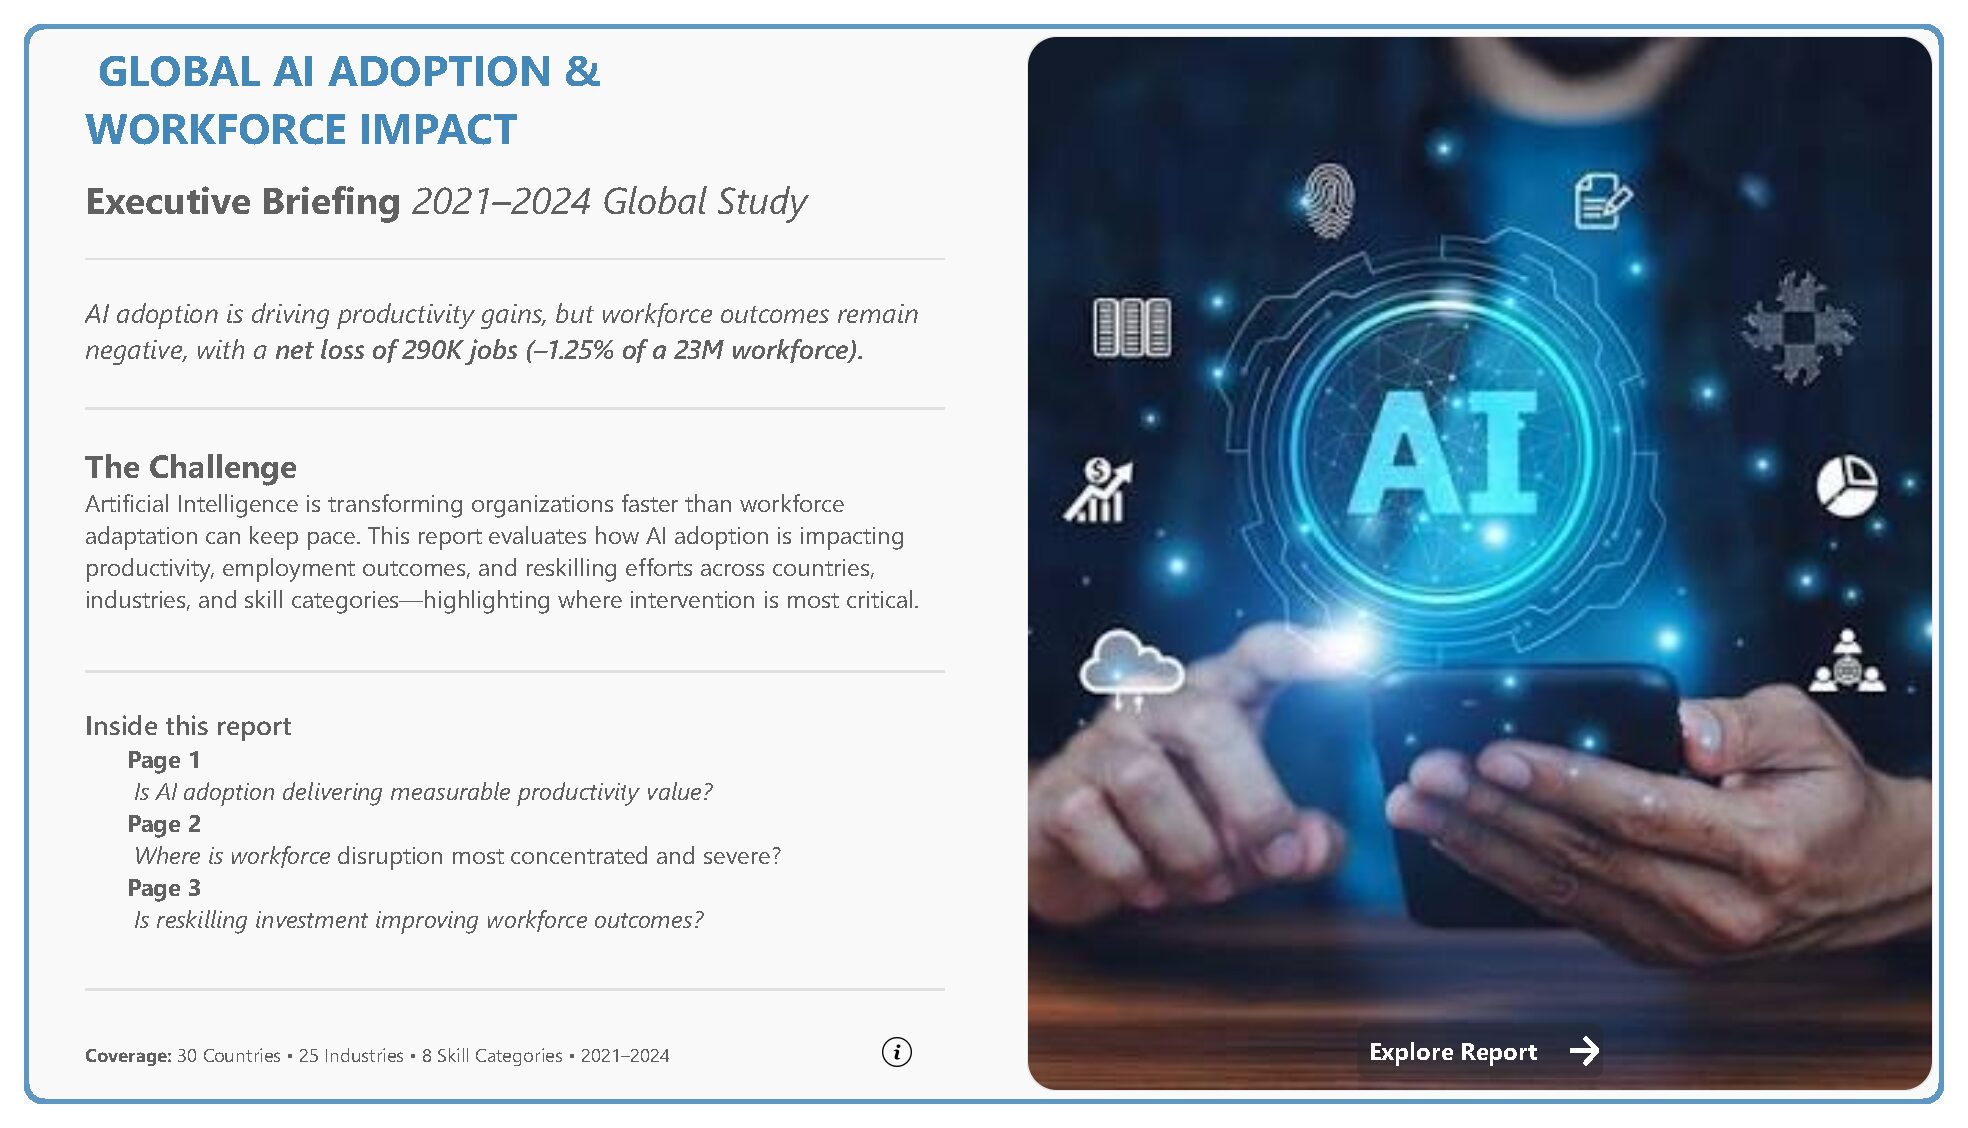
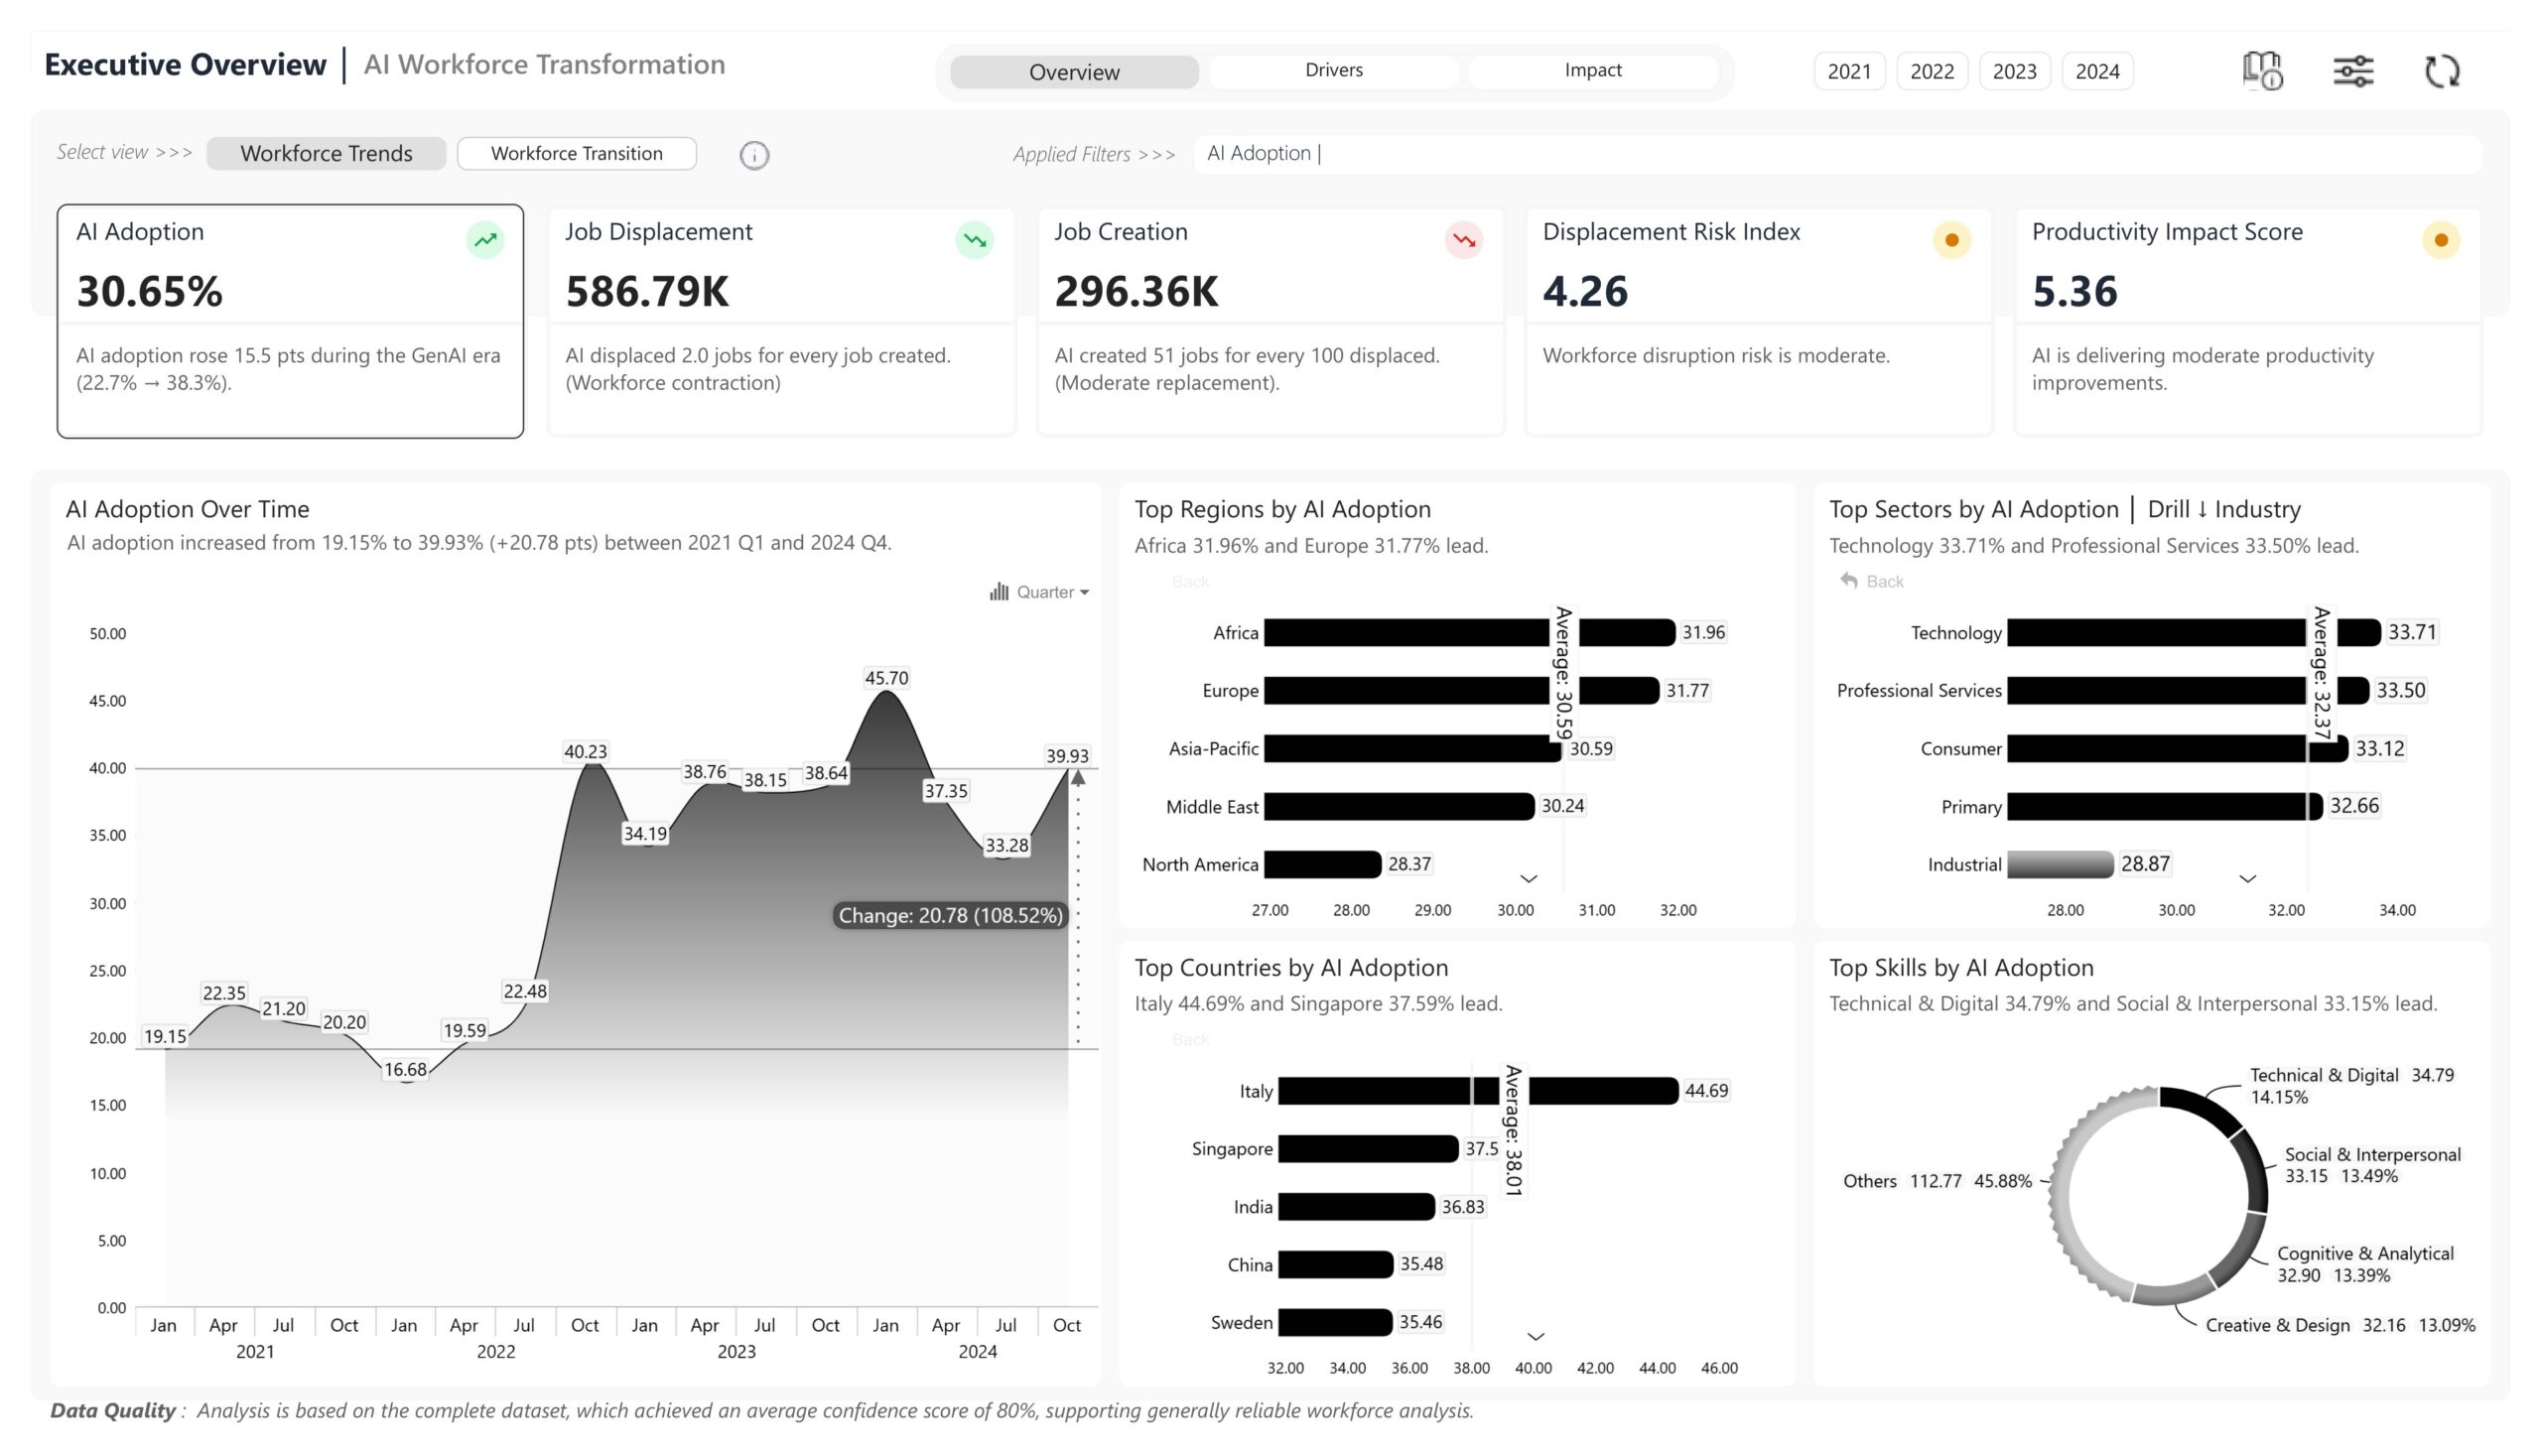
An executive-focused Power BI report analyzing the impact of AI adoption on productivity, workforce dynamics, displacement risk, and reskilling investment...
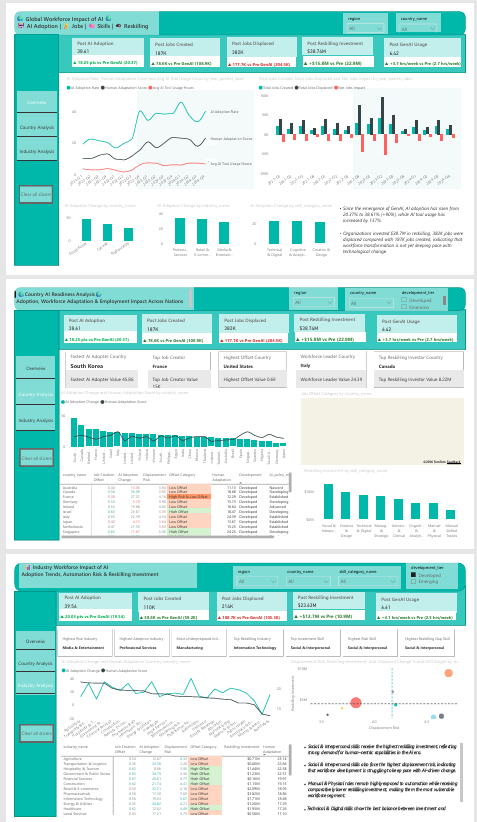
📊 Key insights: ✅ AI adoption nearly doubled after the GenAI era ✅ AI tool usage increased significantly across industries...
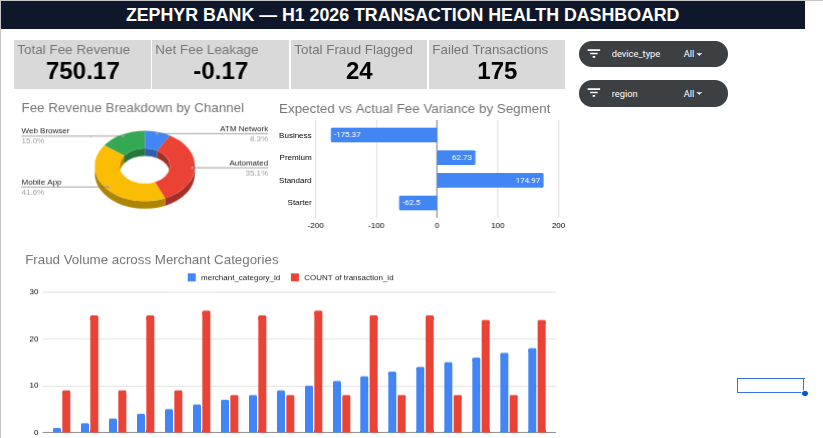
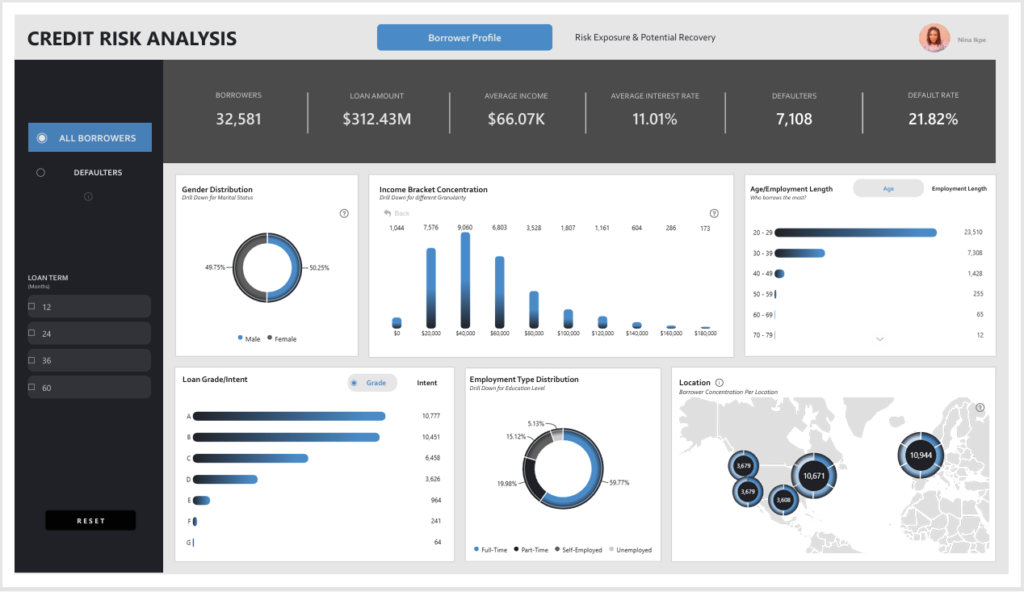
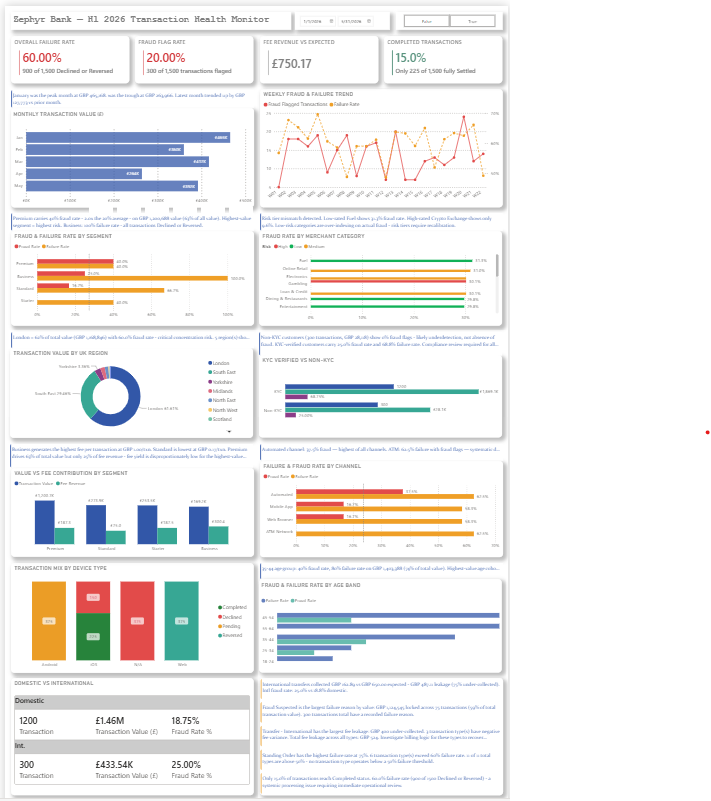
As an embedded Data Analyst within the Risk, Product, and Finance teams at Zephyr Bank (a UK fintech neobank), this...
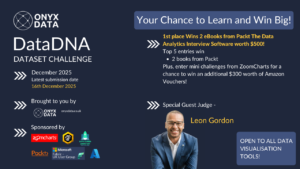
Discover the latest AI & Data challenges


Contact our team

16 Upper Woburn Place, London, Greater London, WC1H 0AF, United Kingdom