Join a community of the most creative Business Intelligence Professionals
Join a community of the most creative Business Intelligence Professionals
View the DataDNA Data Visualisation portfolios below
Browse AI-reviewed portfolios from our global community of data professionals
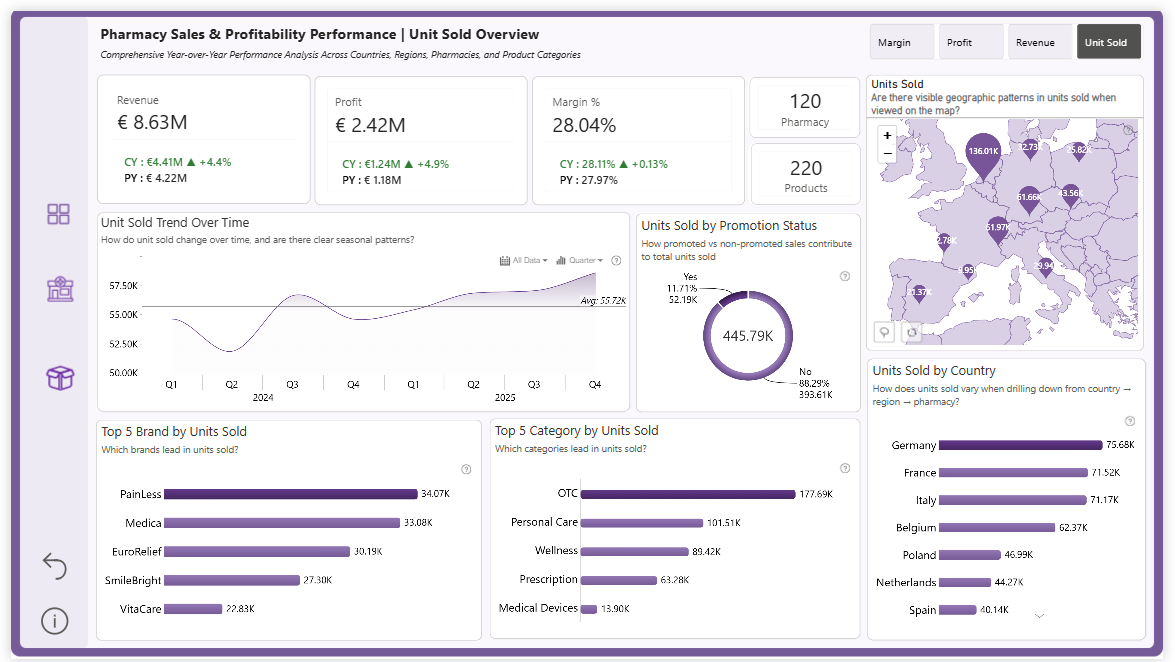
Built a 3-page Power BI dashboard analyzing €8.63M revenue, €2.42M profit, and 28.04% margin across 120 pharmacies, 220 products, and...
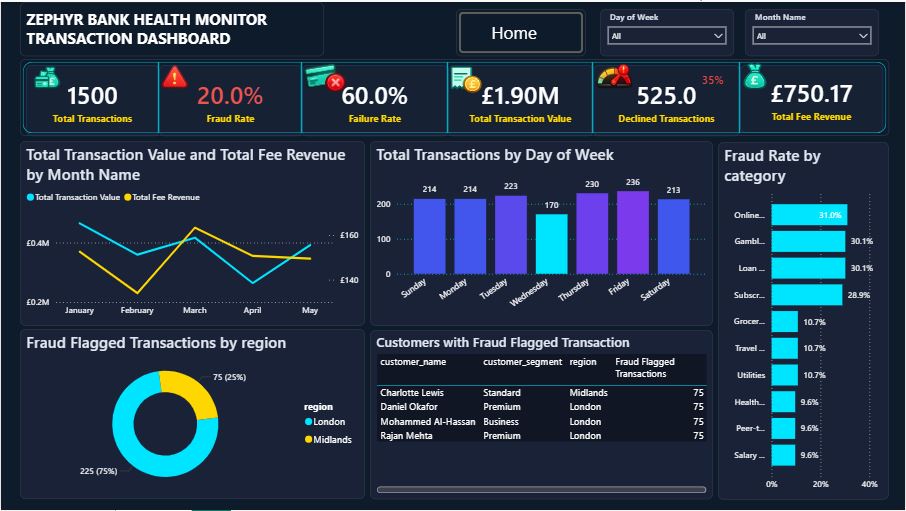
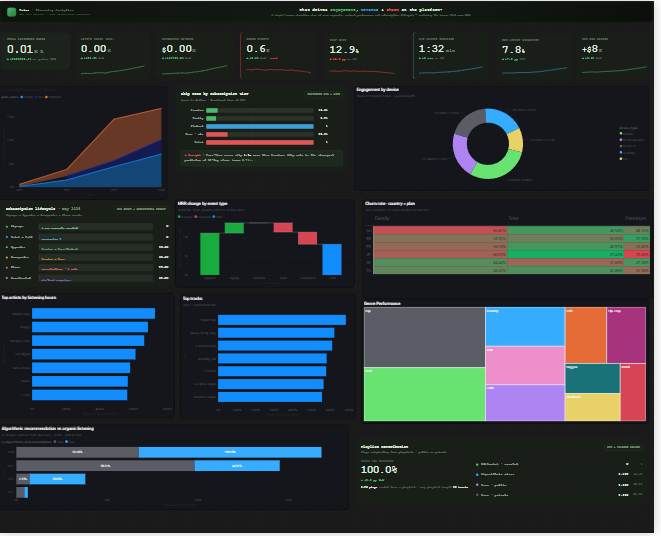
Key Insights Included: Total Transactions, Fraud Rate Analysis, Failure Rate Monitoring, Declined Transaction Tracking, Total Transaction Value, Fee Revenue Analysis,...
The dashboard walks you through what is happening, why it is happening, and where the strategic opportunities are. Business Health...
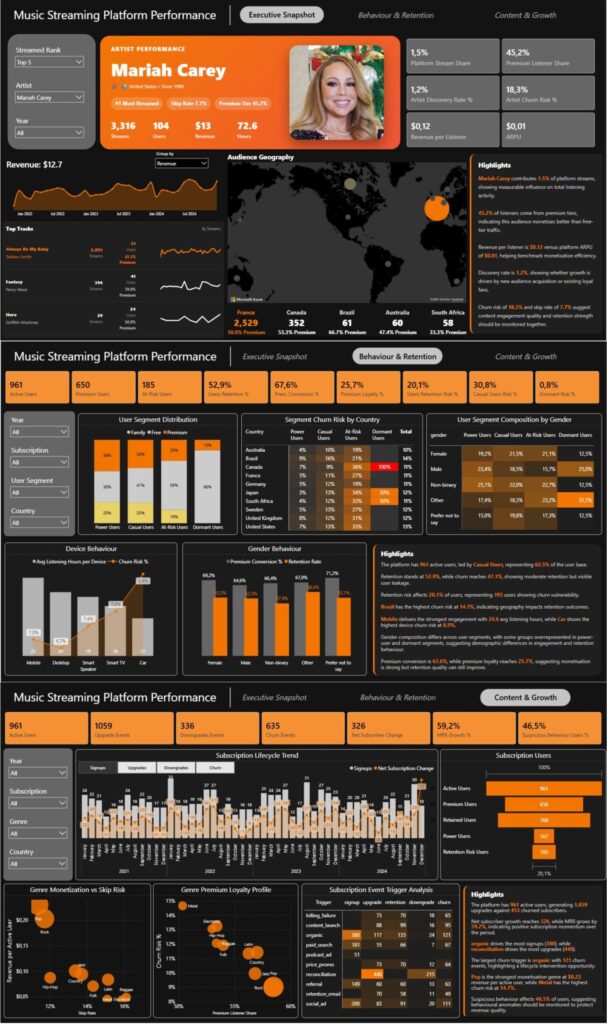
This Power BI dashboard provides a comprehensive view of music streaming platform performance by analyzing user engagement, subscription trends, churn...

This dashboard is designed to help leadership monitor growth trends, identify high-performing content and markets, understand user retention patterns, and...

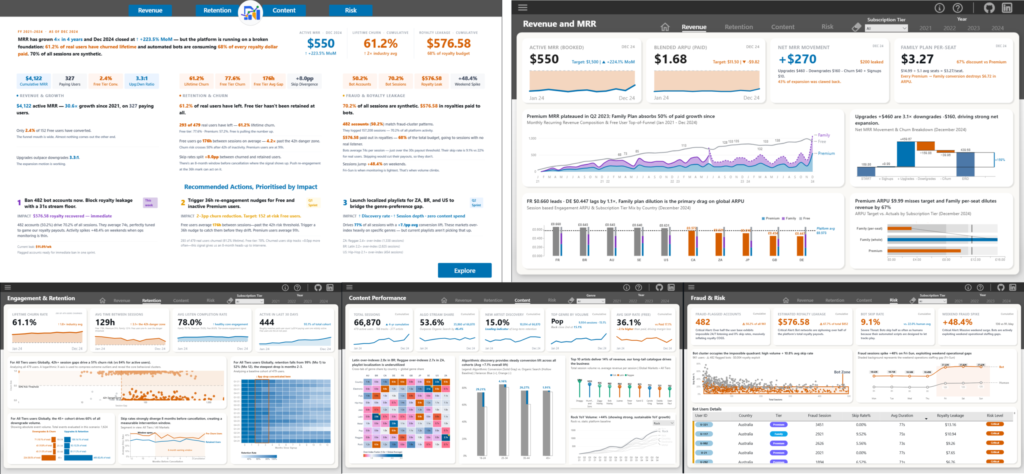
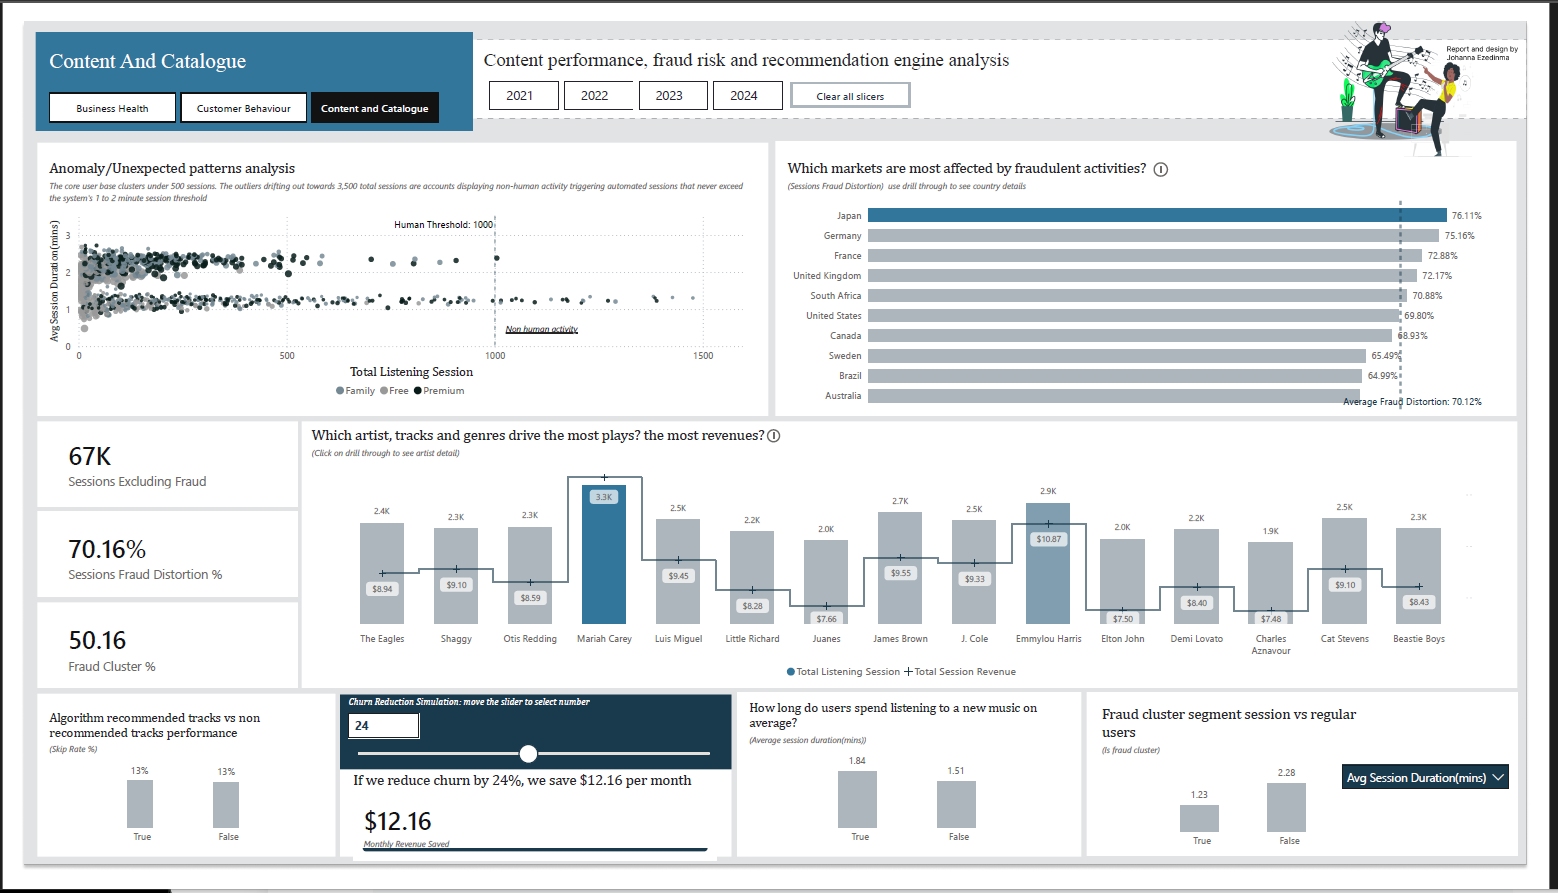
An interactive, 5-page Power BI dashboard designed to analyze a music streaming ecosystem, seamlessly combining high-level financial health tracking with...

This comprehensive analysis of the ‘music streaming’ dataset reveals a robust yet nuanced business landscape. The platform enjoys healthy revenue...

This report synthesises four years of operational data from a mid-size global music streaming platform into a coherent strategic narrative....
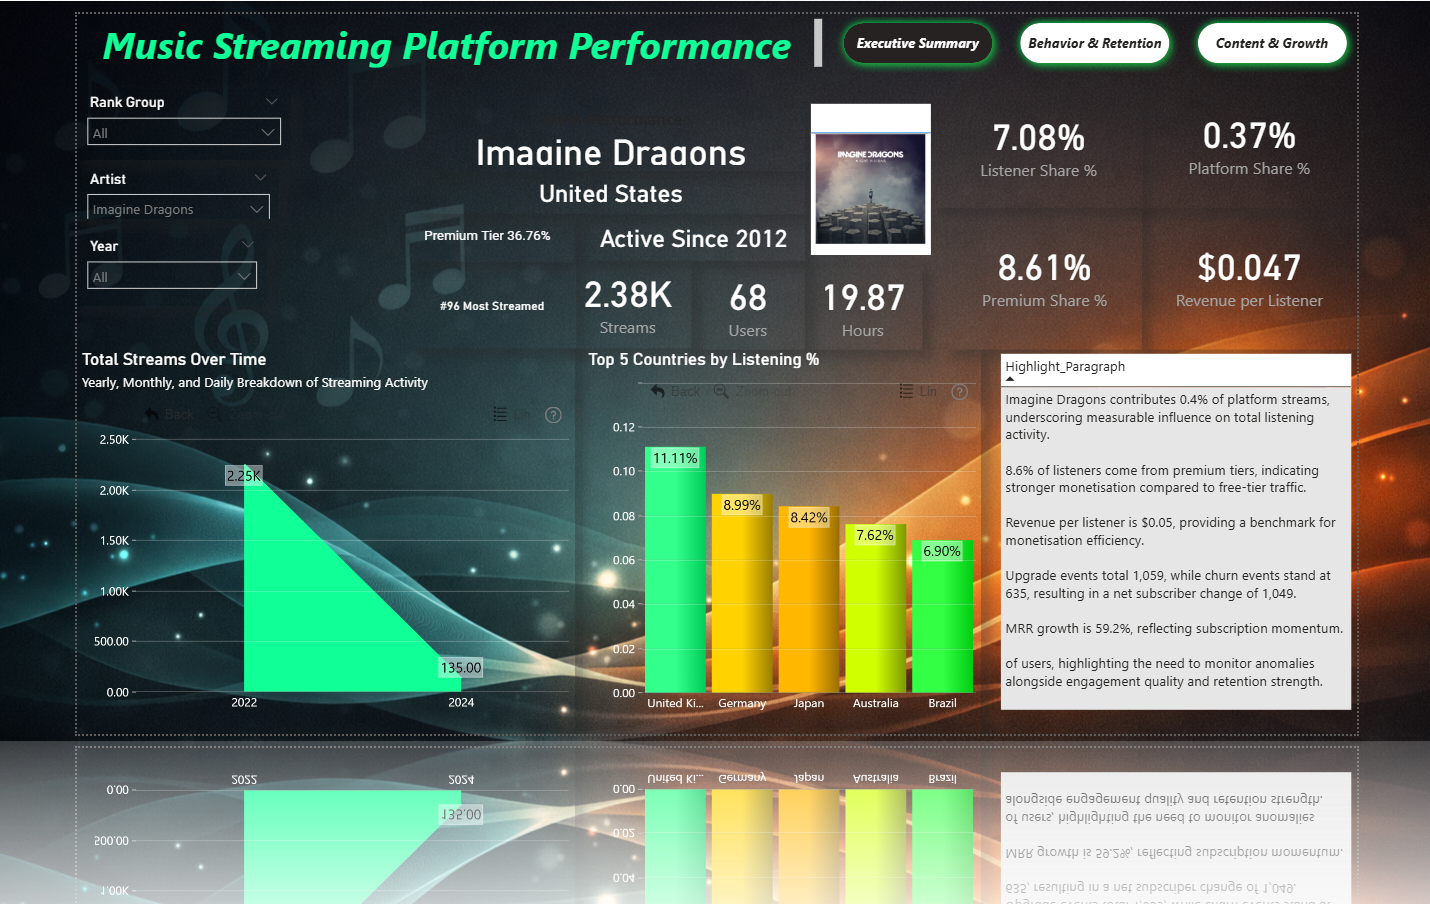
Devloped a 3 page executive dashboard highlighting music Streaming Platform Performance across users, artists, platforms and events.
Discover the latest AI & Data challenges


Contact our team

16 Upper Woburn Place, London, Greater London, WC1H 0AF, United Kingdom