Join a community of the most creative Business Intelligence Professionals
Join a community of the most creative Business Intelligence Professionals
Join thousands of data analysts competing in monthly challenges. Submit your work, receive detailed scores across 5 dimensions, and build a verified portfolio.
Get the monthly challenge dataset and brief
Build your data visualisation using any tool
Upload your work before the deadline
Receive detailed scores across 5 dimensions
Showcase your verified skills to recruiters
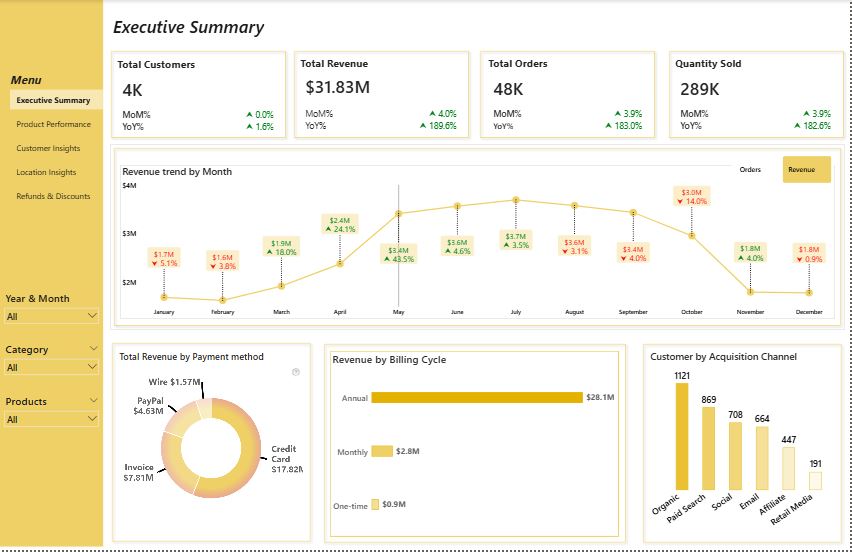
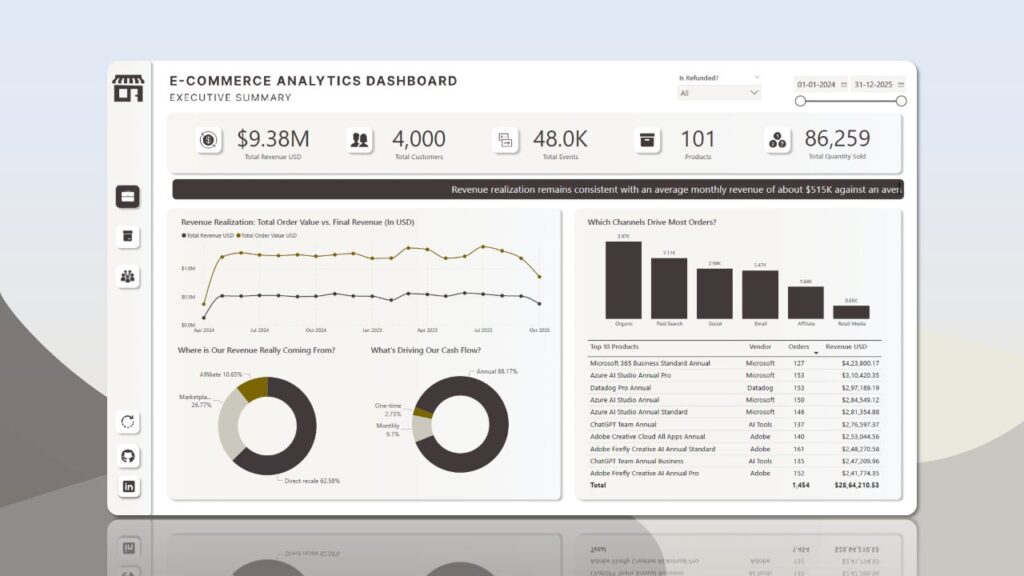
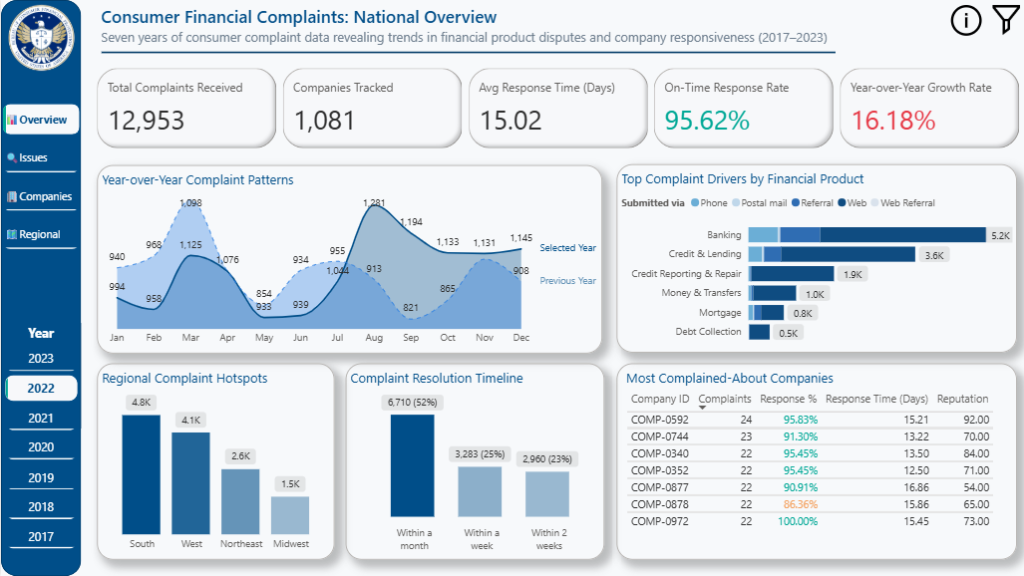
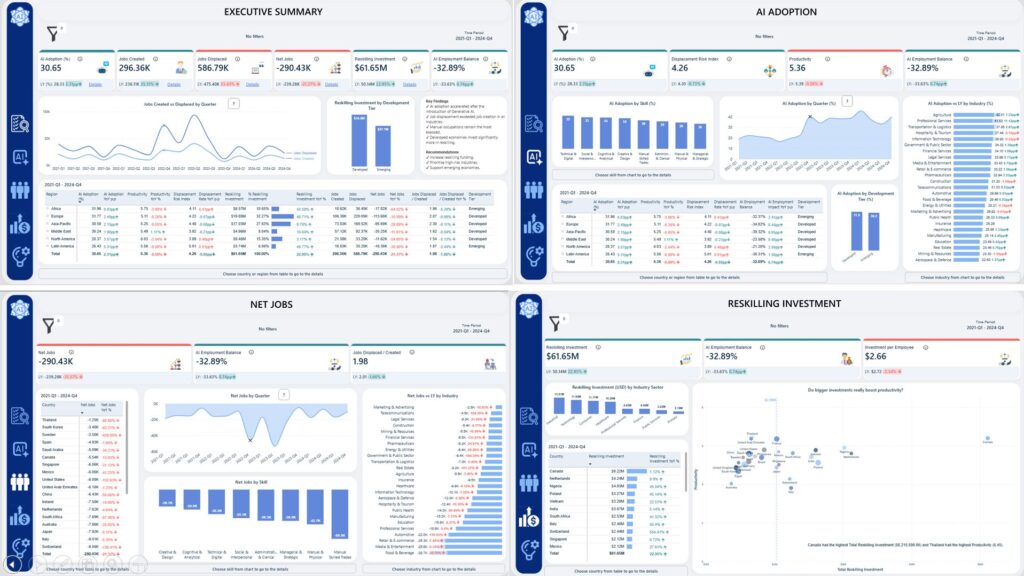
Every submission receives detailed scores across Data Story, Design, Interactivity, Visual Appeal, and Accessibility dimensions.
Compete in monthly challenges, get AI feedback, and build your verified portfolio
Start Your First ChallengeConnect with engaged data talent and showcase your brand to the community
Learn MoreFind data professionals with skills verified through real challenge performance
Browse Talent