
Join a community of the most creative Business Intelligence Professionals
Join a community of the most creative Business Intelligence Professionals
Find data professionals with skills verified through real challenge performance.
Browse Talent DirectoryCreate realistic synthetic data for training, testing, and demonstrations.
Explore Dataset Generator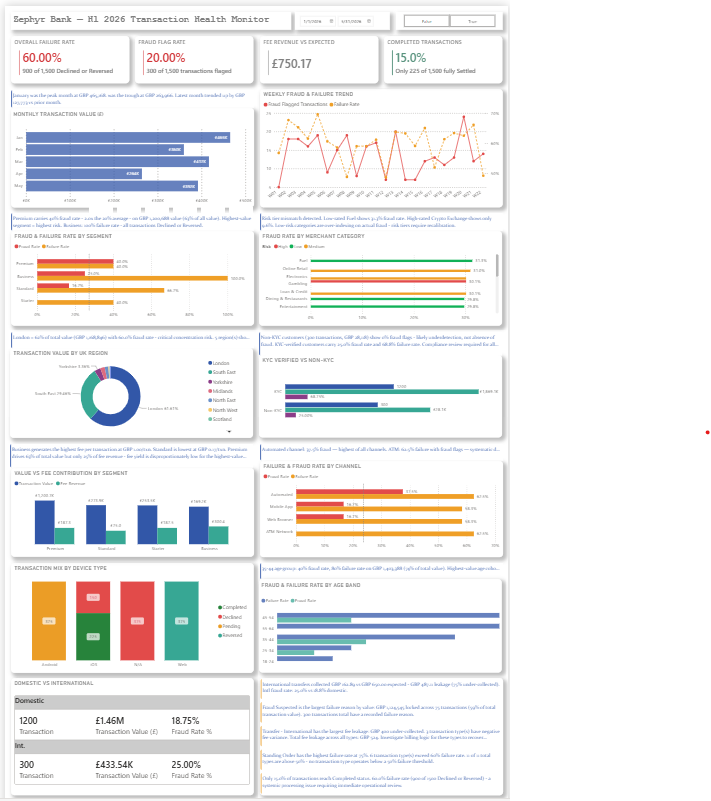
This dashboard analyzes transaction performance, fraud exposure, operational failures, and revenue leakage across a fintech banking environment. The goal was not only to visualize KPIs but also to uncover actionable business insights. 🔍 Key Insights Identified: ✅ Only 15% of transactions reached a completed status, indicating significant operational inefficiencies. ✅ Premium customers generated 63% of total transaction value while also exhibiting a fraud rate 2x higher than the portfolio average. ✅ London contributed 61.61% of total transaction value but showed a 60% fraud rate, highlighting a critical concentration risk. ✅ International transactions experienced 75% fee leakage compared to expected revenue. ✅ Business segment transactions showed a 100% failure rate, requiring immediate investigation. ✅ Fraud risk scoring appears misaligned, with some low-risk categories exhibiting higher fraud rates than high-risk categories. 📈 Dashboard Features: • Executive KPI monitoring • Fraud & failure trend analysis • Customer segment performance • Geographic risk assessment • Revenue leakage detection • Automated insight generation using DAX
 Get In Touch
Contact our team

16 Upper Woburn Place, London, Greater London, WC1H 0AF, United Kingdom




 Mohammed Mirzan
 Philani Xulu
 Peter N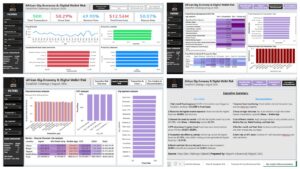
 Mayomi Oluwapelumi