Join a community of the most creative Business Intelligence Professionals
Join a community of the most creative Business Intelligence Professionals
Find data professionals with skills verified through real challenge performance.
Browse Talent DirectoryCreate realistic synthetic data for training, testing, and demonstrations.
Explore Dataset Generator

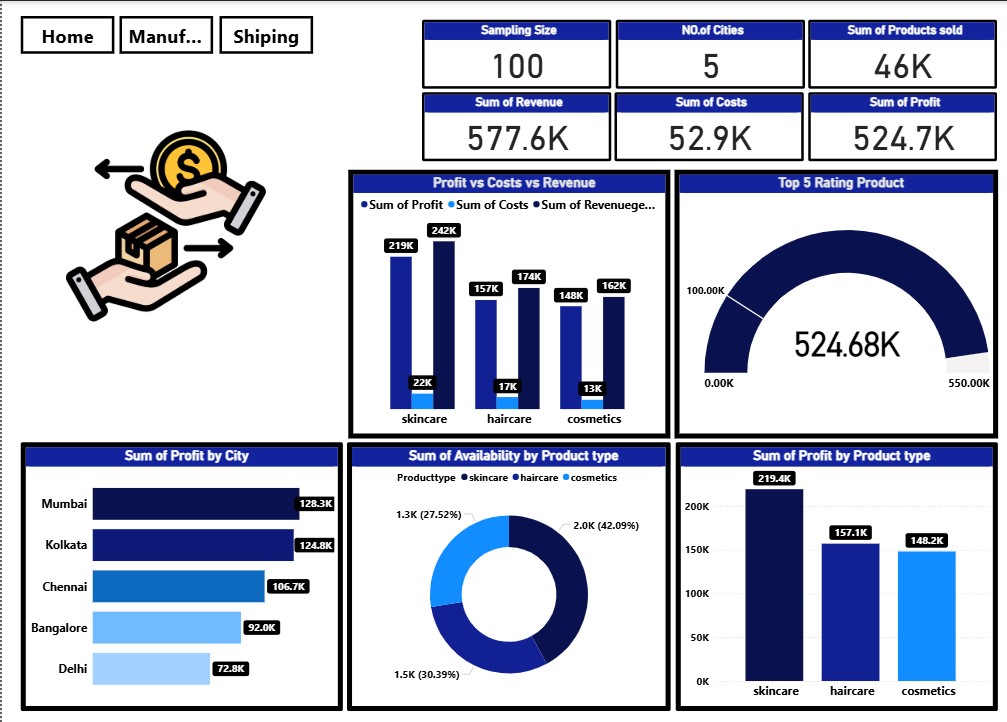
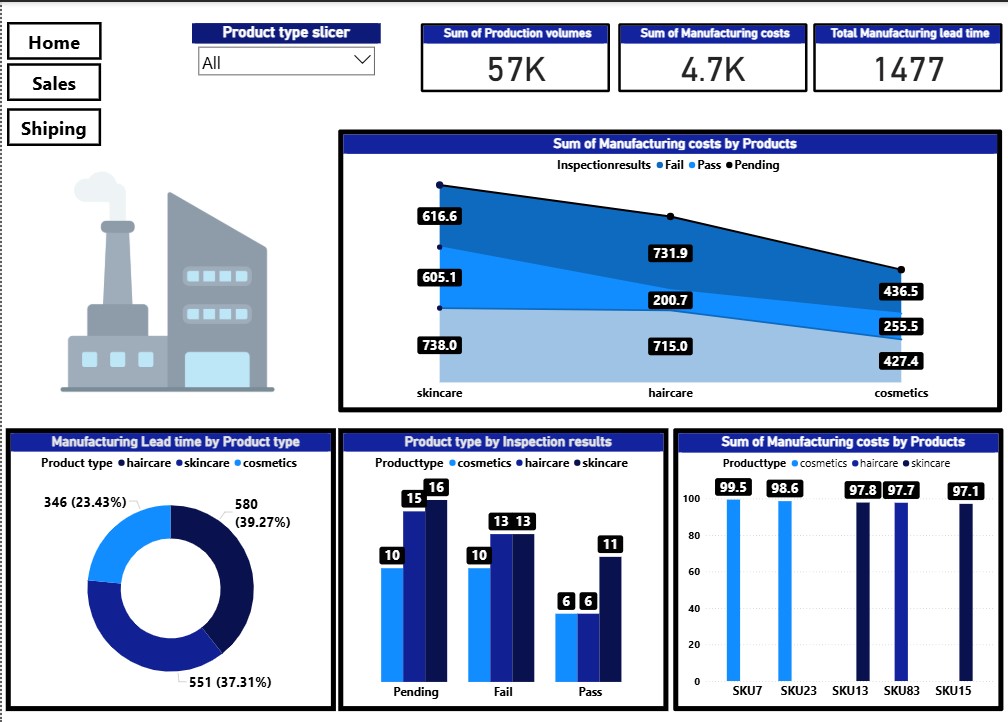
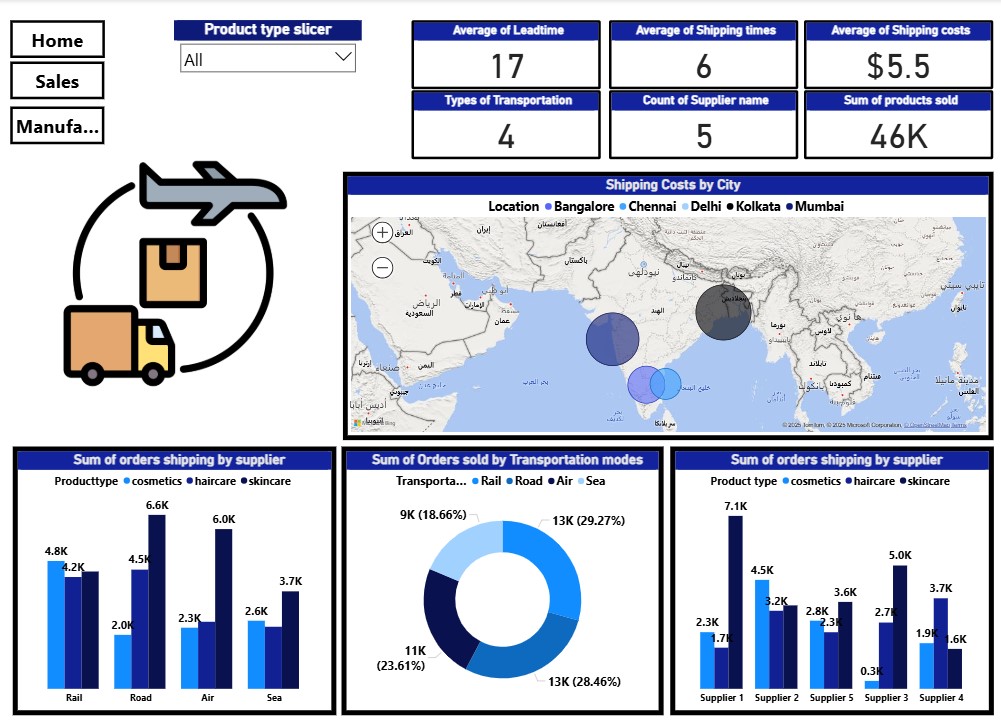
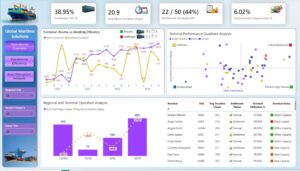
An interactive dashboard designed to analyze and optimize supply chain performance across three key areas: Manufacturing, Shipping, and Sales. Built using Power BI and structured on a star schema model, this project offers data-driven insights into delivery times, revenue by product categories, shipping carriers, and customer behavior across regions. Key insights include: - Fastest shipping methods by average delivery time - Revenue trends across regions and product categories - Supplier performance and contribution to sales - High-value order patterns and payment method preferences This dashboard enables stakeholders to monitor KPIs, identify bottlenecks, and make informed decisions that enhance overall supply chain efficiency
Contact our team

16 Upper Woburn Place, London, Greater London, WC1H 0AF, United Kingdom


 Jomer Casugay
 Iman Ngwepe