Join a community of the most creative Business Intelligence Professionals
Join a community of the most creative Business Intelligence Professionals
Find data professionals with skills verified through real challenge performance.
Browse Talent DirectoryCreate realistic synthetic data for training, testing, and demonstrations.
Explore Dataset Generator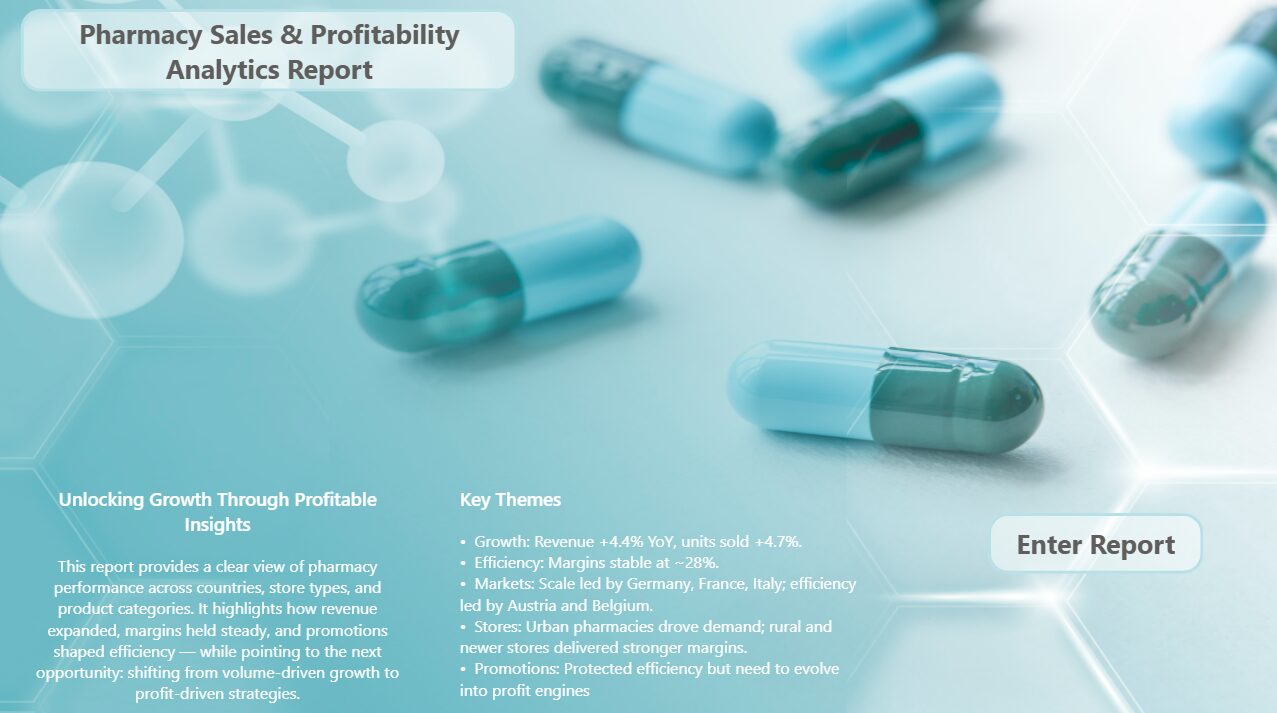
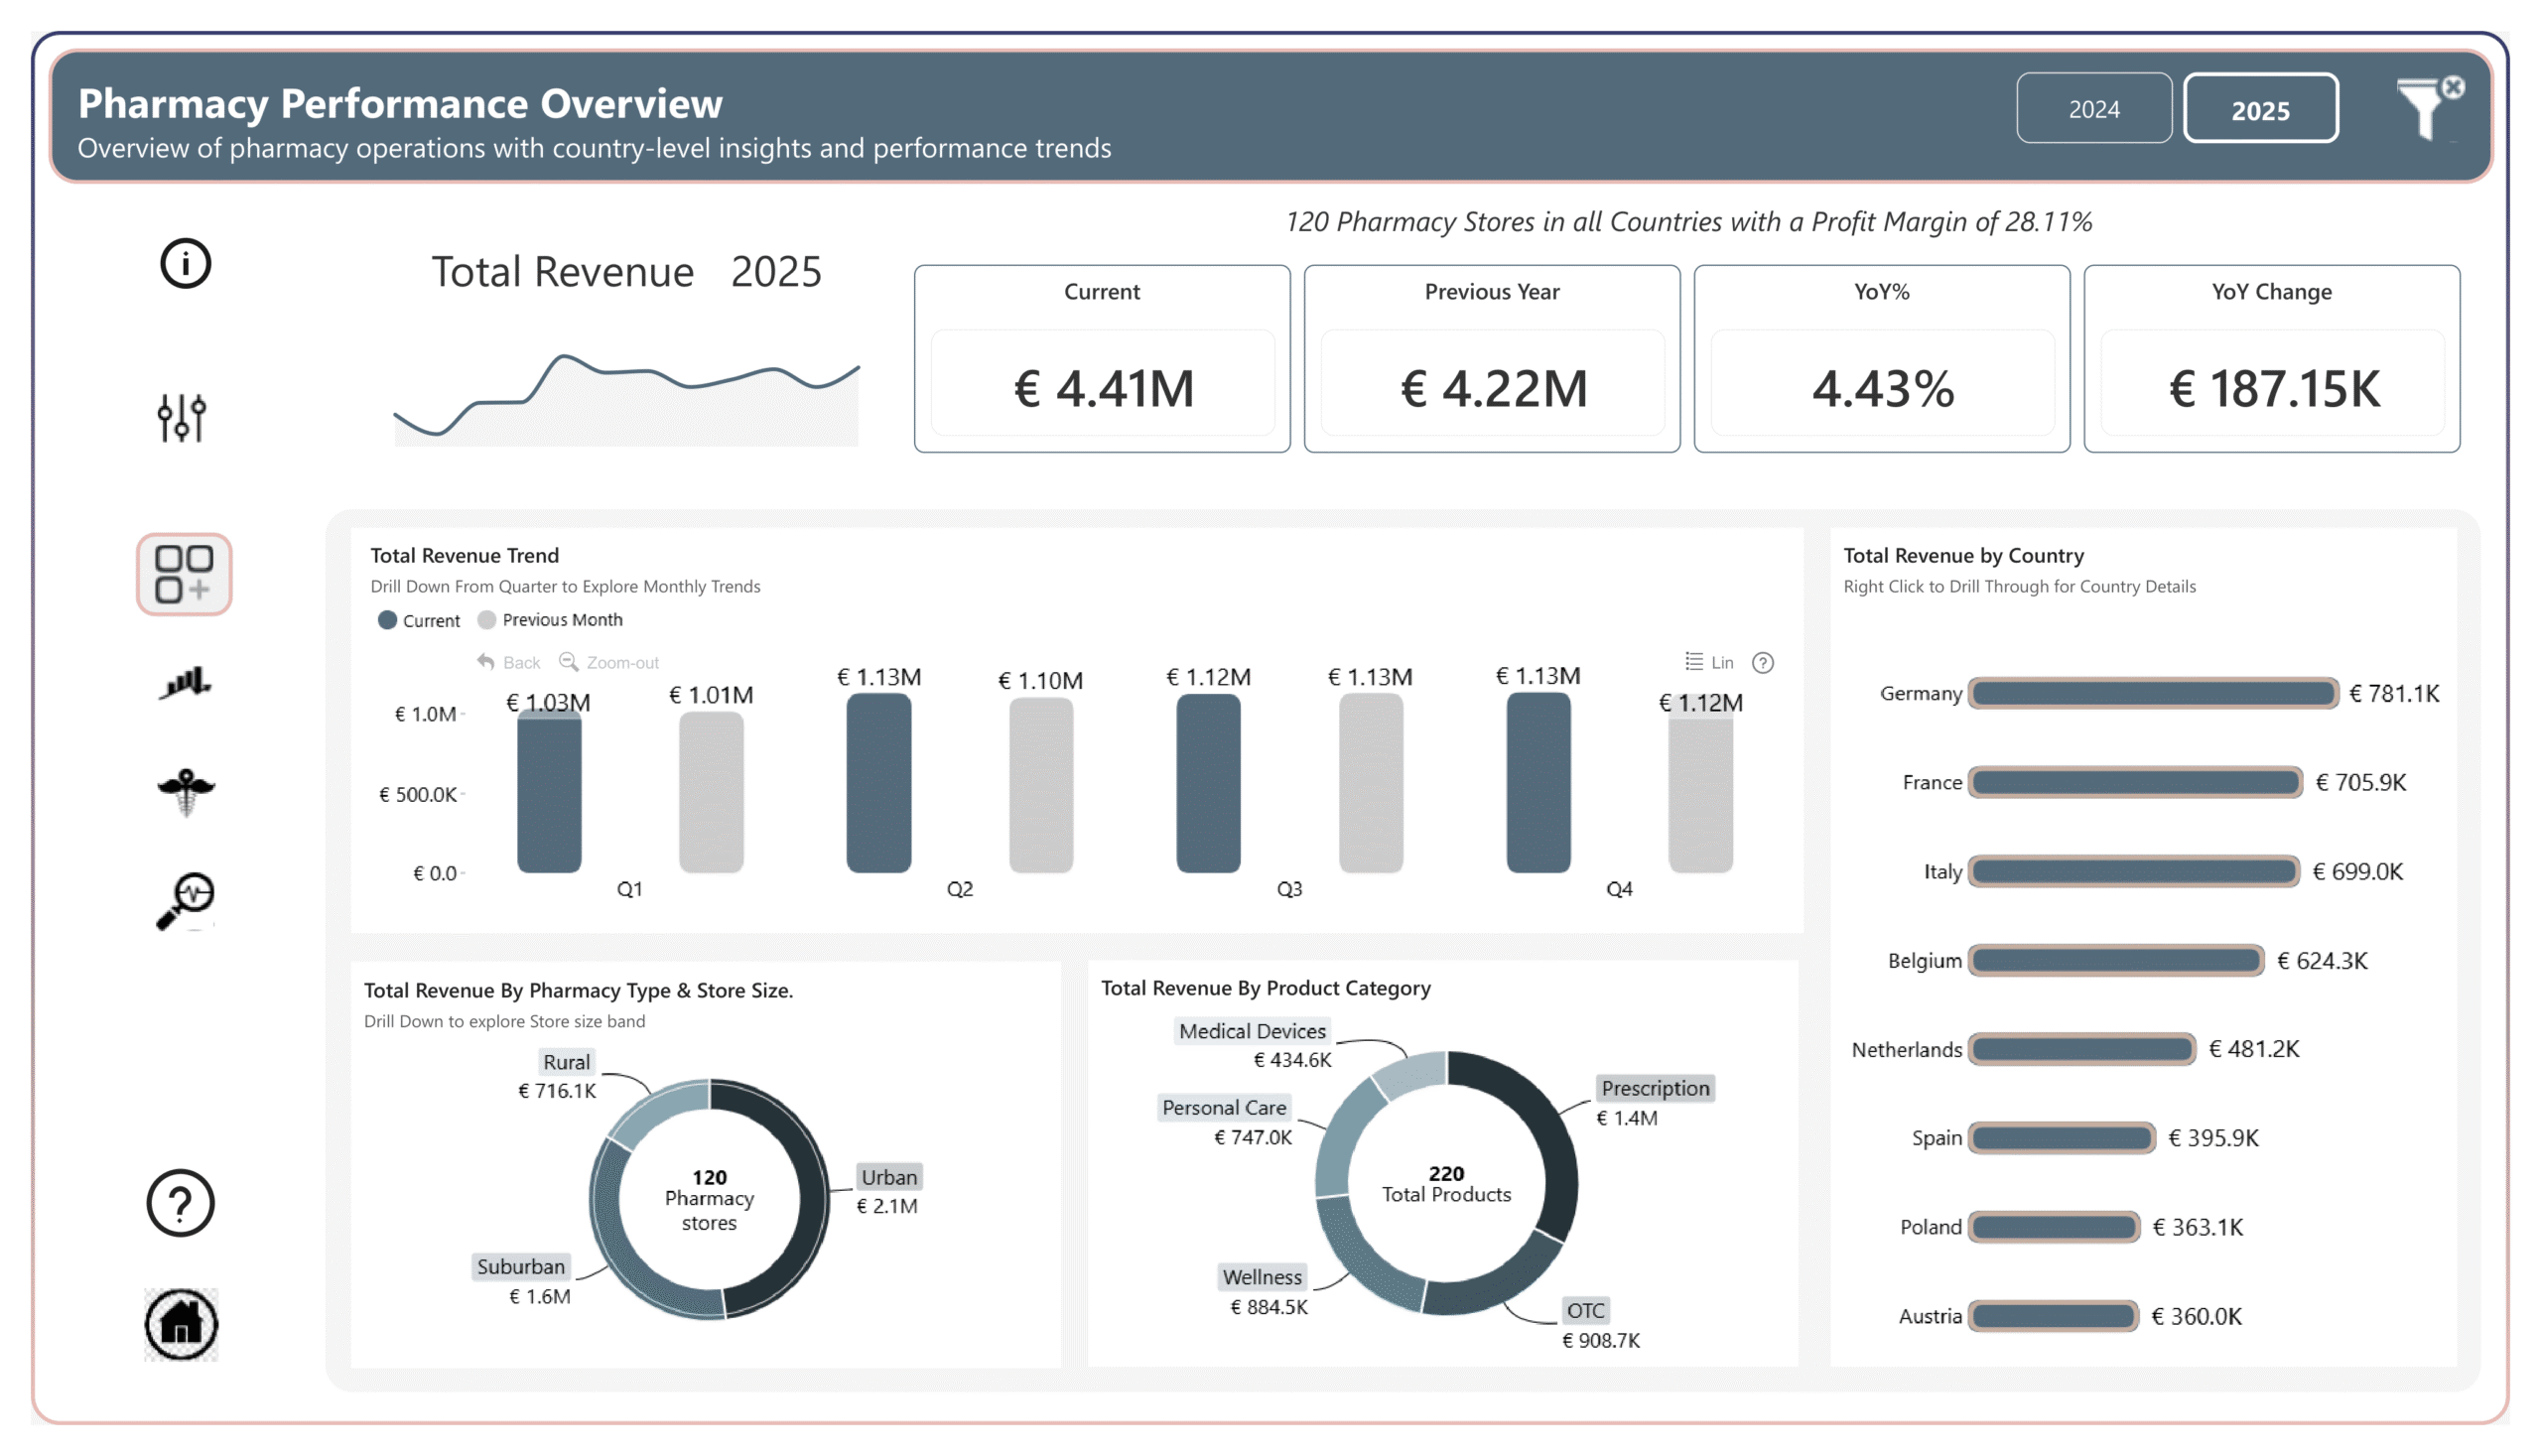
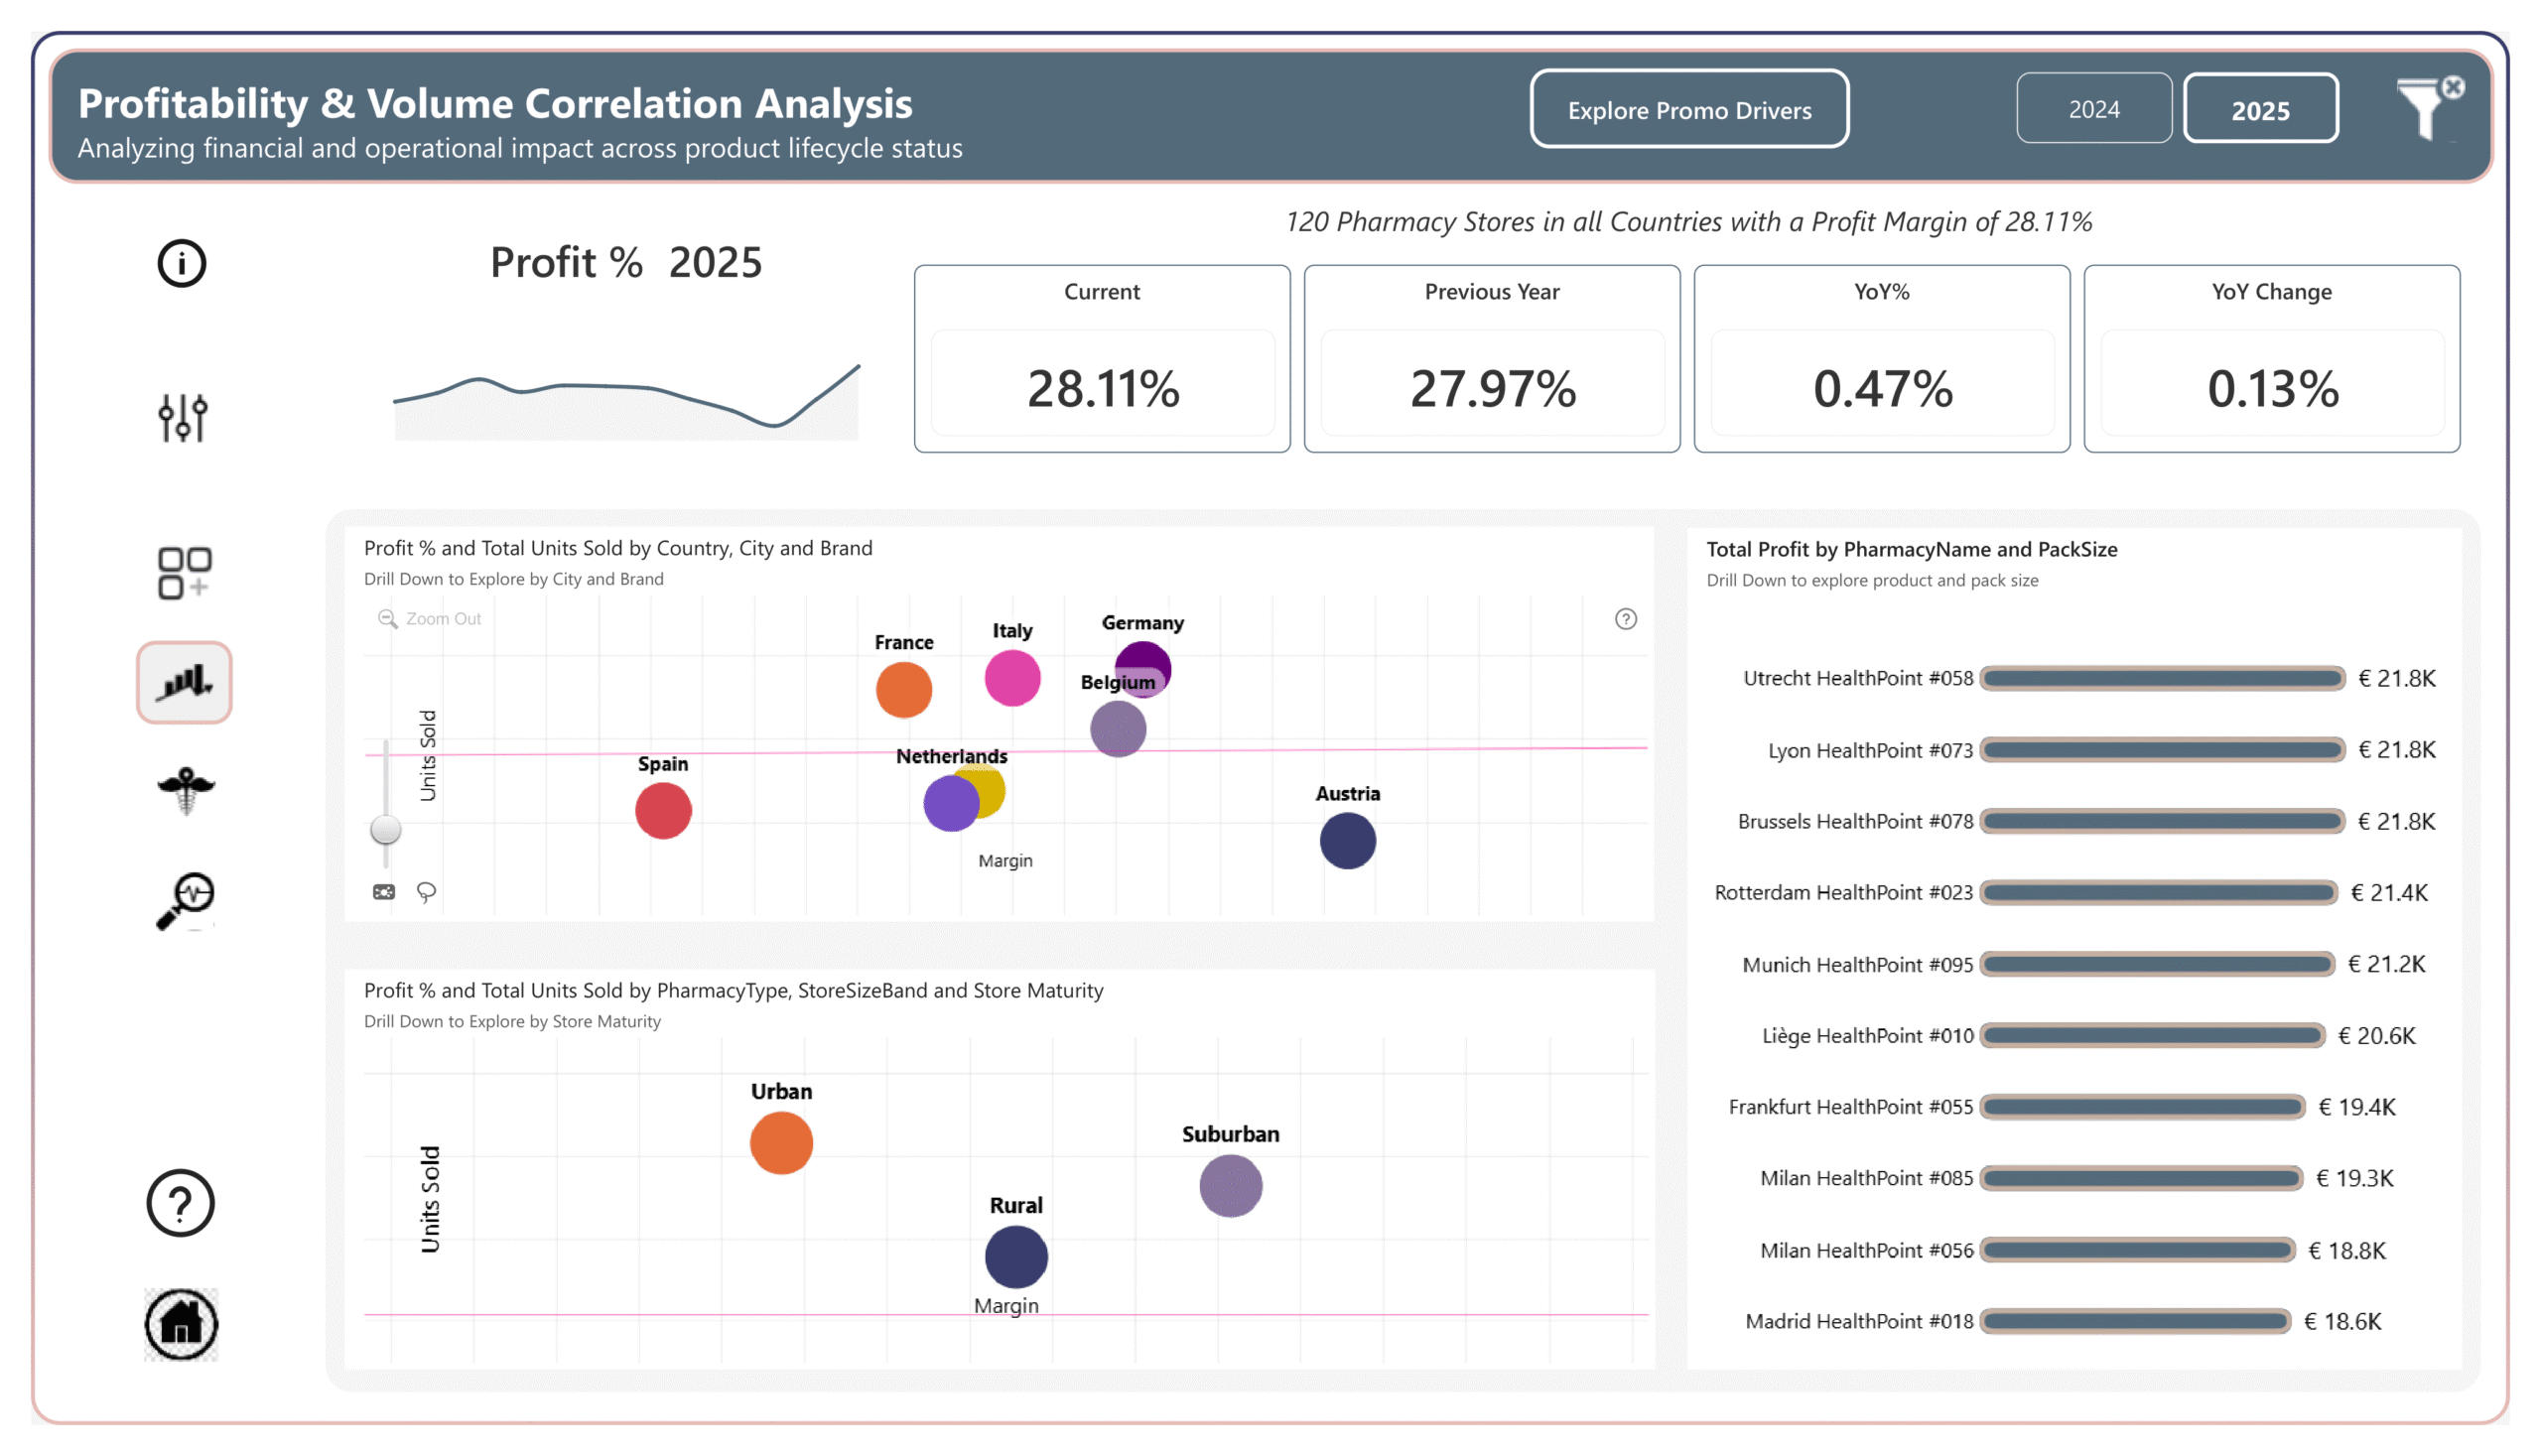
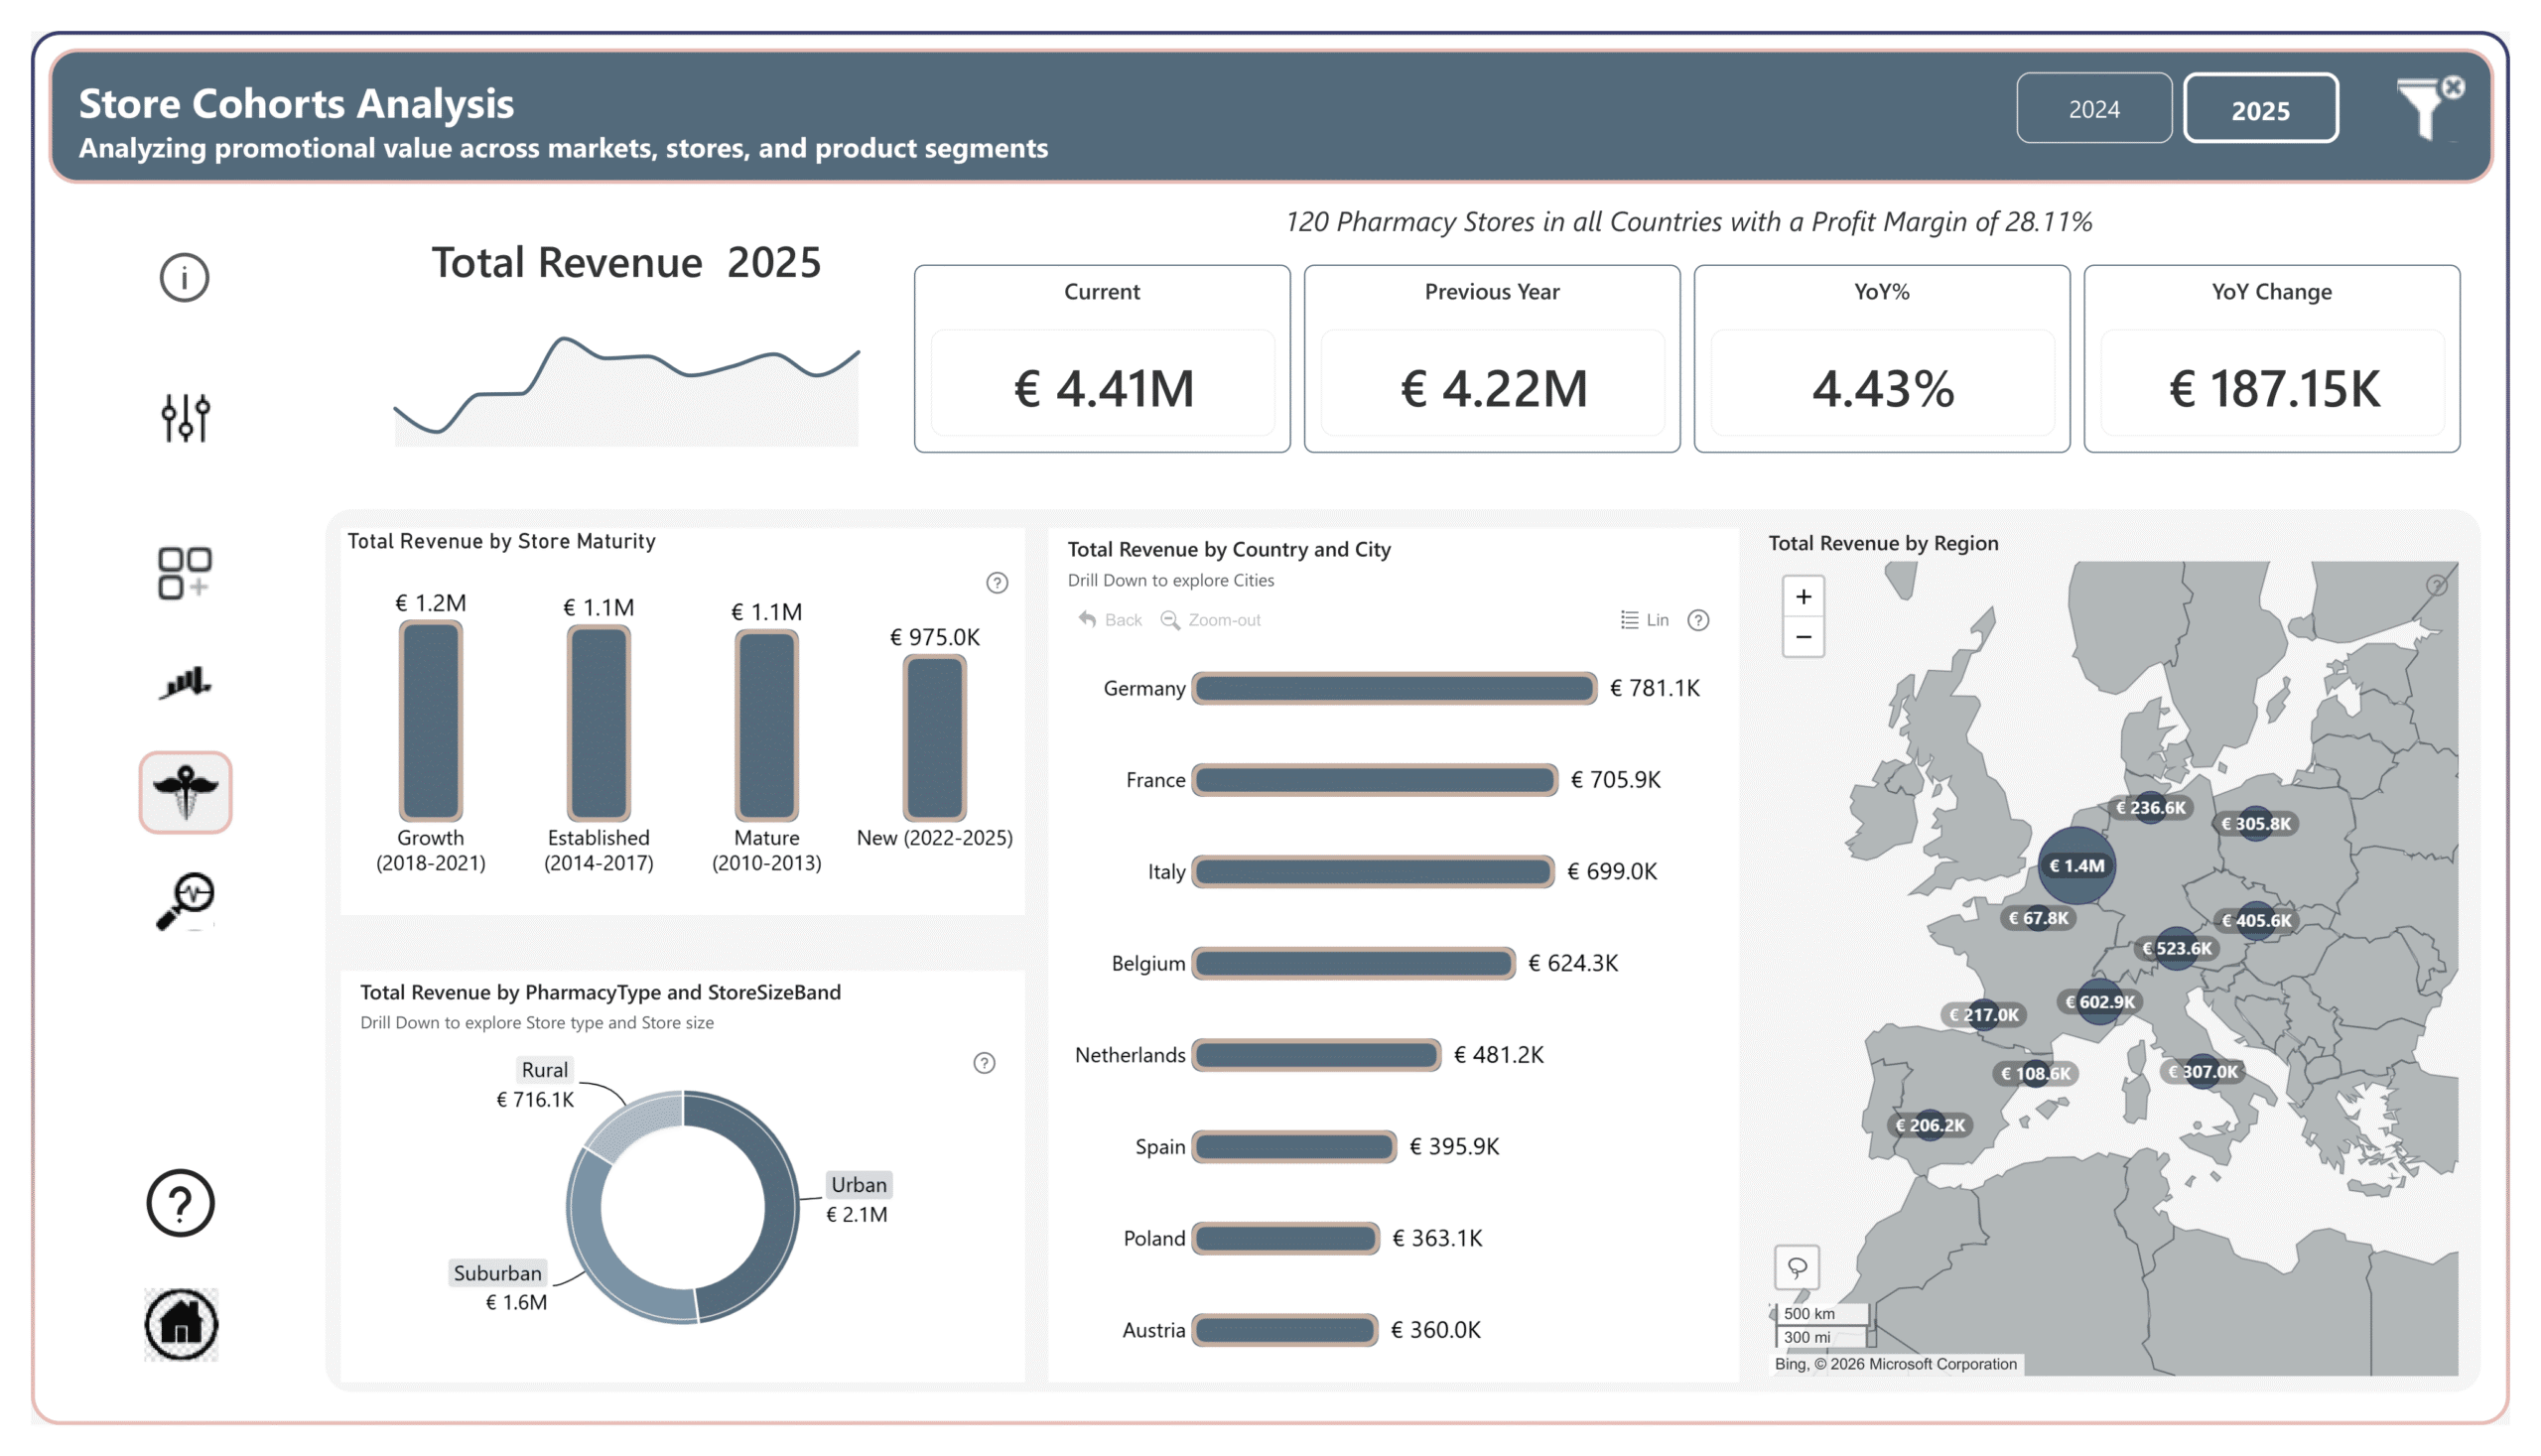
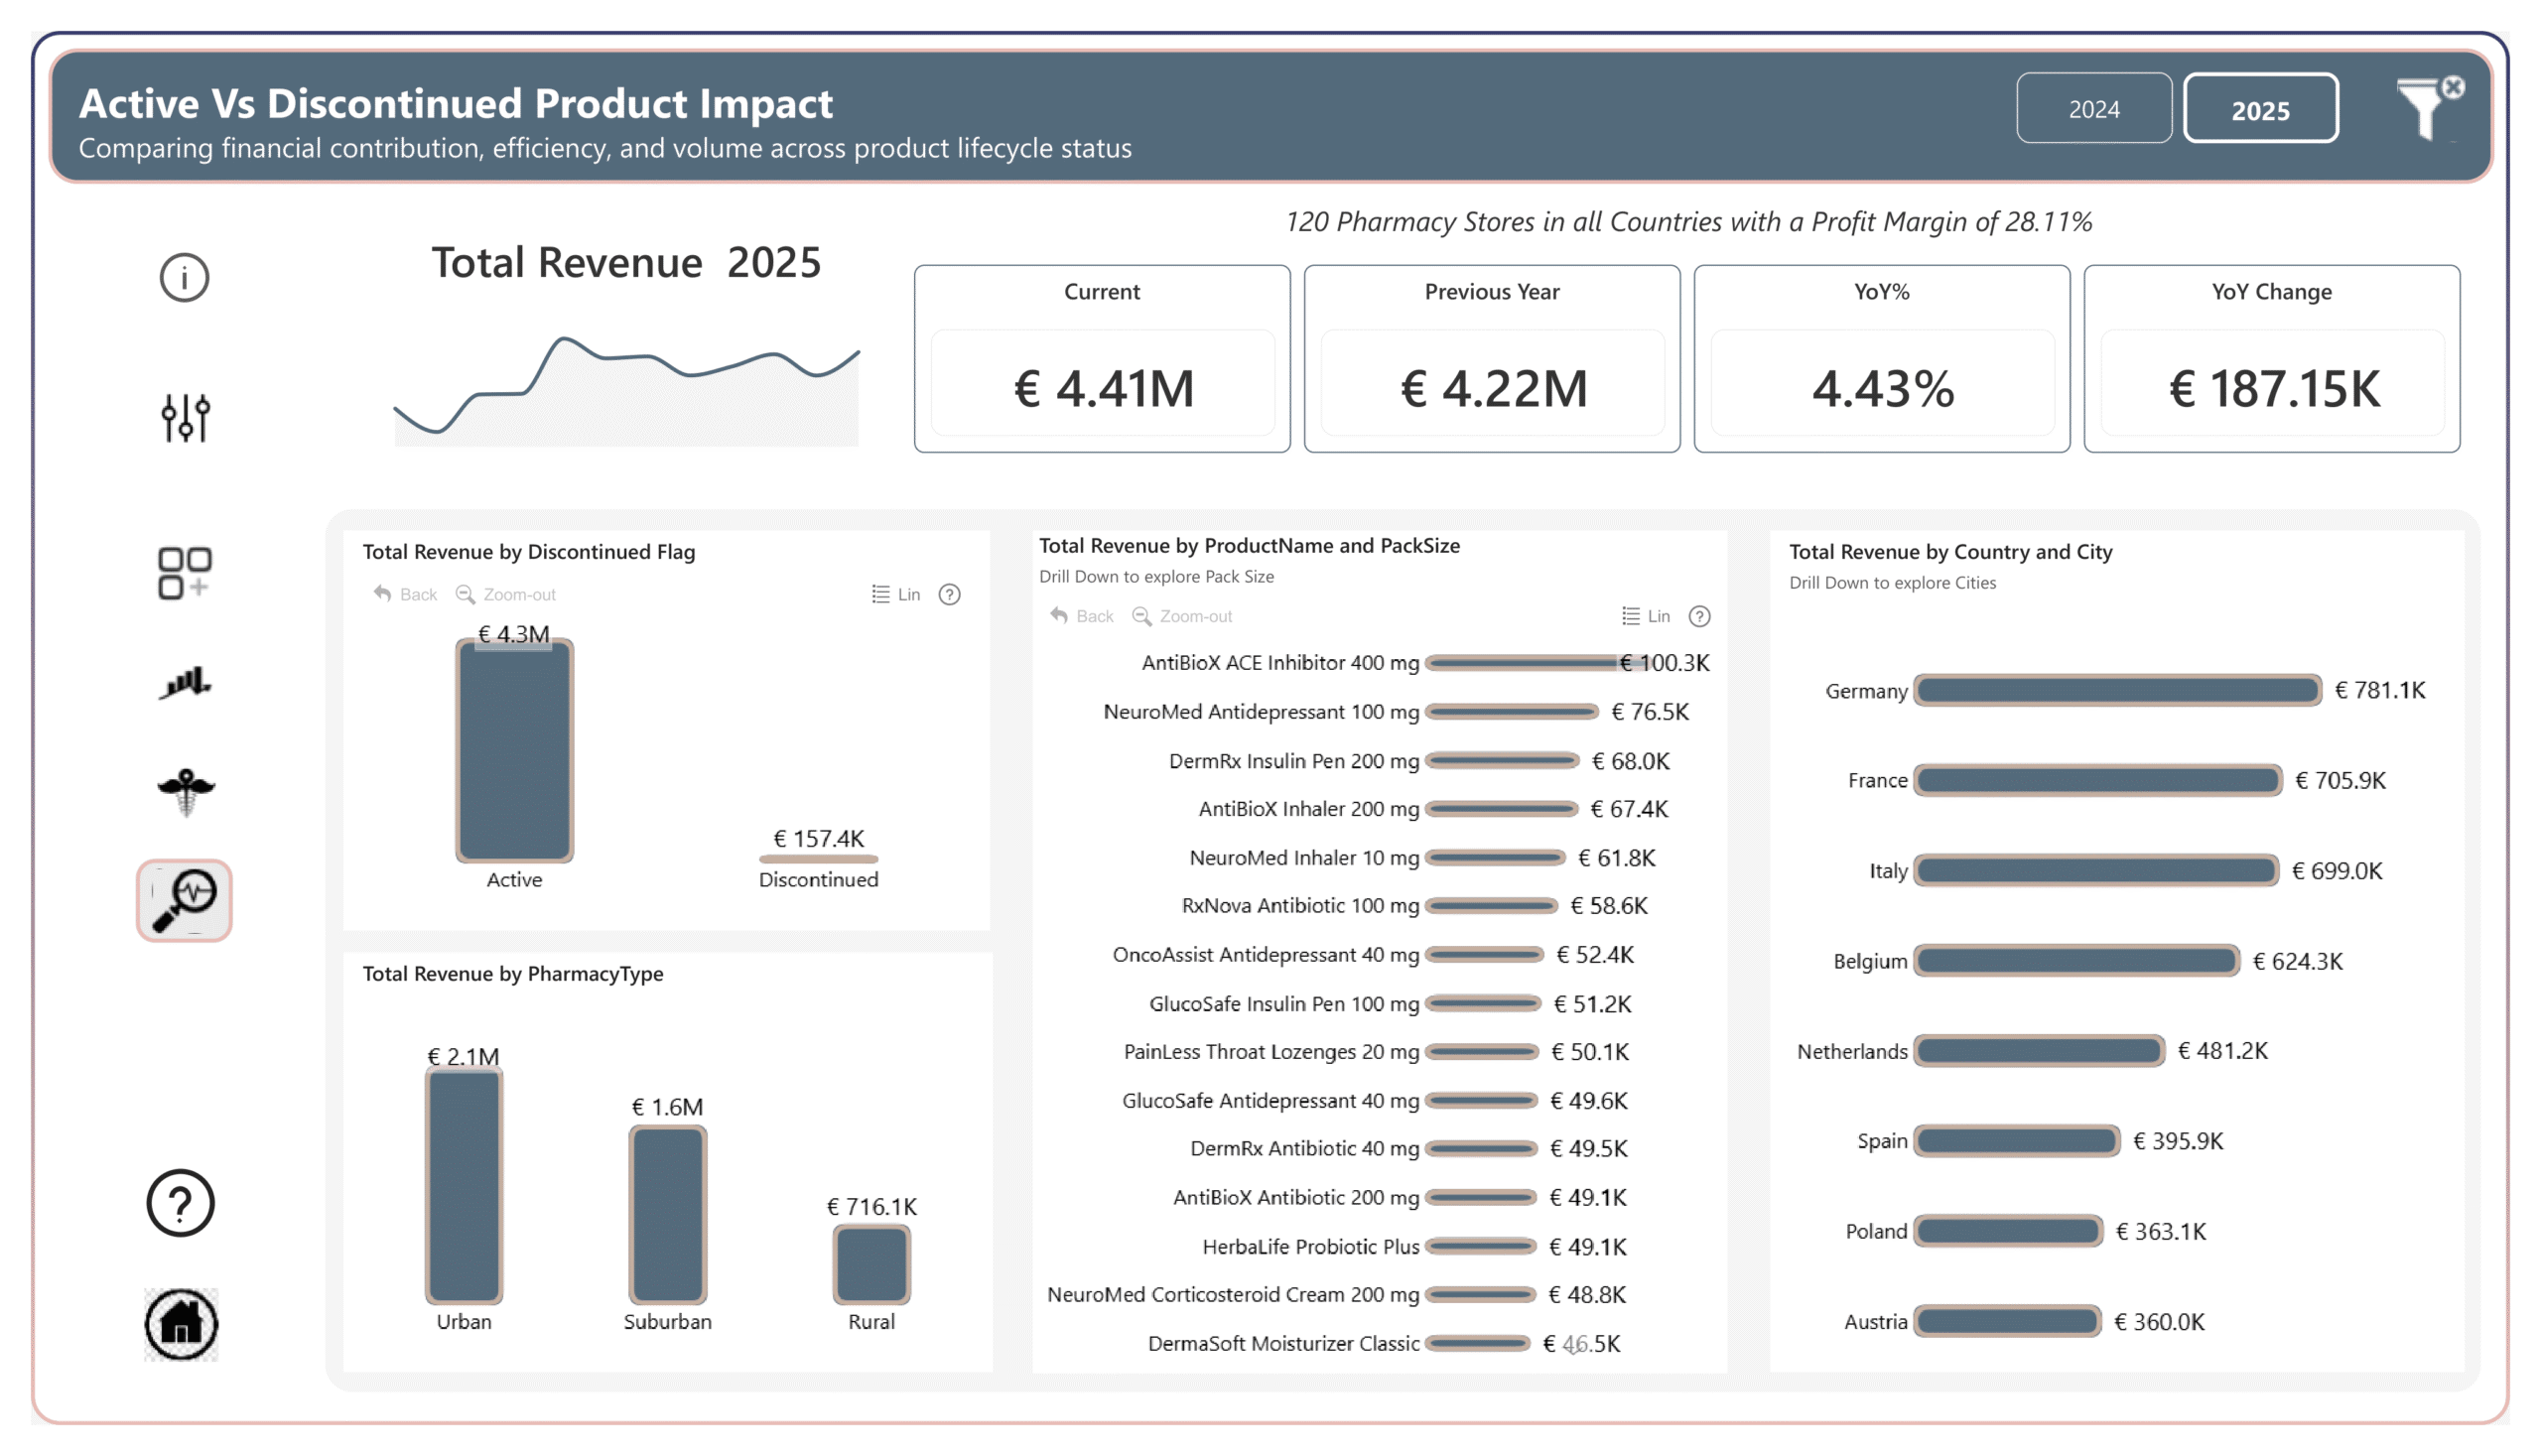
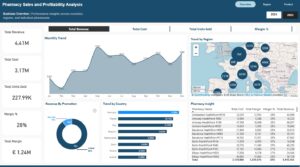
The Pharmacy Sales & Profitability Analytics Report analyzes performance across 120 pharmacy stores spanning 8 European markets, comparing 2025 to 2024. Revenue grew +4.4% (€4.41M) year-over-year, while profit margins held steady at ~28%. The analysis reveals uneven efficiency across geographies and store types. Germany, France, and Italy lead on volume, while Austria and Belgium excel in margin efficiency. Urban pharmacies drive scale (€2.1M, 48% of revenue), but rural and newer stores deliver stronger margins despite lower volumes. To uncover optimization opportunities, product velocity analysis was introduced, segmenting items into slow-moving, core movers, and fast movers across store cohorts and product lifecycle status. This multi-dimensional framework reveals that not all products or stores contribute equally to profitability. Promotions currently protect efficiency (~20% margin) but have not yet evolved into profit drivers — representing a key unlock opportunity. The report leverages calculation group items as dynamic KPI cards paired with field parameters, enabling seamless metric switching while maintaining a clean, executive-friendly interface.
Contact our team

16 Upper Woburn Place, London, Greater London, WC1H 0AF, United Kingdom


 ugo nwasuruba
 Julie Ann C
 Benedicta Otakpor
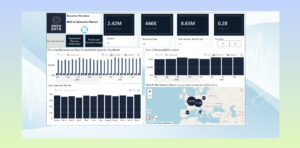
 Fiza Syed
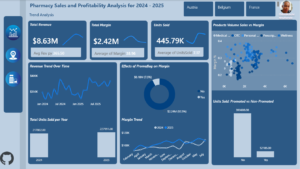

 Chinemelum Nwaeze