Join a community of the most creative Business Intelligence Professionals
Join a community of the most creative Business Intelligence Professionals
View the DataDNA Data Visualisation portfolios below
Browse AI-reviewed portfolios from our global community of data professionals
Governments, policymakers, and employers face growing uncertainty as AI adoption accelerates across industries and labour markets, and this dataset highlights...
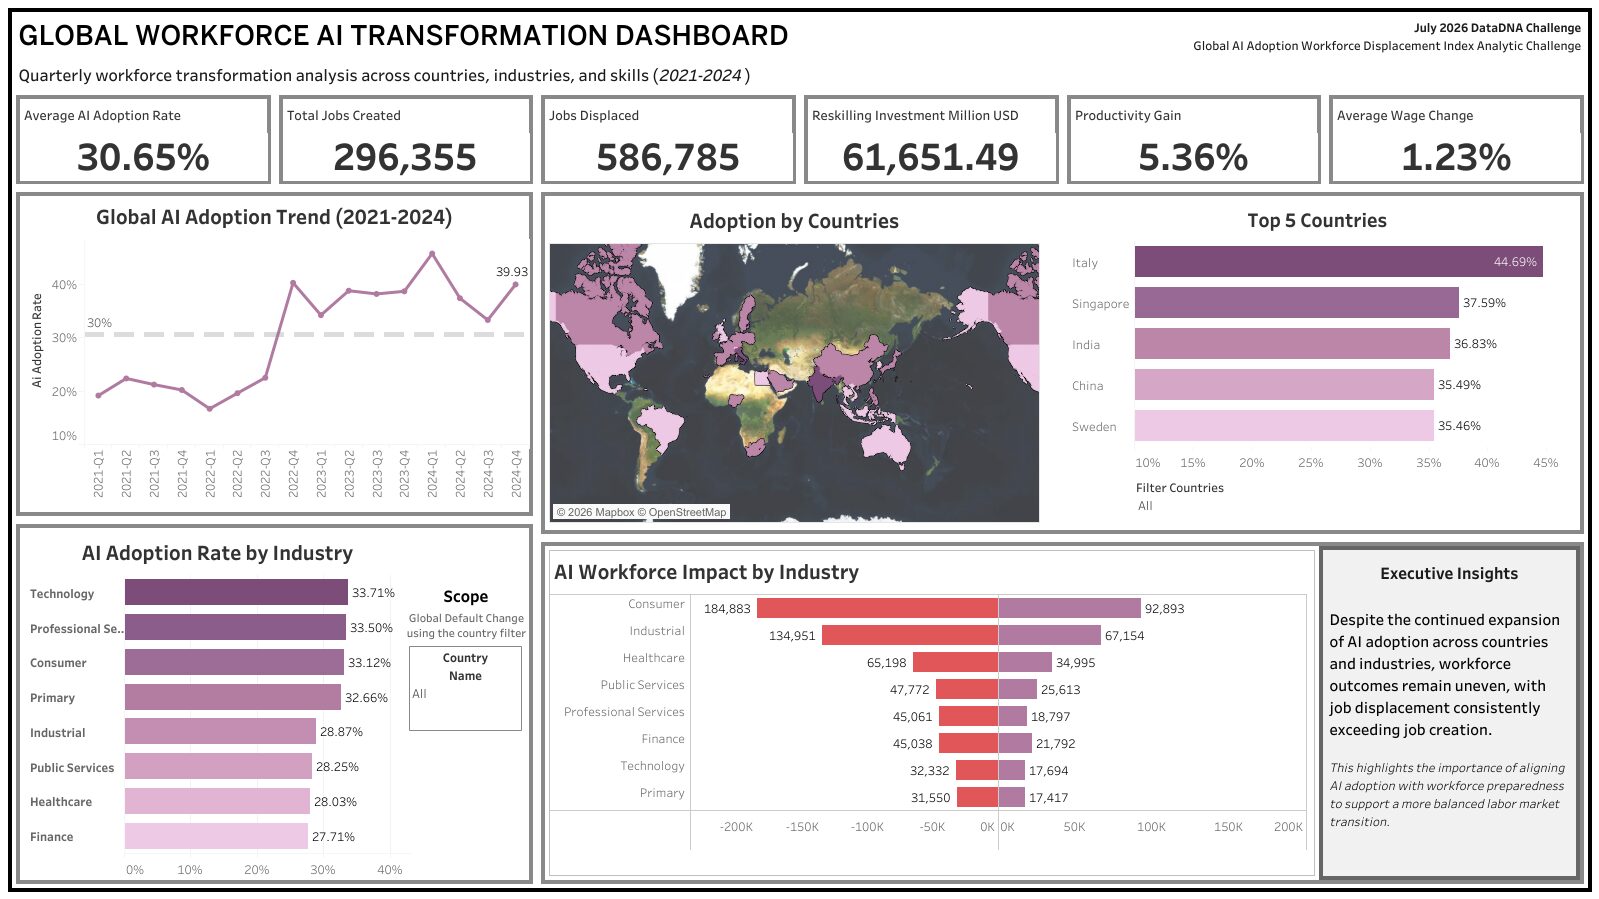
Global Workforce AI Transformation Dashboard Quarterly Workforce Transformation Analysis (2021–2024) This interactive dashboard analyzes the impact of AI transformation on...
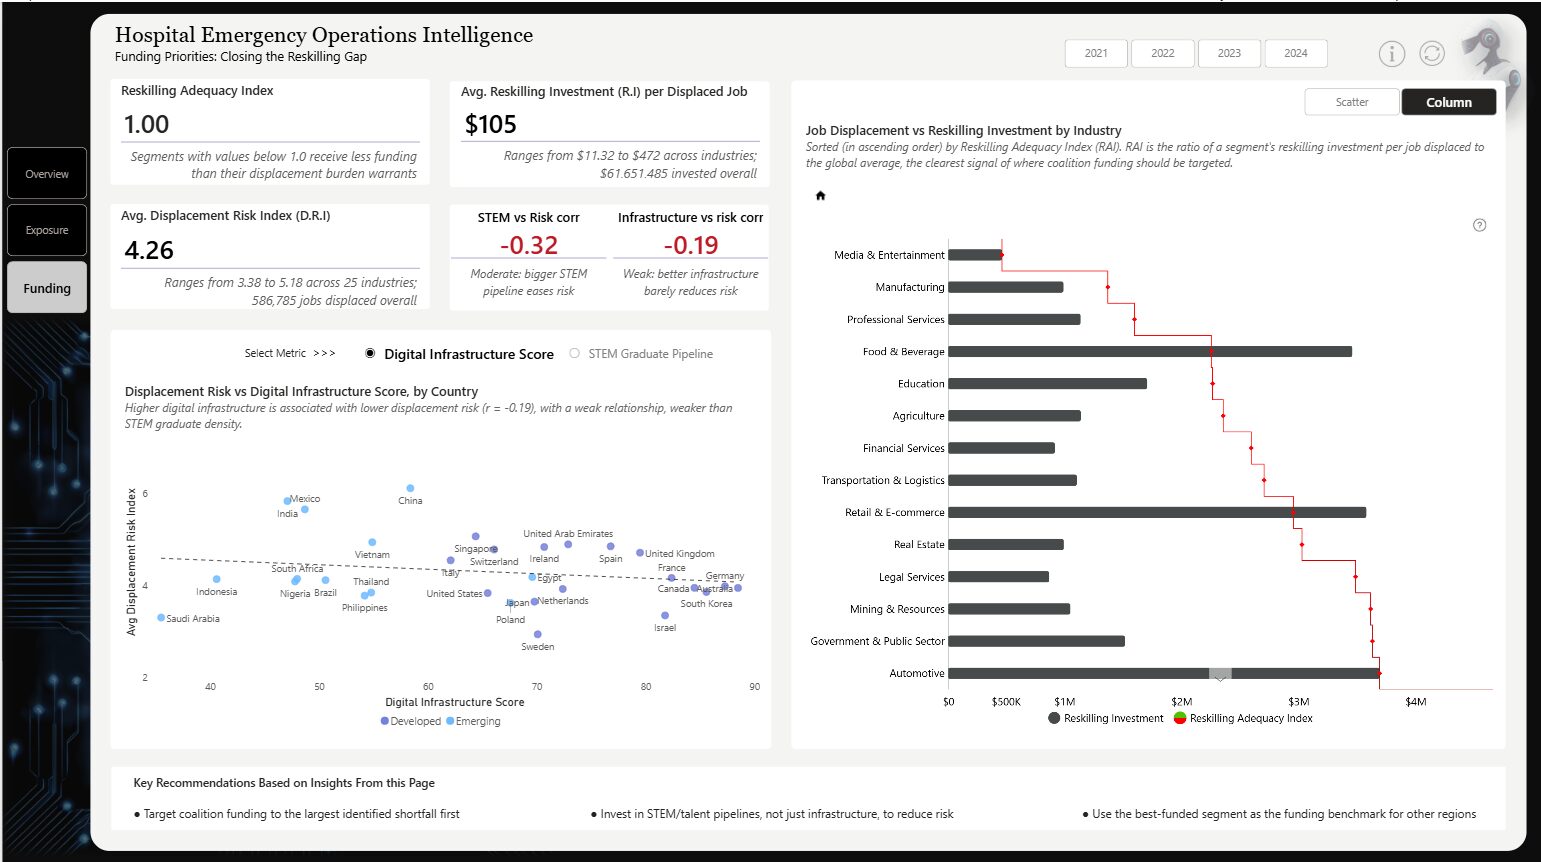
Approach: Started with SQL-first analysis — answered 11 guiding questions and synthesized 4 core objectives in SQLite before touching any...
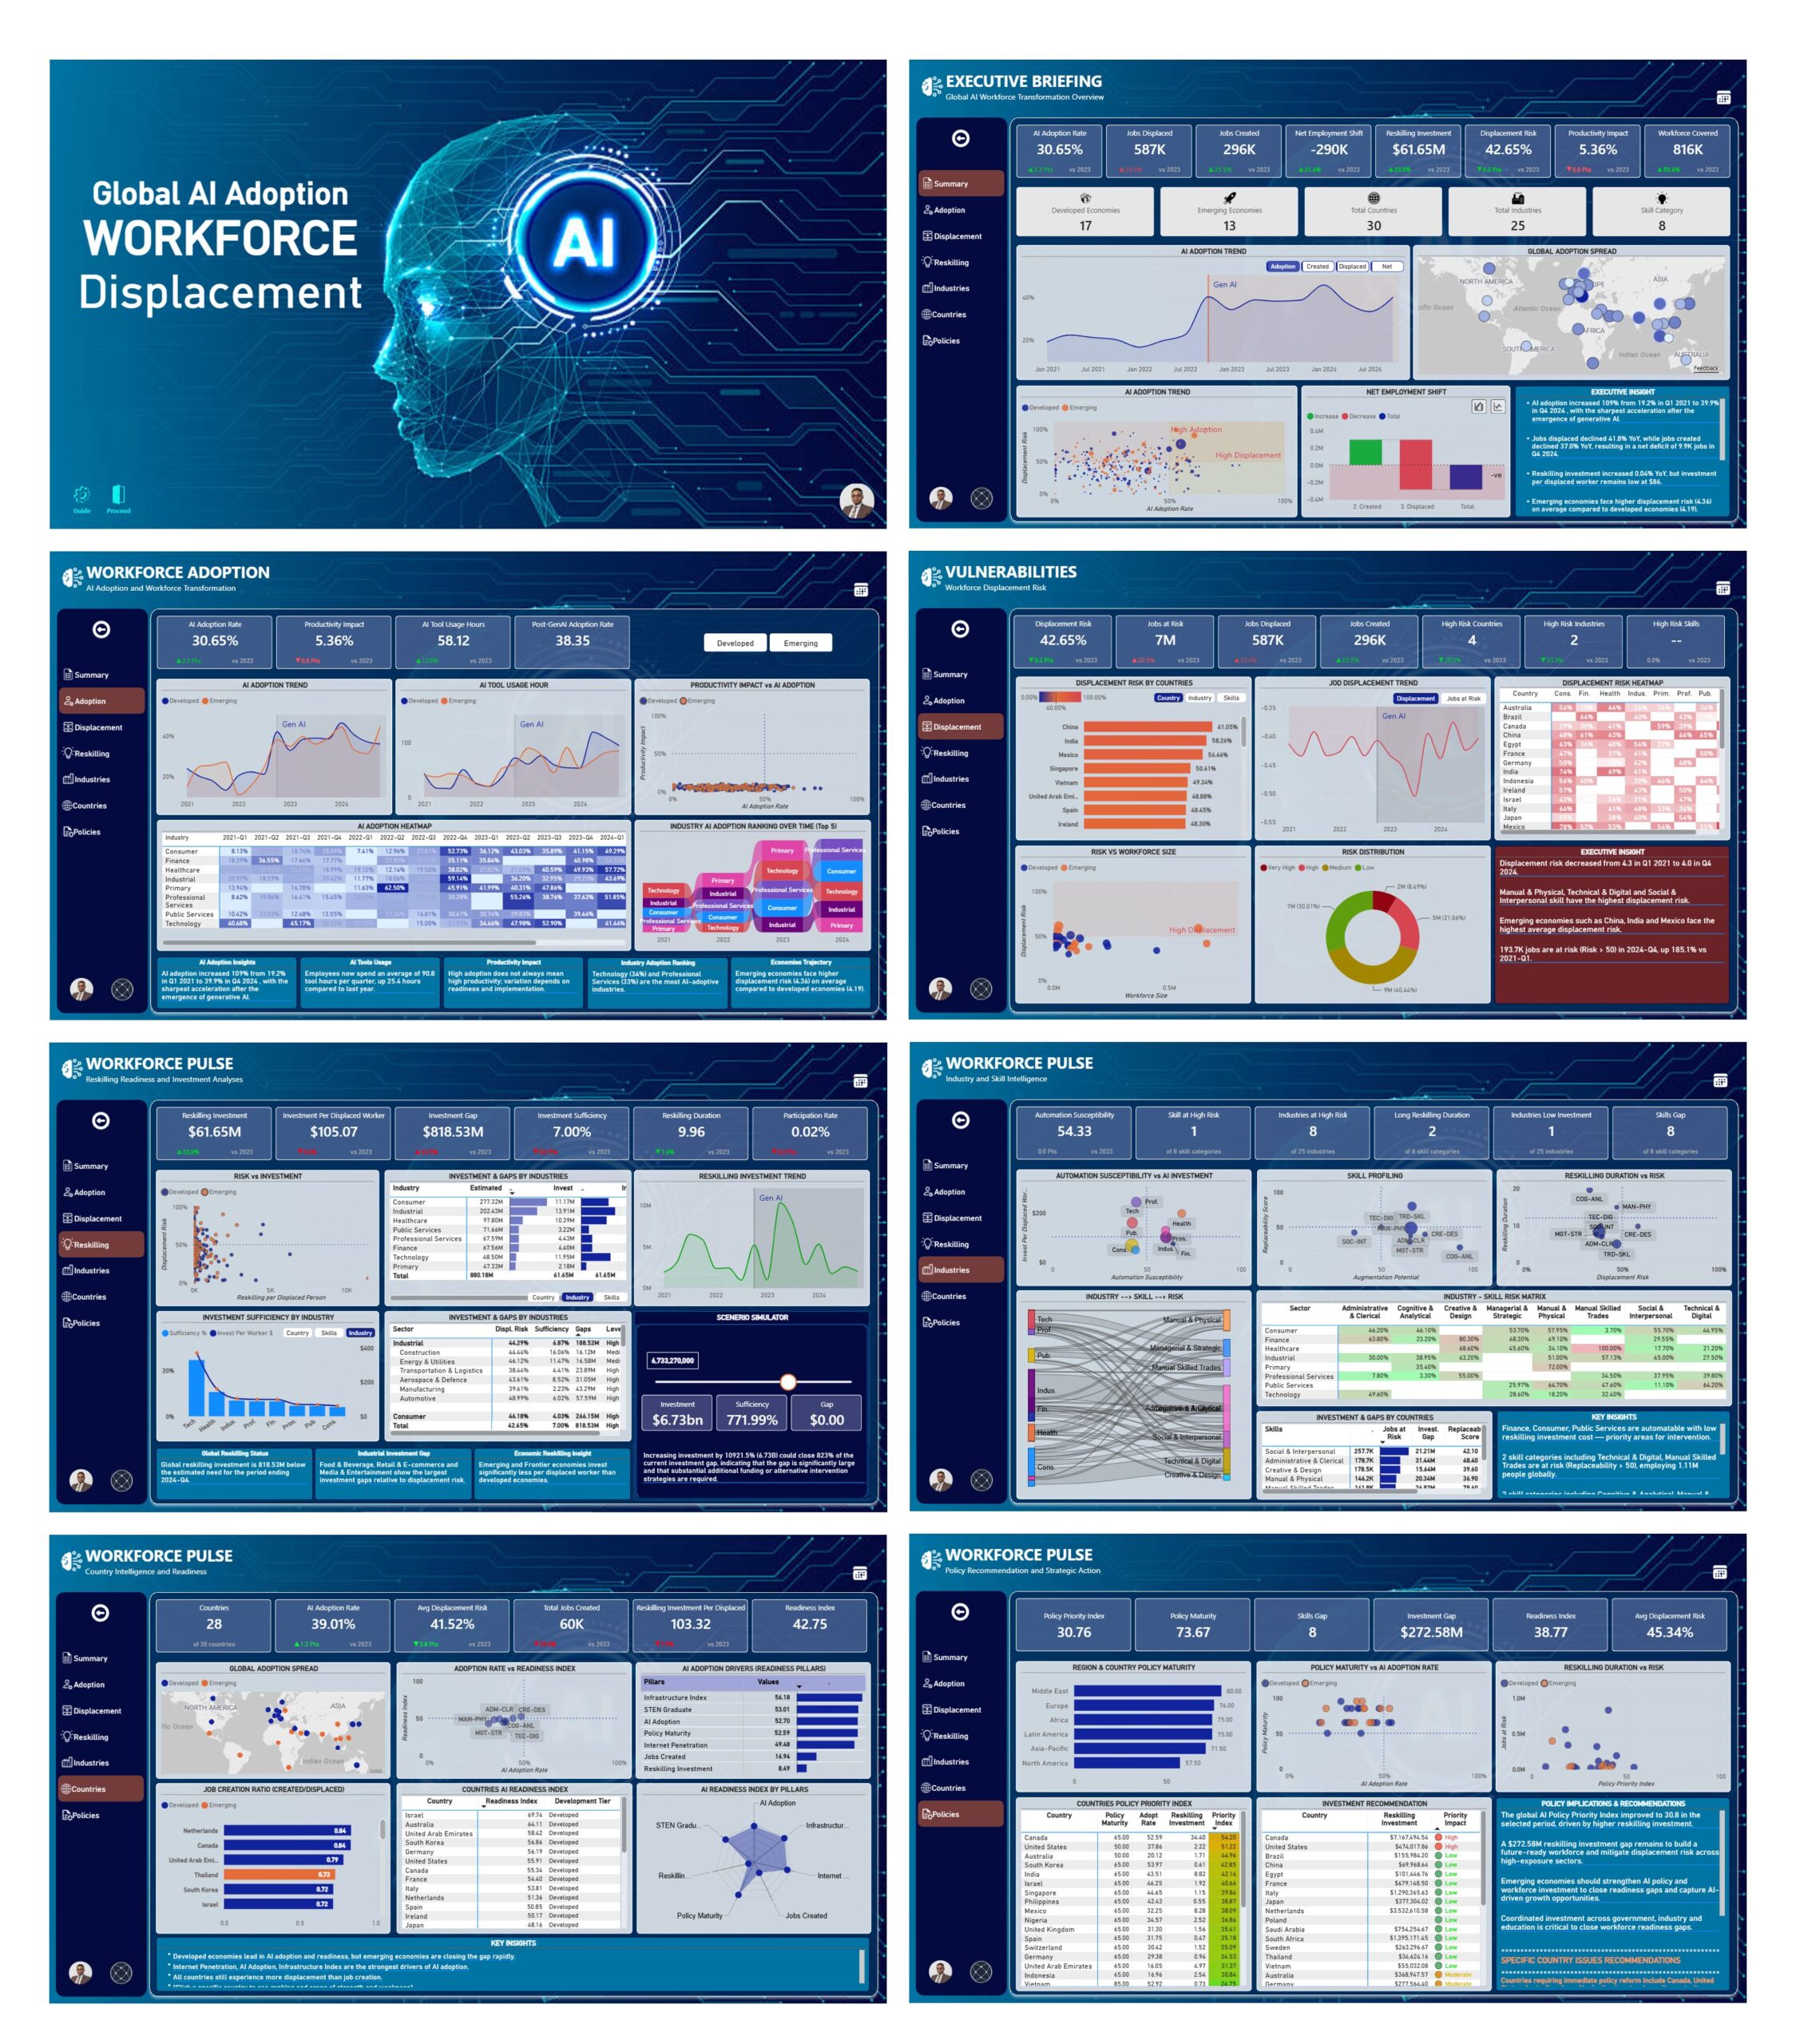
An executive Power BI dashboard that examines how AI adoption is transforming the global workforce. Using custom executive indices—including Workforce...
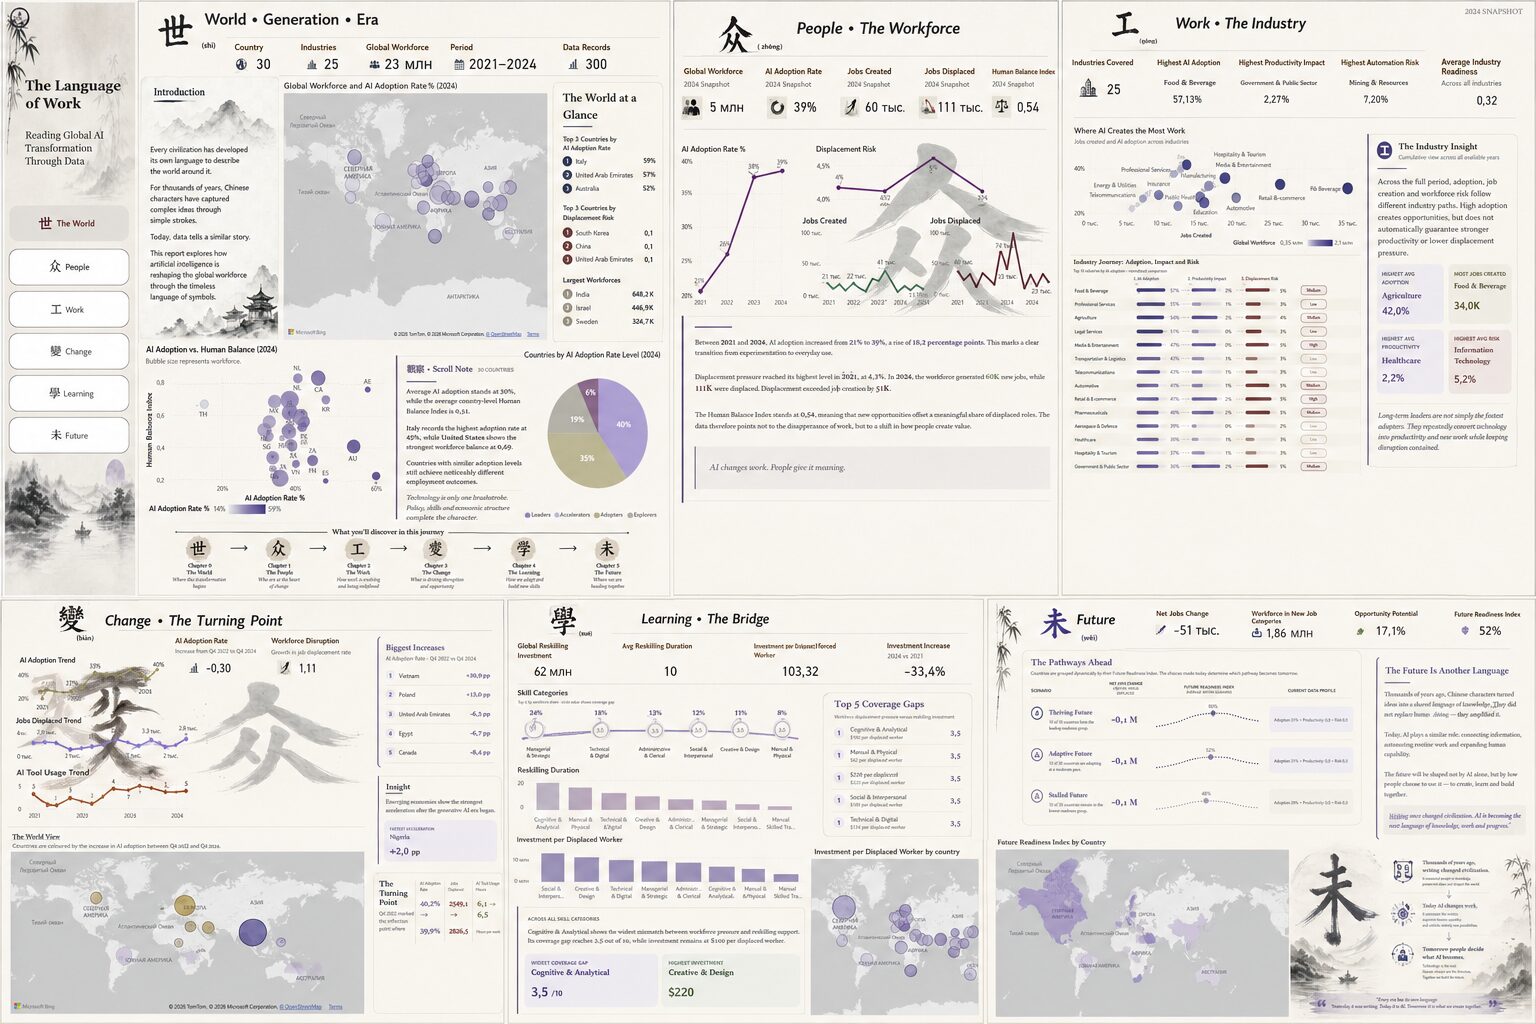
The Language of Work explores how artificial intelligence is transforming the global workforce through the visual language of ancient Chinese...
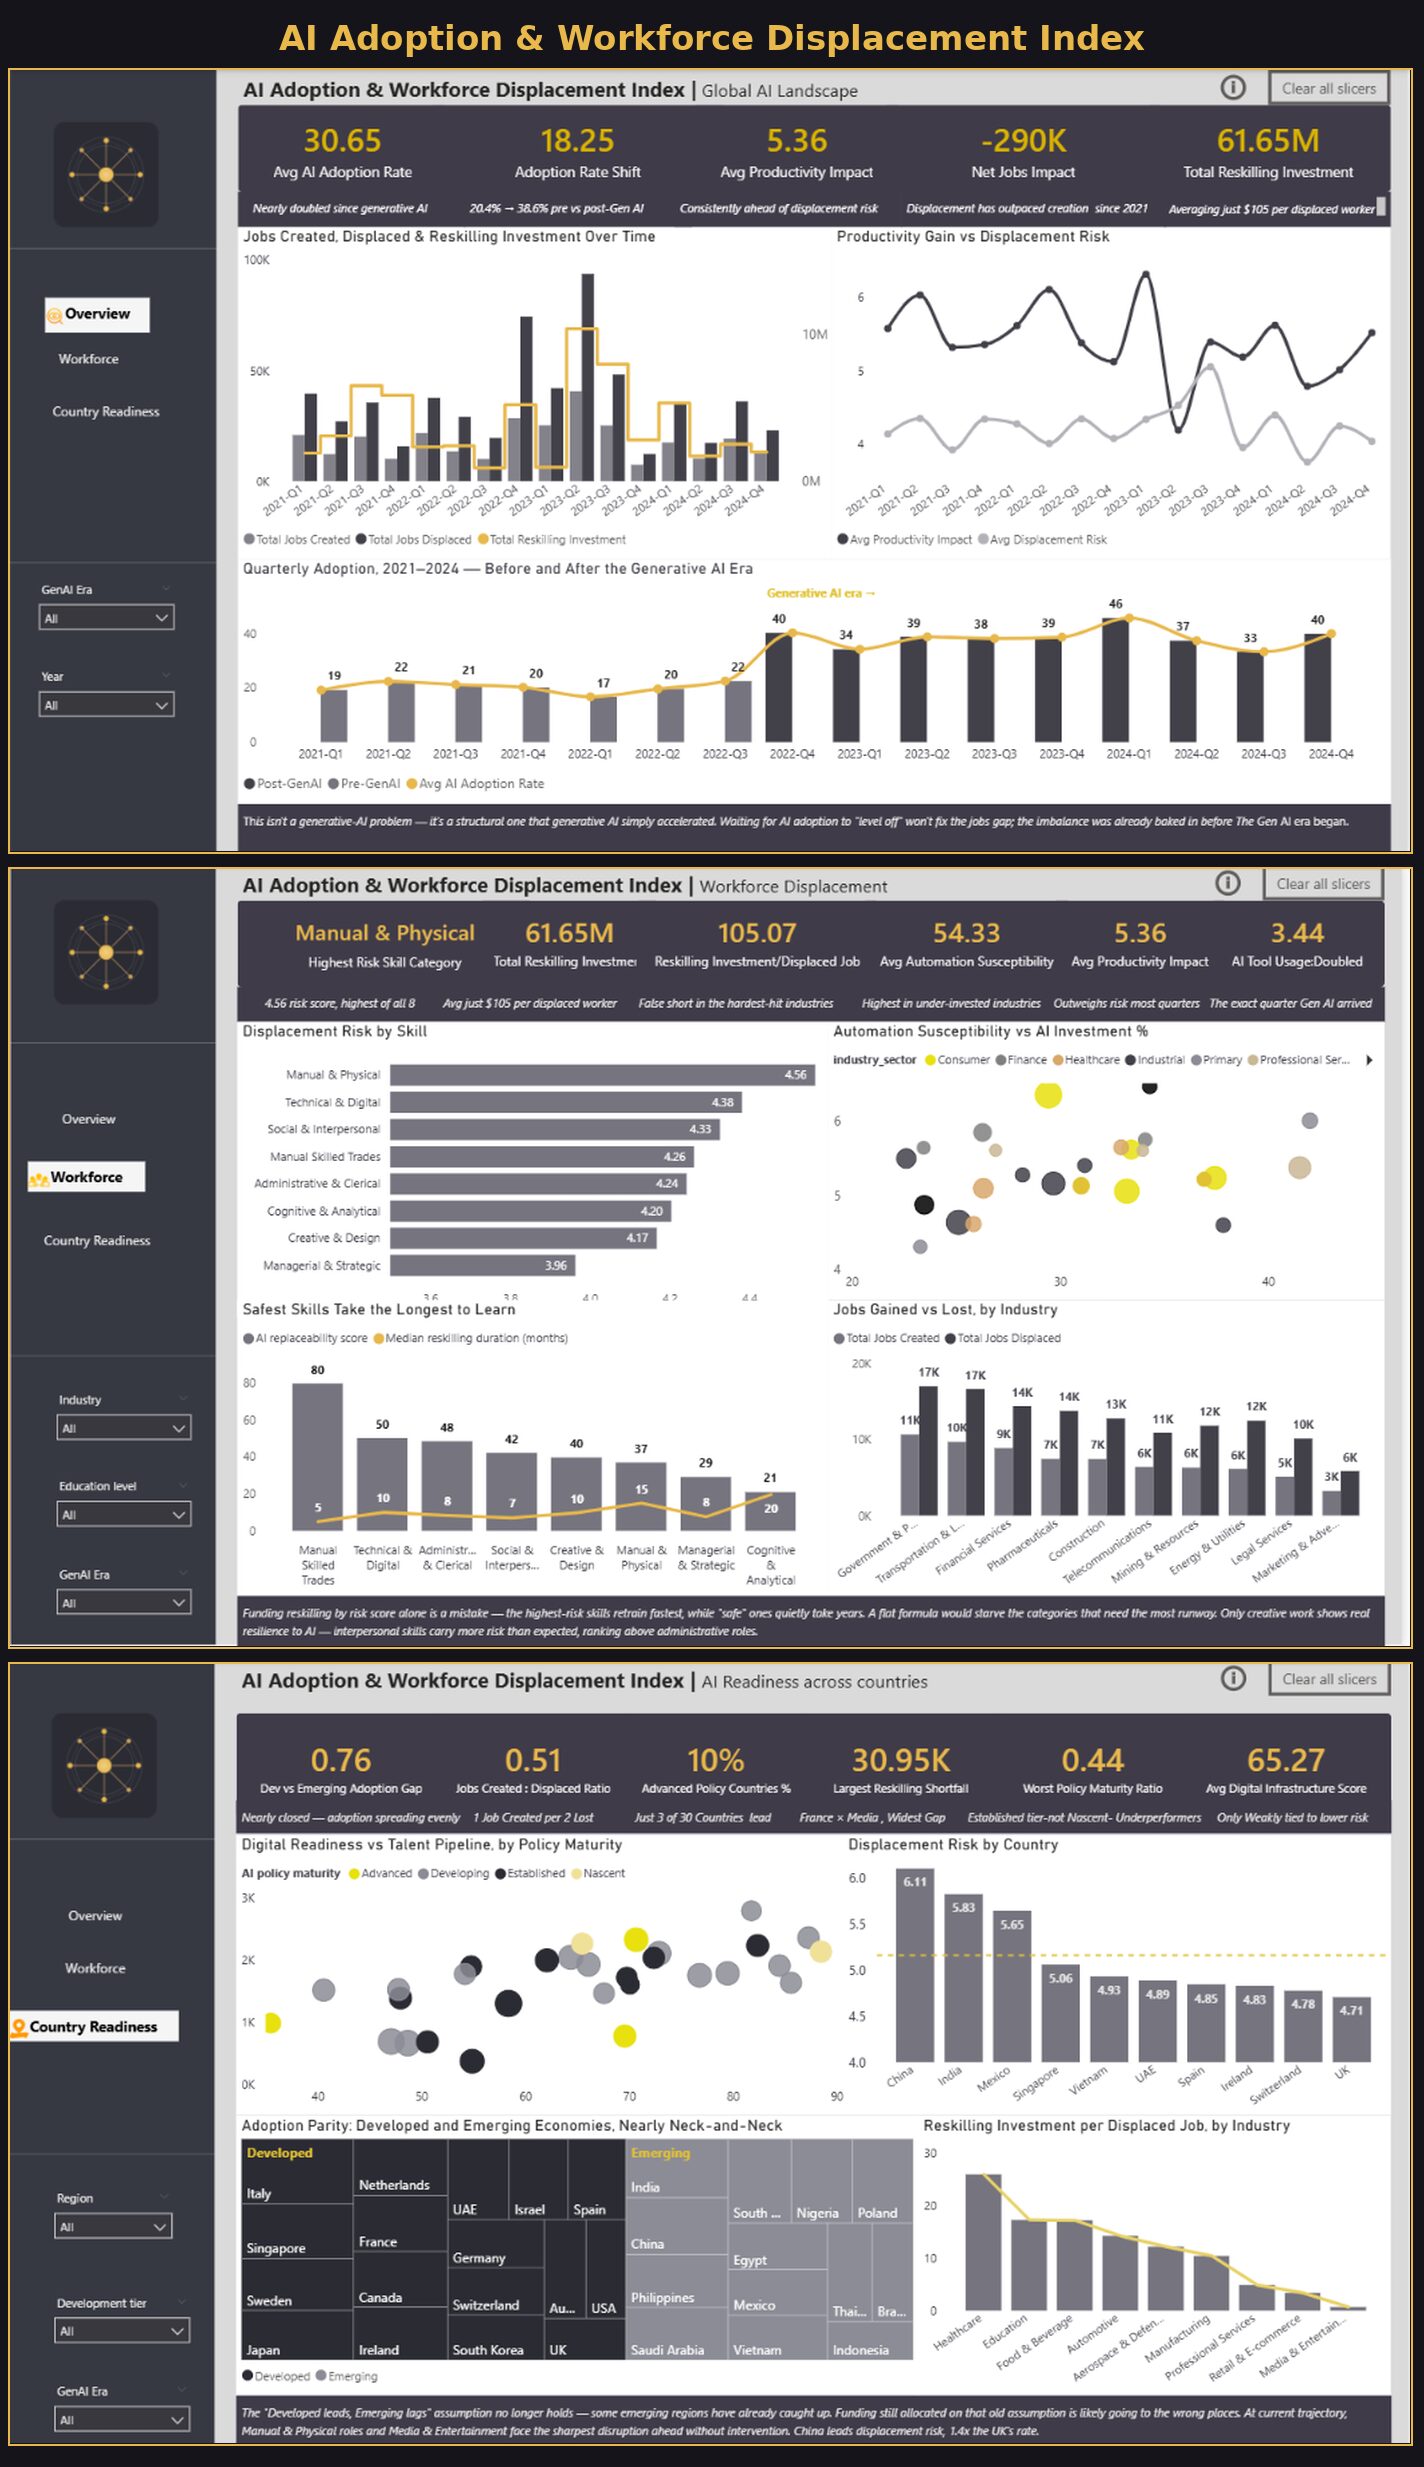
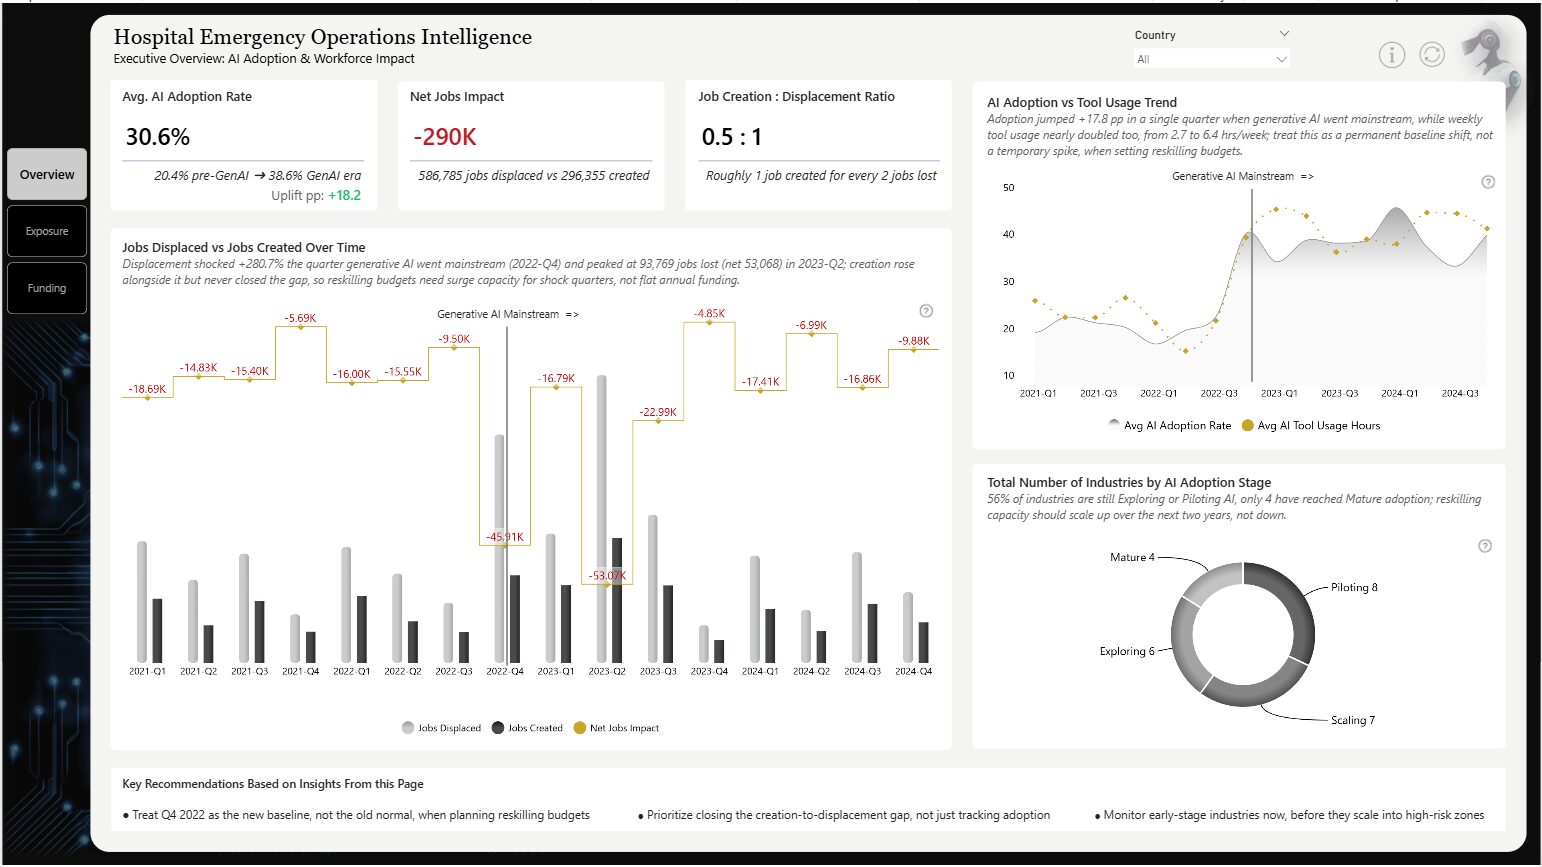
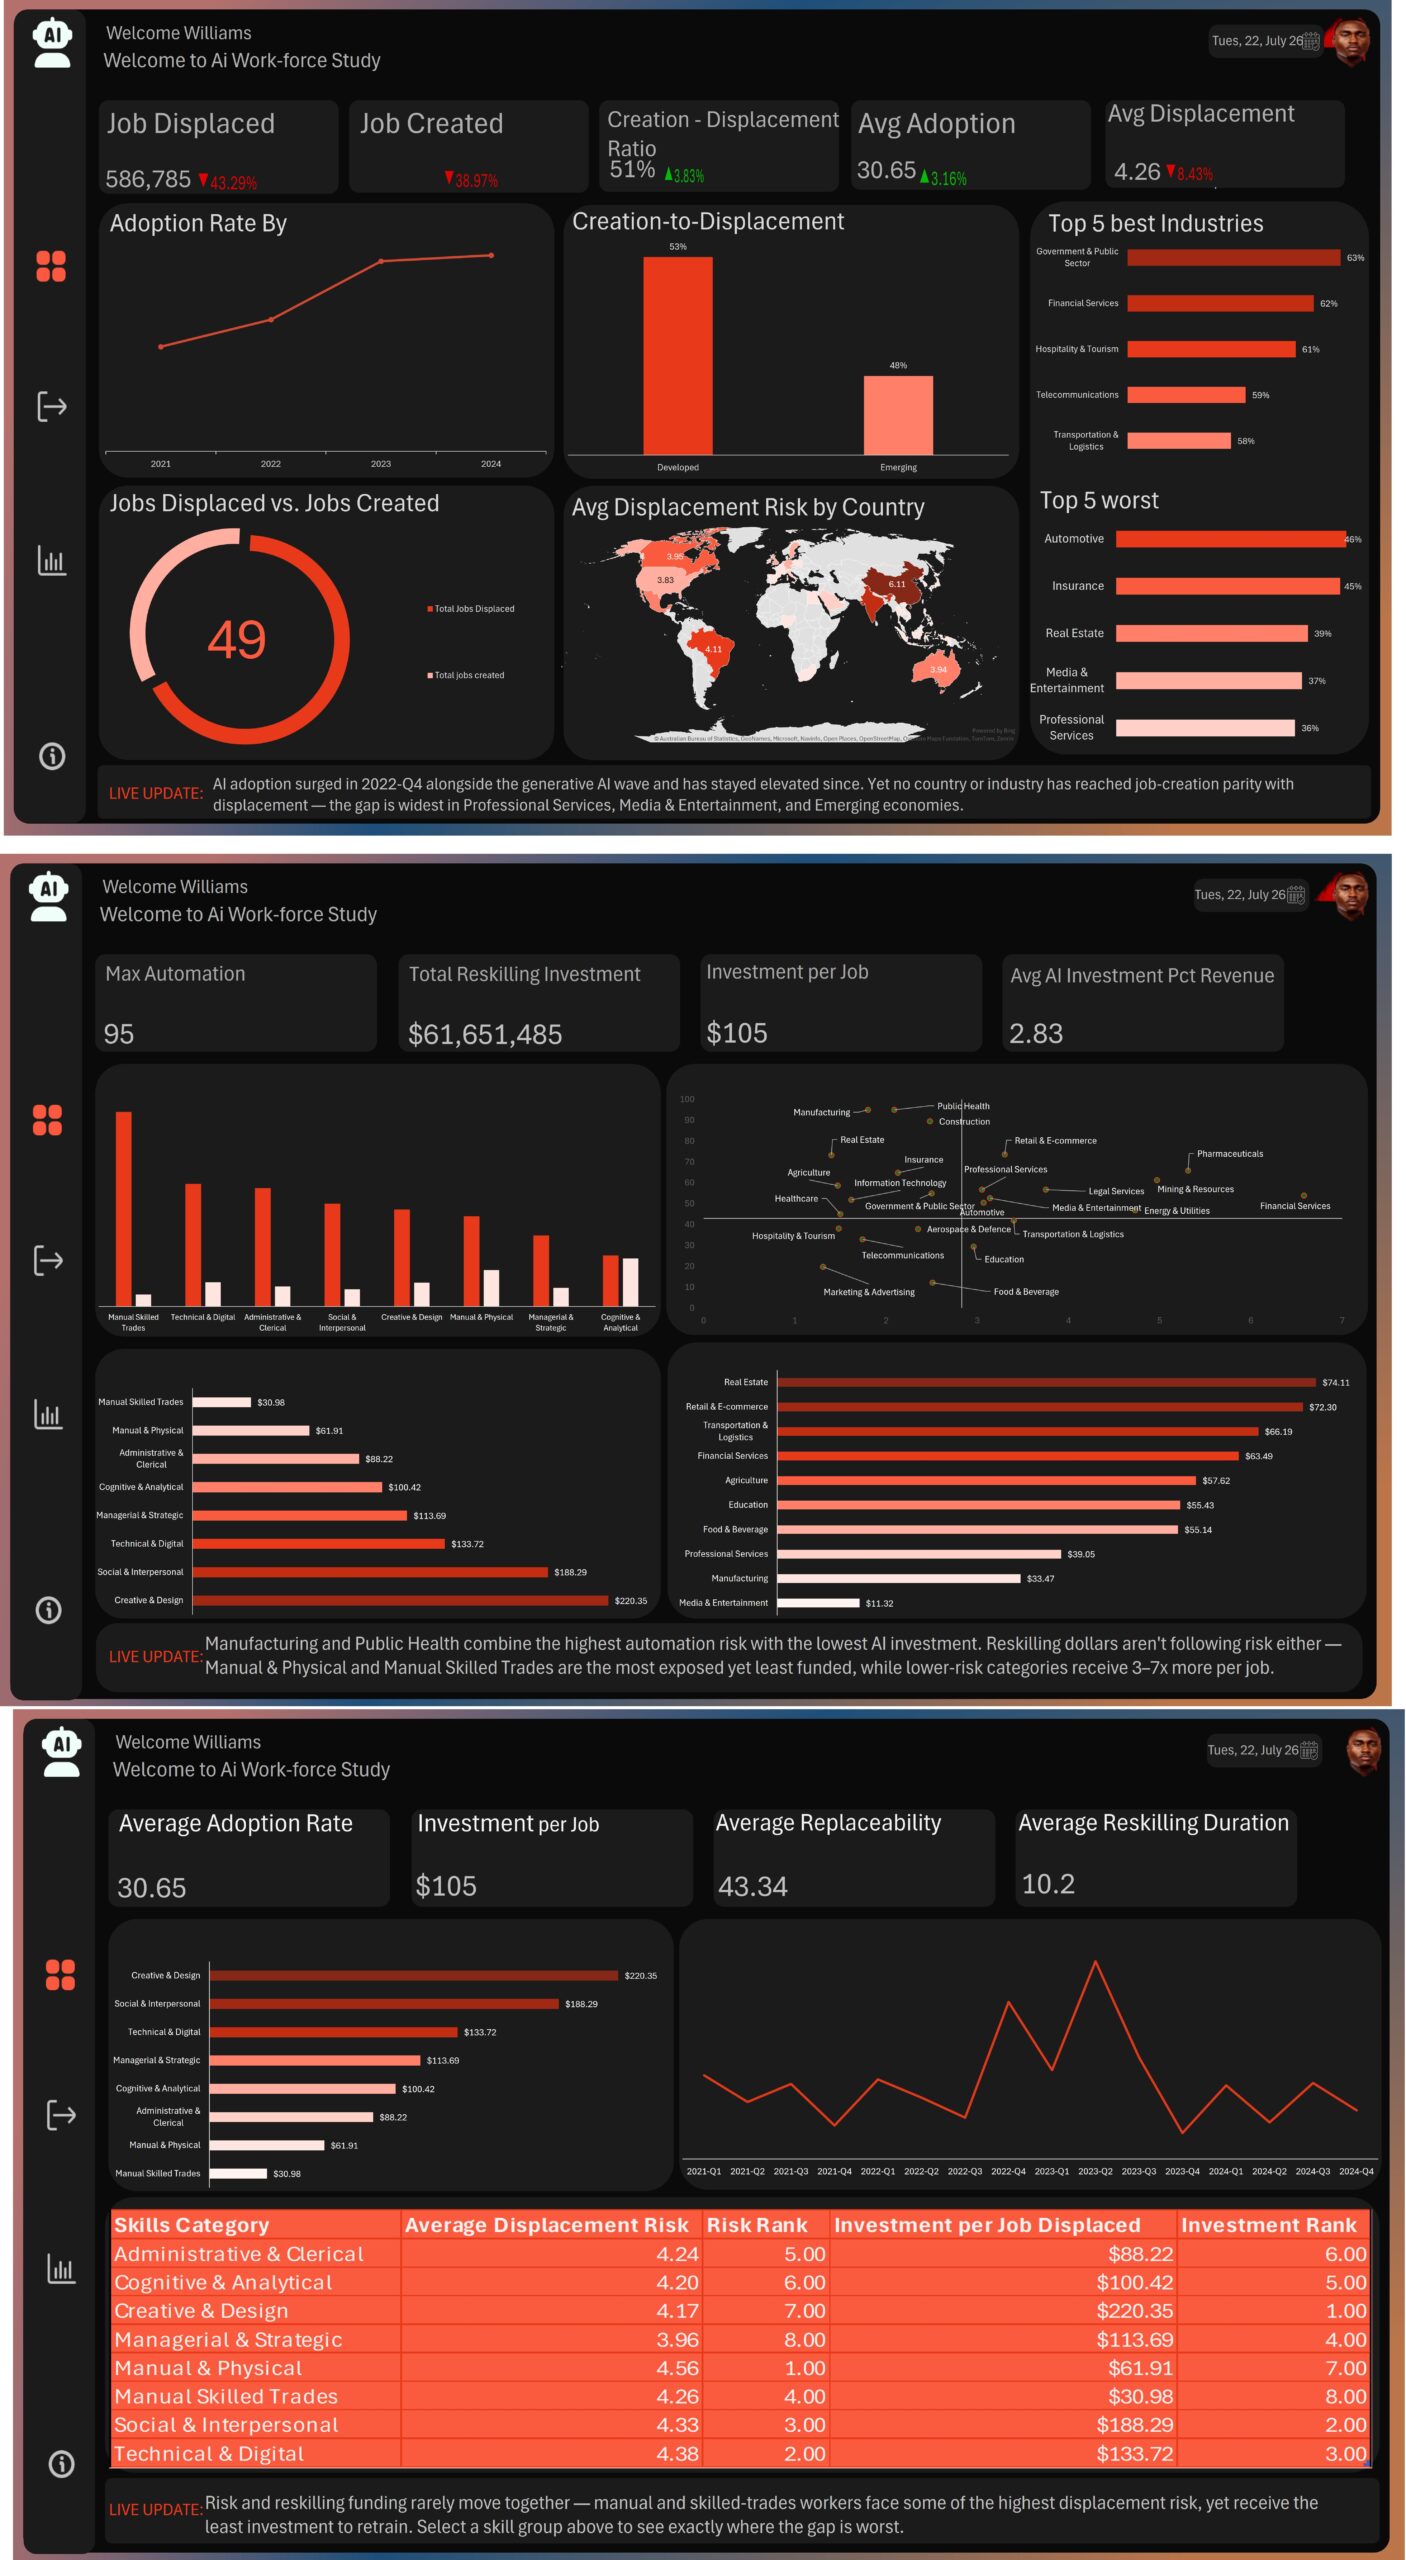
Displacement has outpaced job creation every quarter since 2021 — not just after GenAI. This Power BI dashboard uncovers that...
🛠️ Technical Highlights: 📌Deep-Dive Domain Pages: Dedicated operational tabs for Adoption, Displacement, Reskilling, Industries, Countries, and Policies to separate complex...
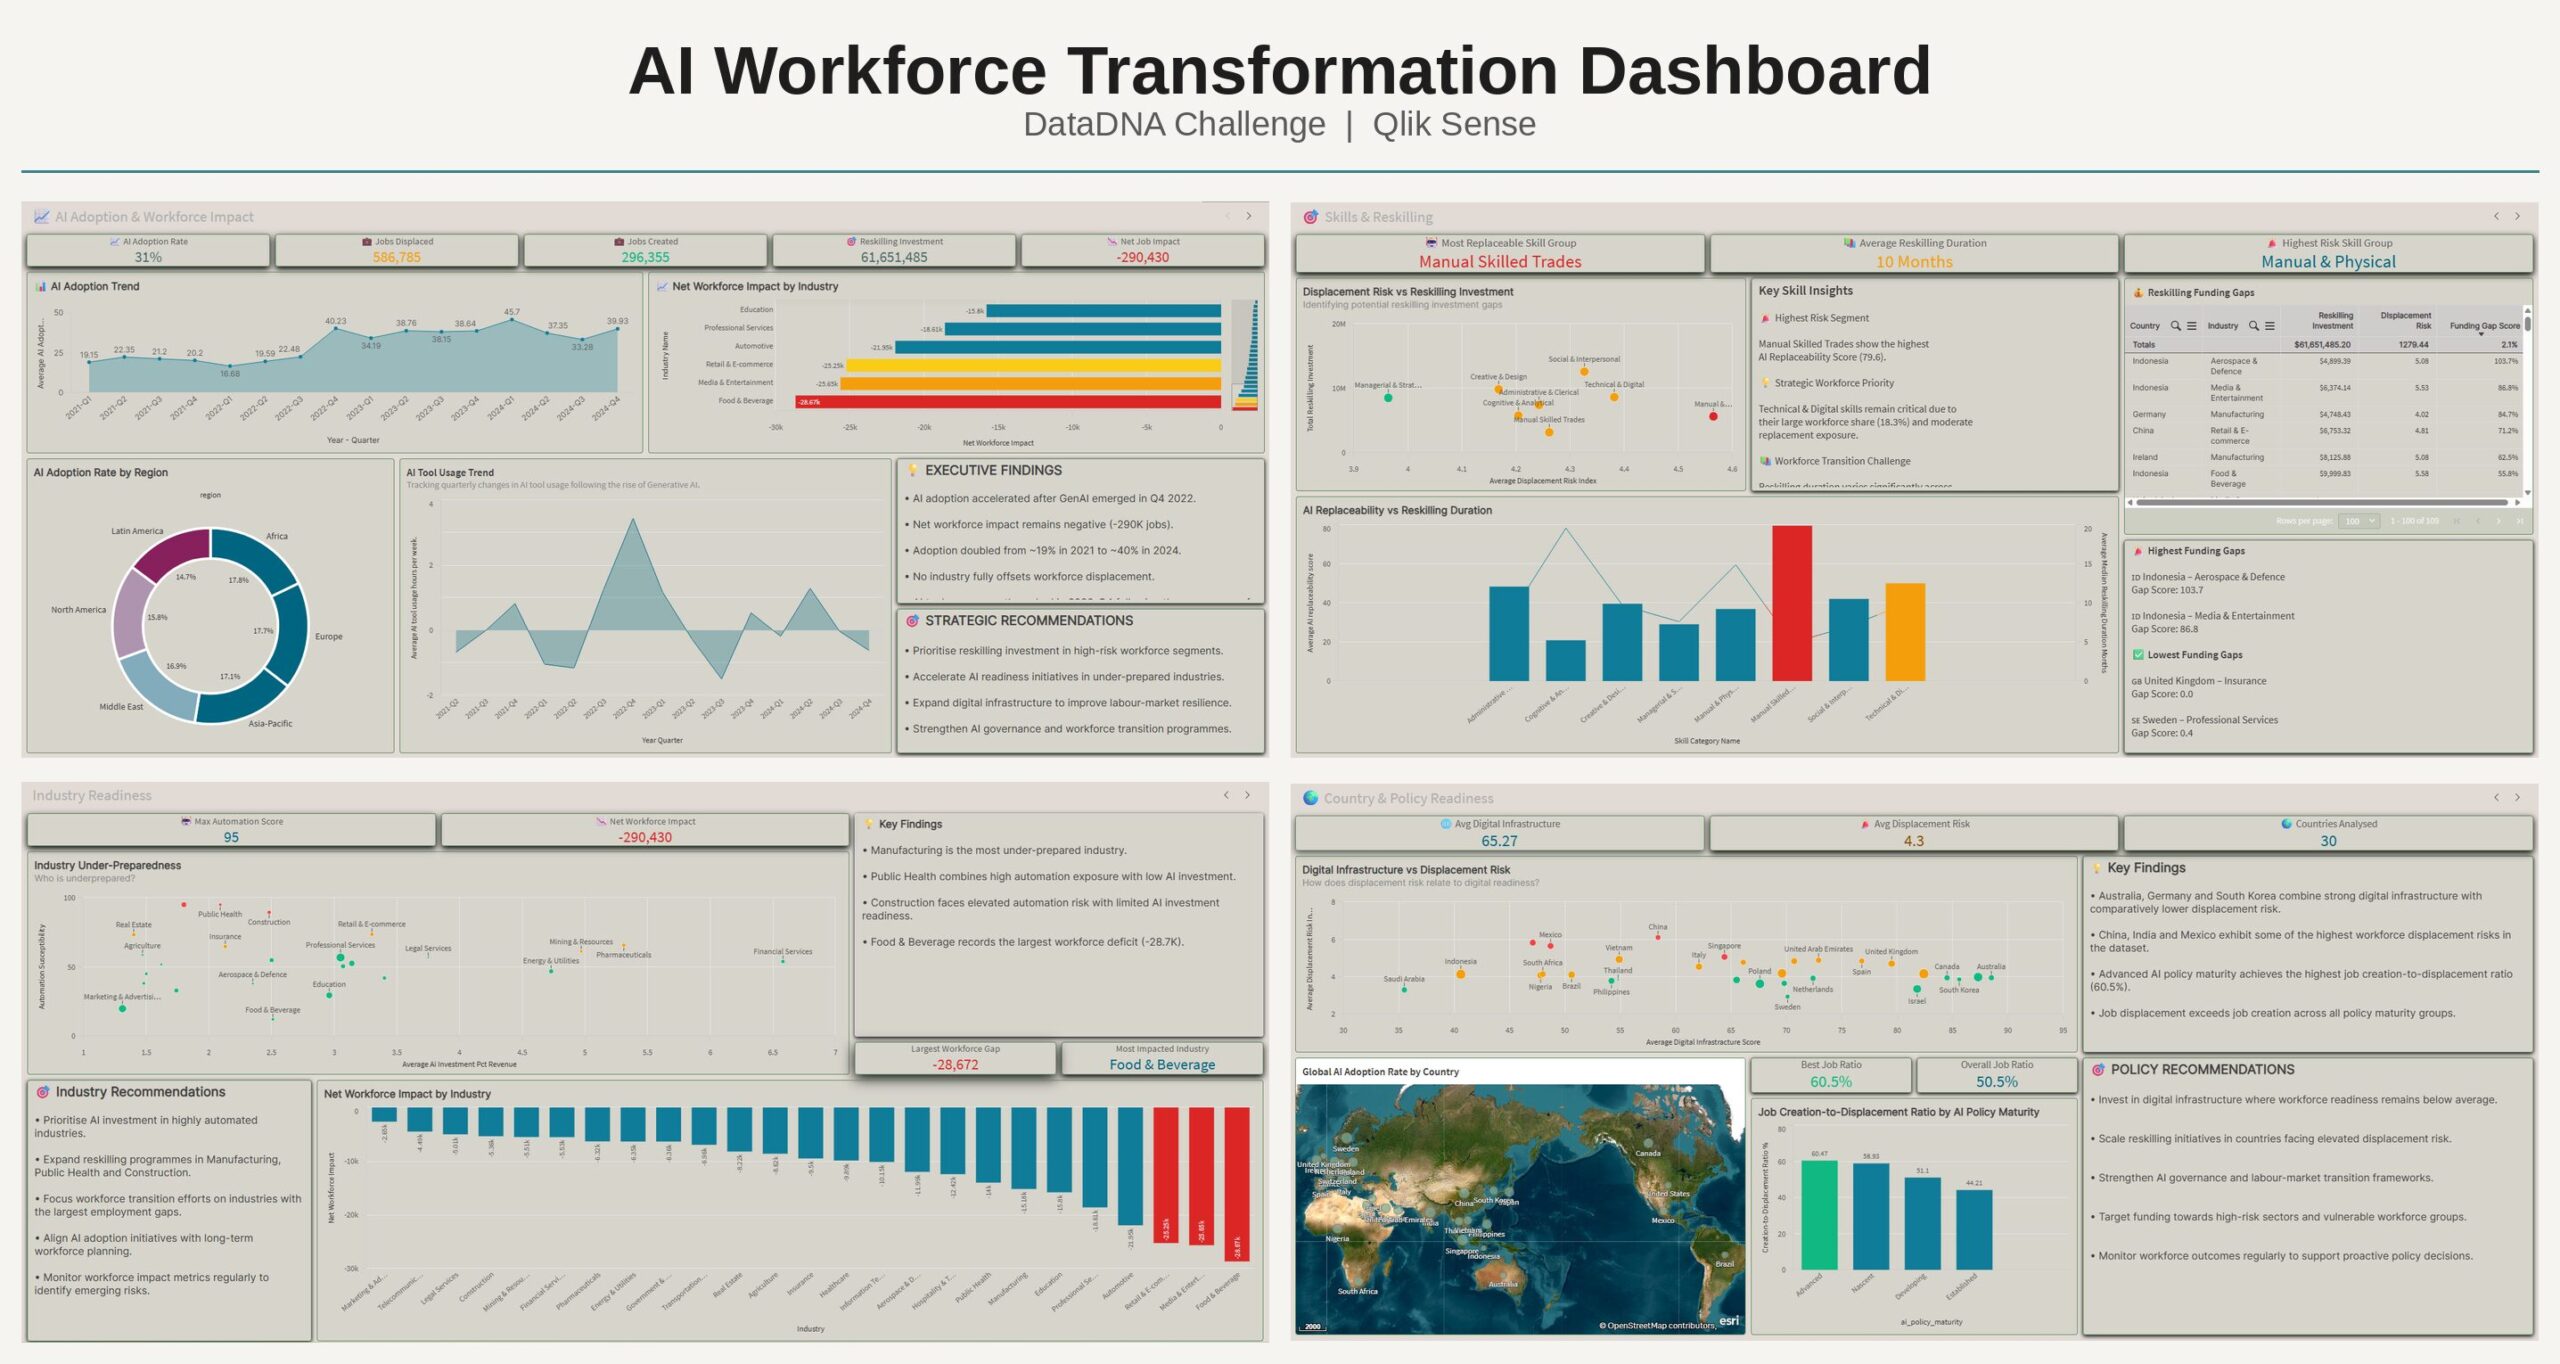
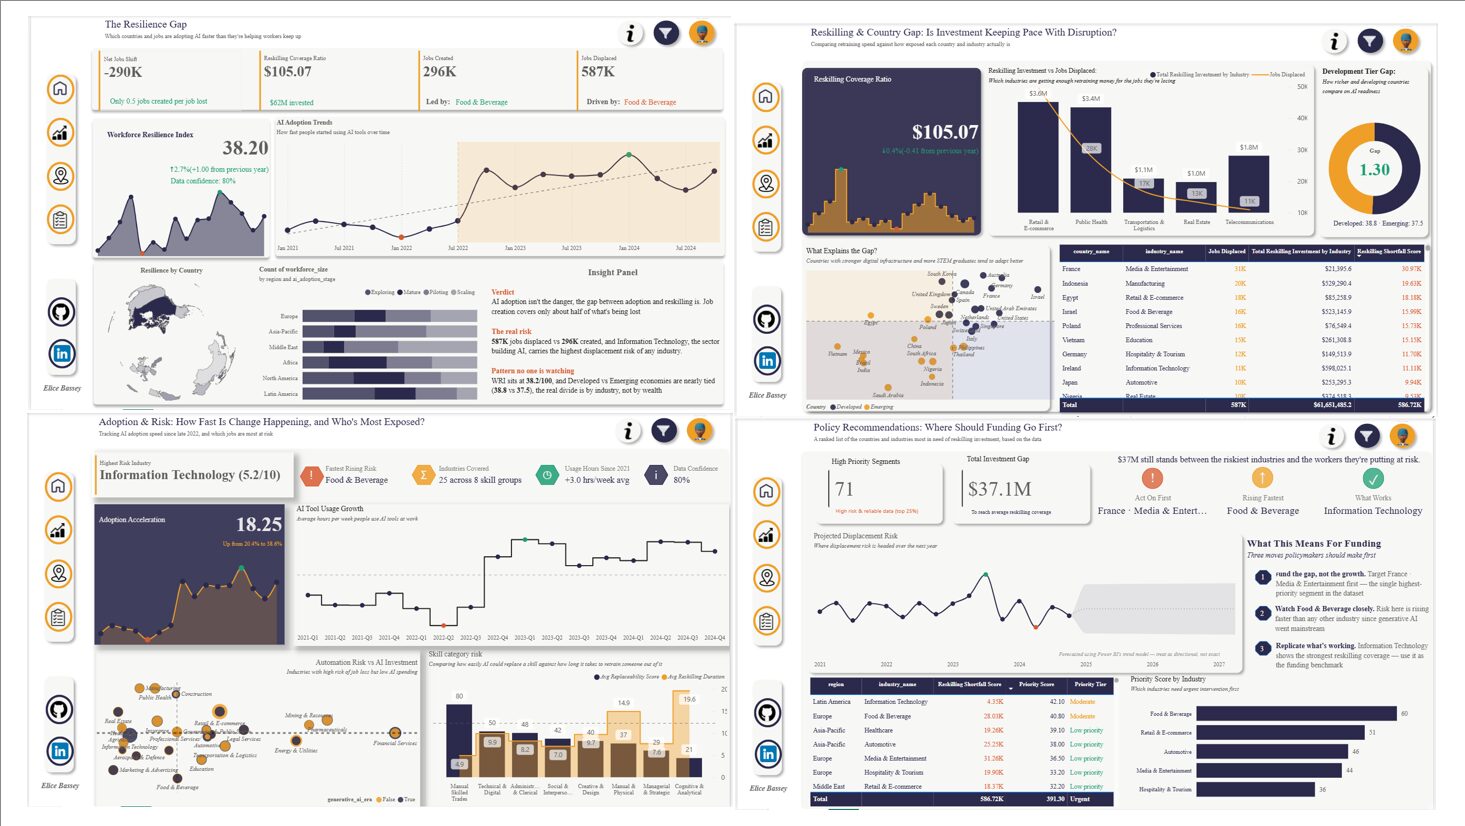
This dashboard analyses the workforce impact of AI adoption across countries, industries, and skill categories between 2021 and 2024. Built...
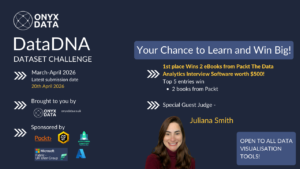
Discover the latest AI & Data challenges


Contact our team

16 Upper Woburn Place, London, Greater London, WC1H 0AF, United Kingdom