Join a community of the most creative Business Intelligence Professionals
Join a community of the most creative Business Intelligence Professionals
Find data professionals with skills verified through real challenge performance.
Browse Talent DirectoryCreate realistic synthetic data for training, testing, and demonstrations.
Explore Dataset Generator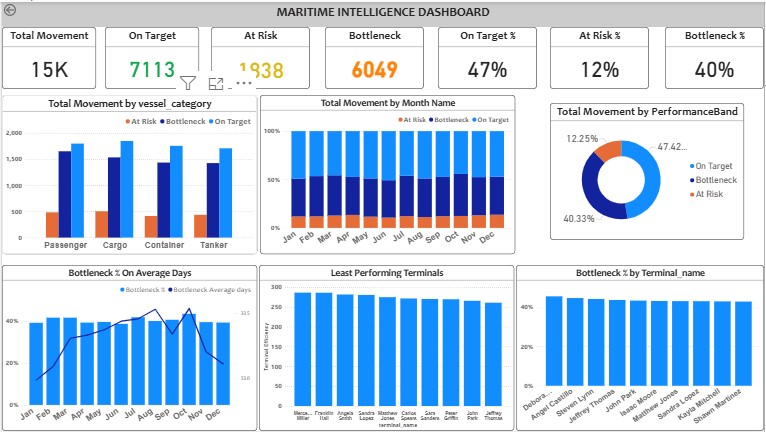
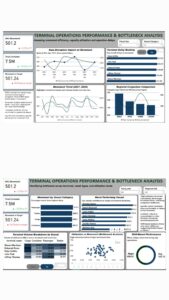
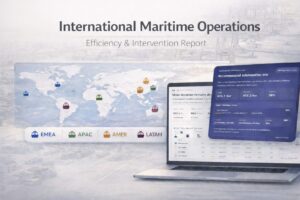
This project delivers an interactive Power BI dashboard that analyzes maritime logistics performance across vessel categories, terminals, and time periods. It tracks key operational KPIs such as total movements, on-time performance, bottlenecks, and risk levels, providing a clear view of efficiency and delays. The dashboard enables stakeholders to identify underperforming terminals, monitor monthly trends, and uncover bottlenecks impacting operations, supporting data-driven decision-making to improve overall supply chain performance.
Contact our team

16 Upper Woburn Place, London, Greater London, WC1H 0AF, United Kingdom


 ewoma agbanoma
 Joana Oliveira
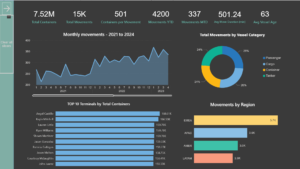
 Eamon McAllister