Join a community of the most creative Business Intelligence Professionals
Join a community of the most creative Business Intelligence Professionals
Find data professionals with skills verified through real challenge performance.
Browse Talent DirectoryCreate realistic synthetic data for training, testing, and demonstrations.
Explore Dataset Generator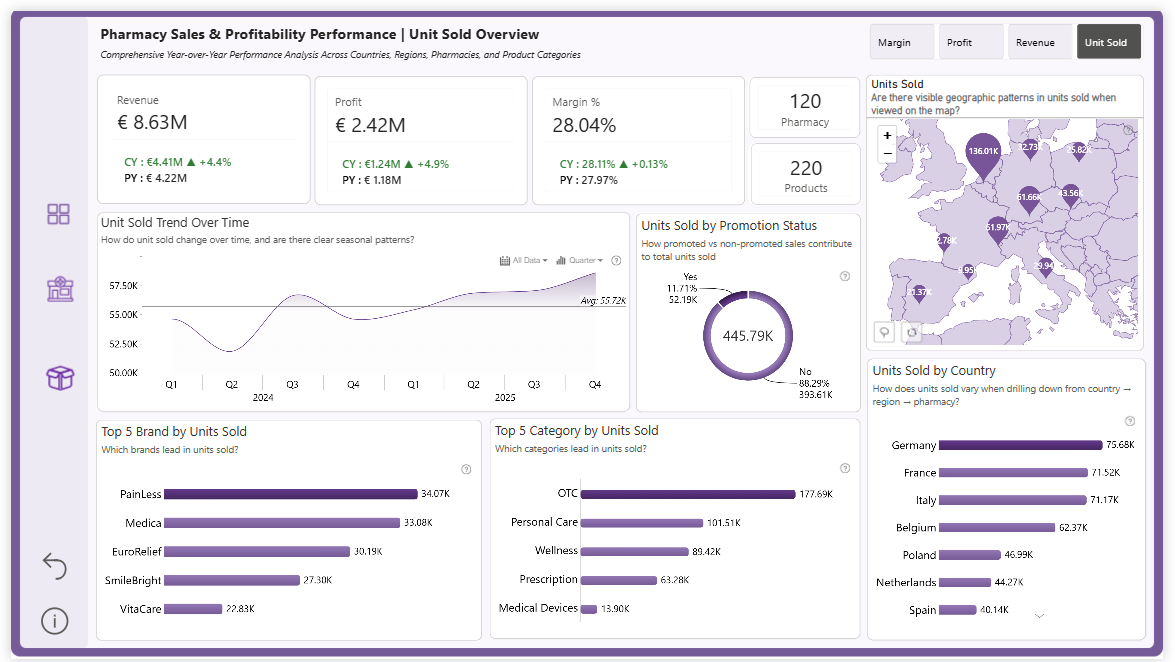
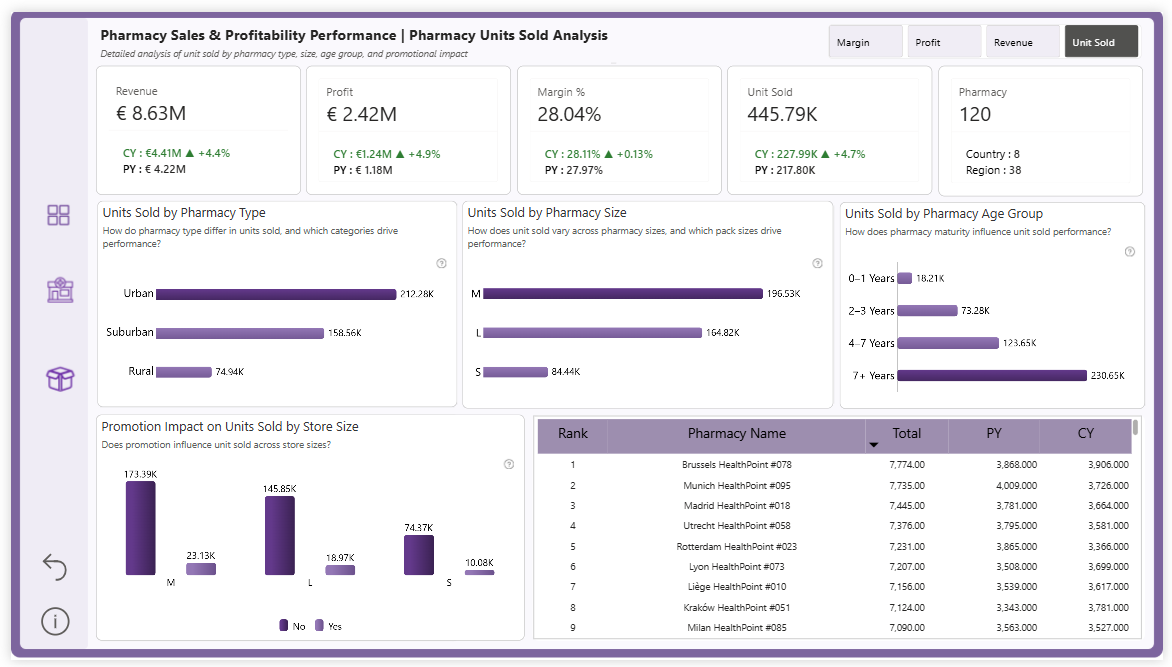
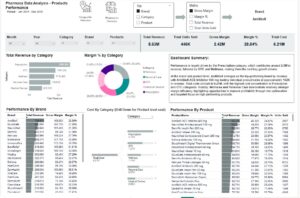
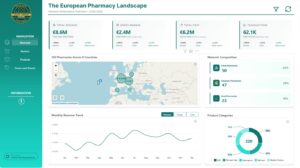
Built a 3-page Power BI dashboard analyzing €8.63M revenue, €2.42M profit, and 28.04% margin across 120 pharmacies, 220 products, and 7 European countries Developed DAX measures for YoY tracking and dynamic KPI switching across Revenue, Profit, Margin, and Units Sold with drill-down reporting Identified OTC as top category (177.69K units) and PainLess as highest-volume brand (34.07K units) for product performance evaluation Found non-promoted products generated higher margins (29% vs. 20%), providing insights to optimize promotional spend Discovered Branded products outperform Generic on margin (28% vs. 25%), recommending product mix optimization to improve profitability
Contact our team

16 Upper Woburn Place, London, Greater London, WC1H 0AF, United Kingdom


 Dharmashree Nikalje