Minimum Viable Output for March-April 2026 DataDNA – Dataset Challenge: INTERNATIONAL_MARITIME_LOGISTICS_TERMINAL_EFFICIENCY

Hire Verified Talent

Find data professionals with skills verified through real challenge performance.

Browse Talent Directory

Generate Custom Datasets

Create realistic synthetic data for training, testing, and demonstrations.

Explore Dataset Generator
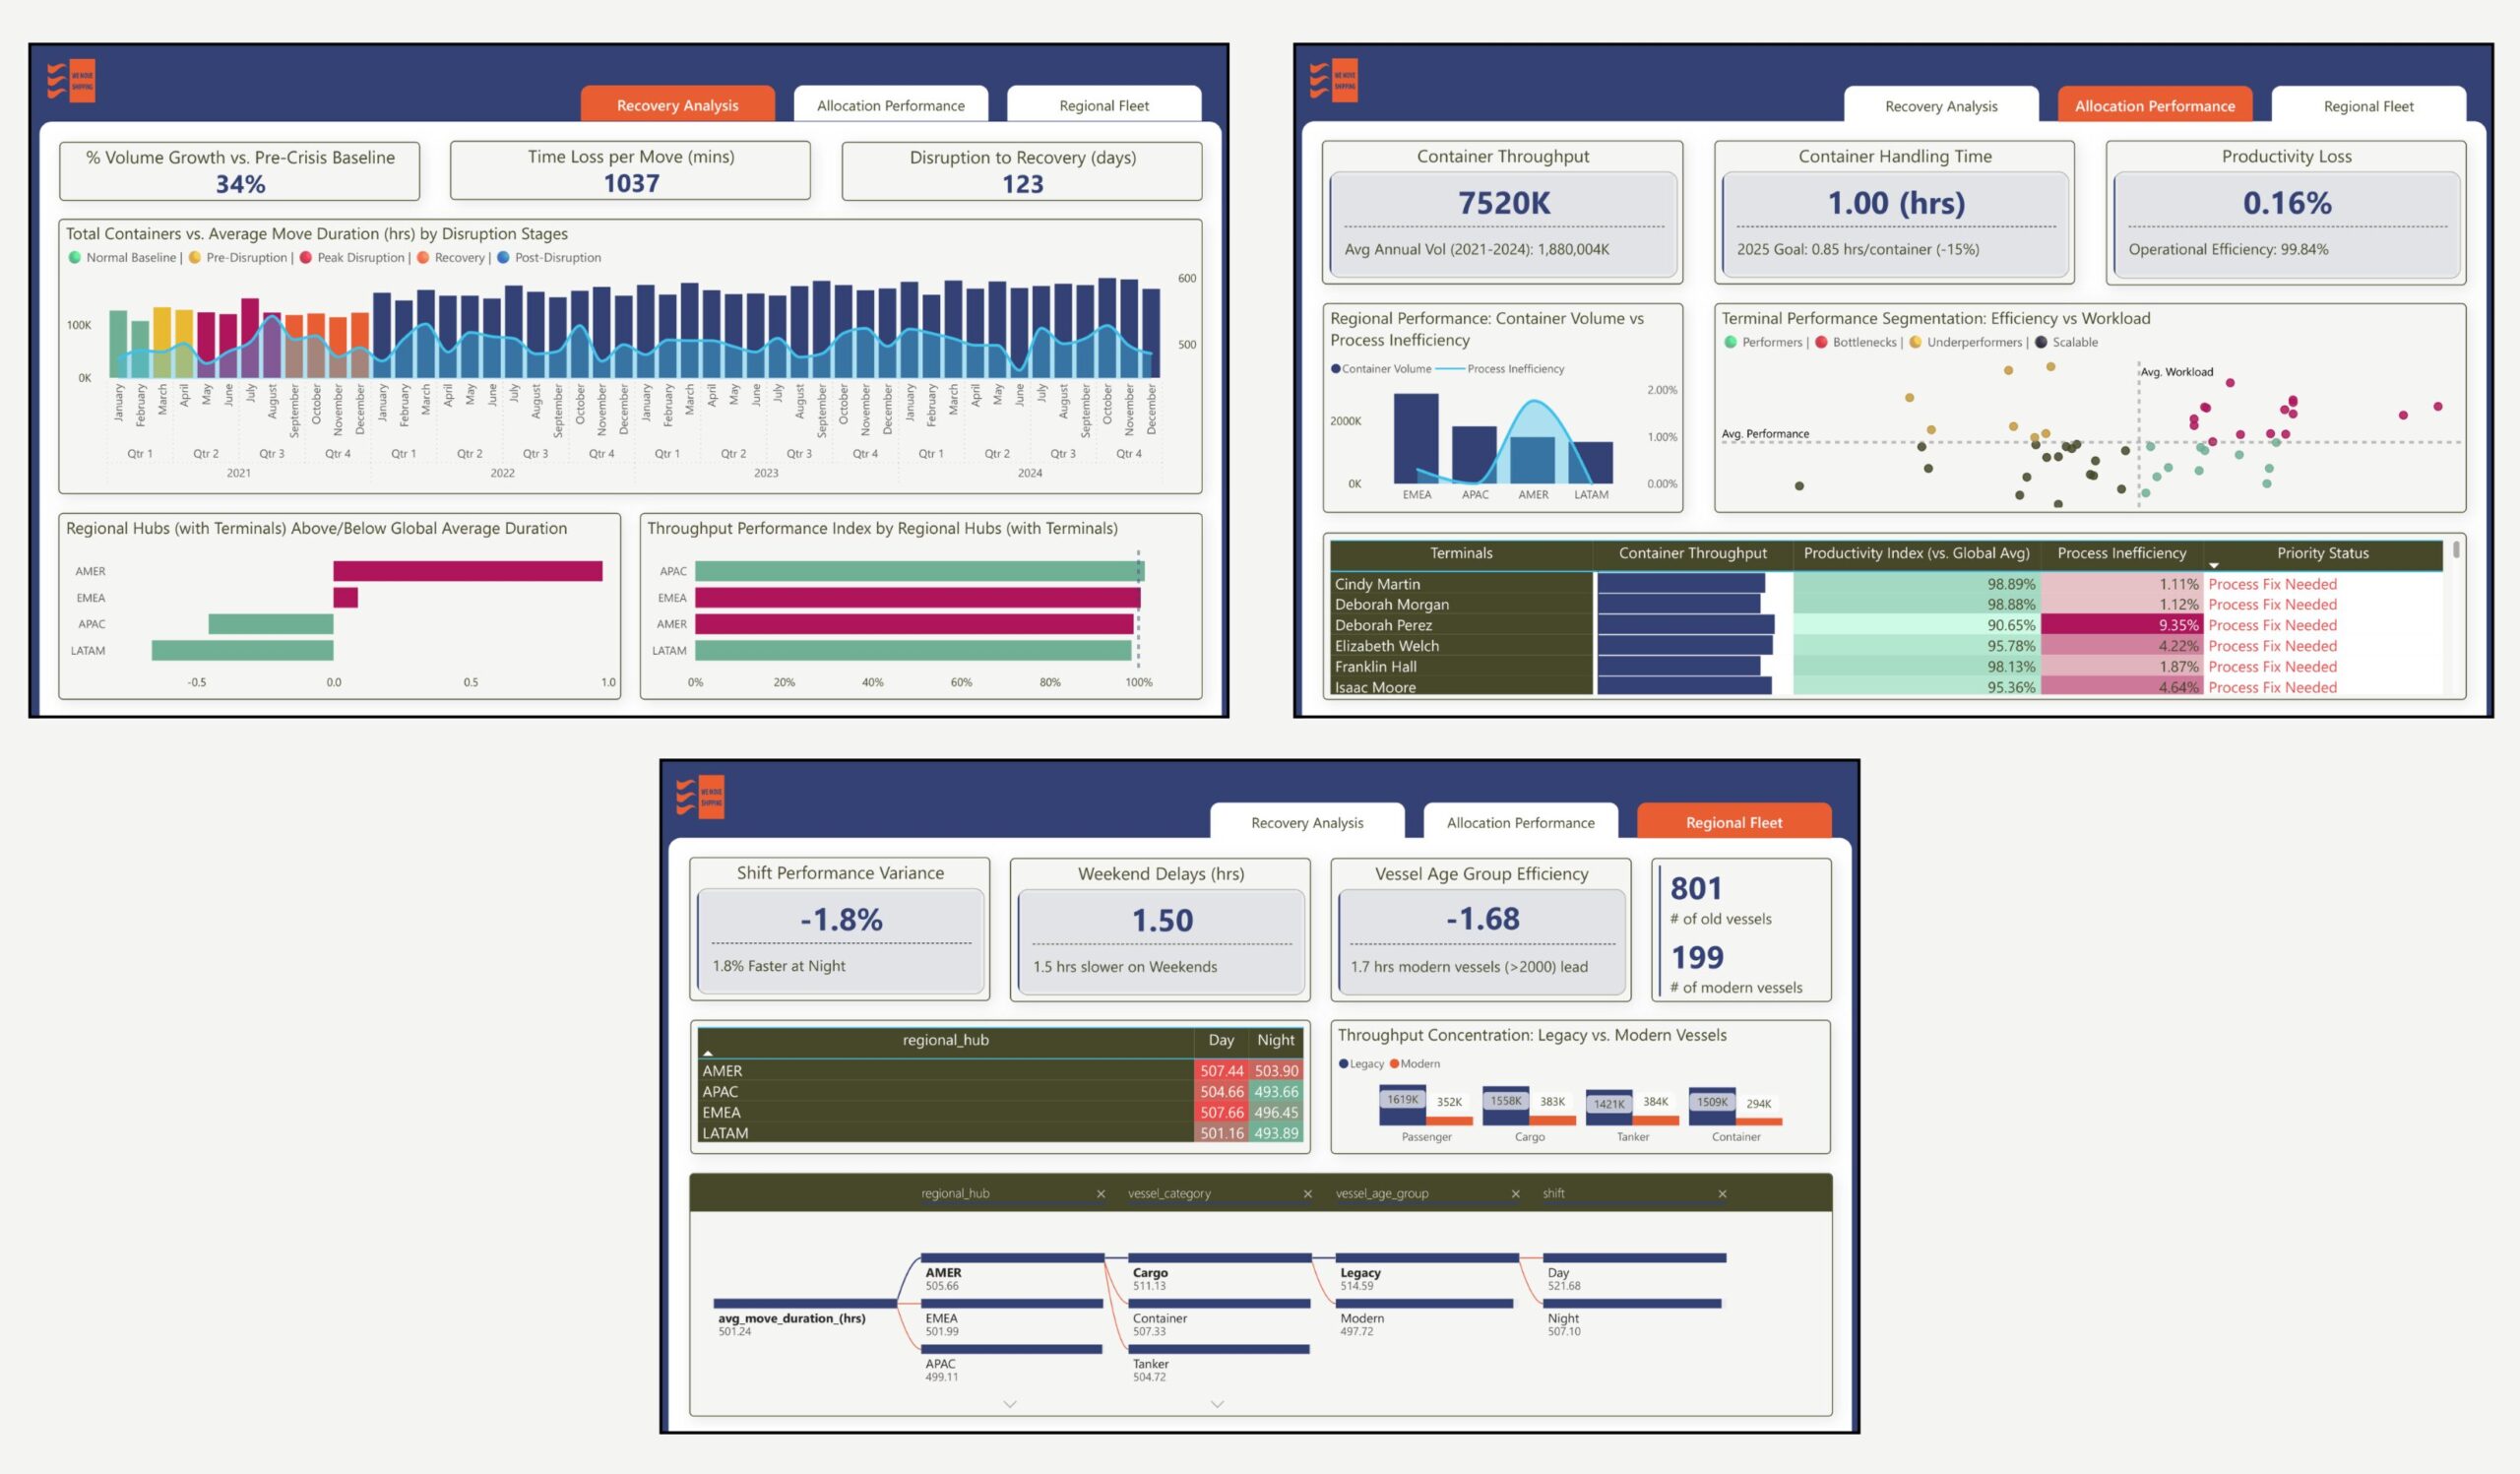
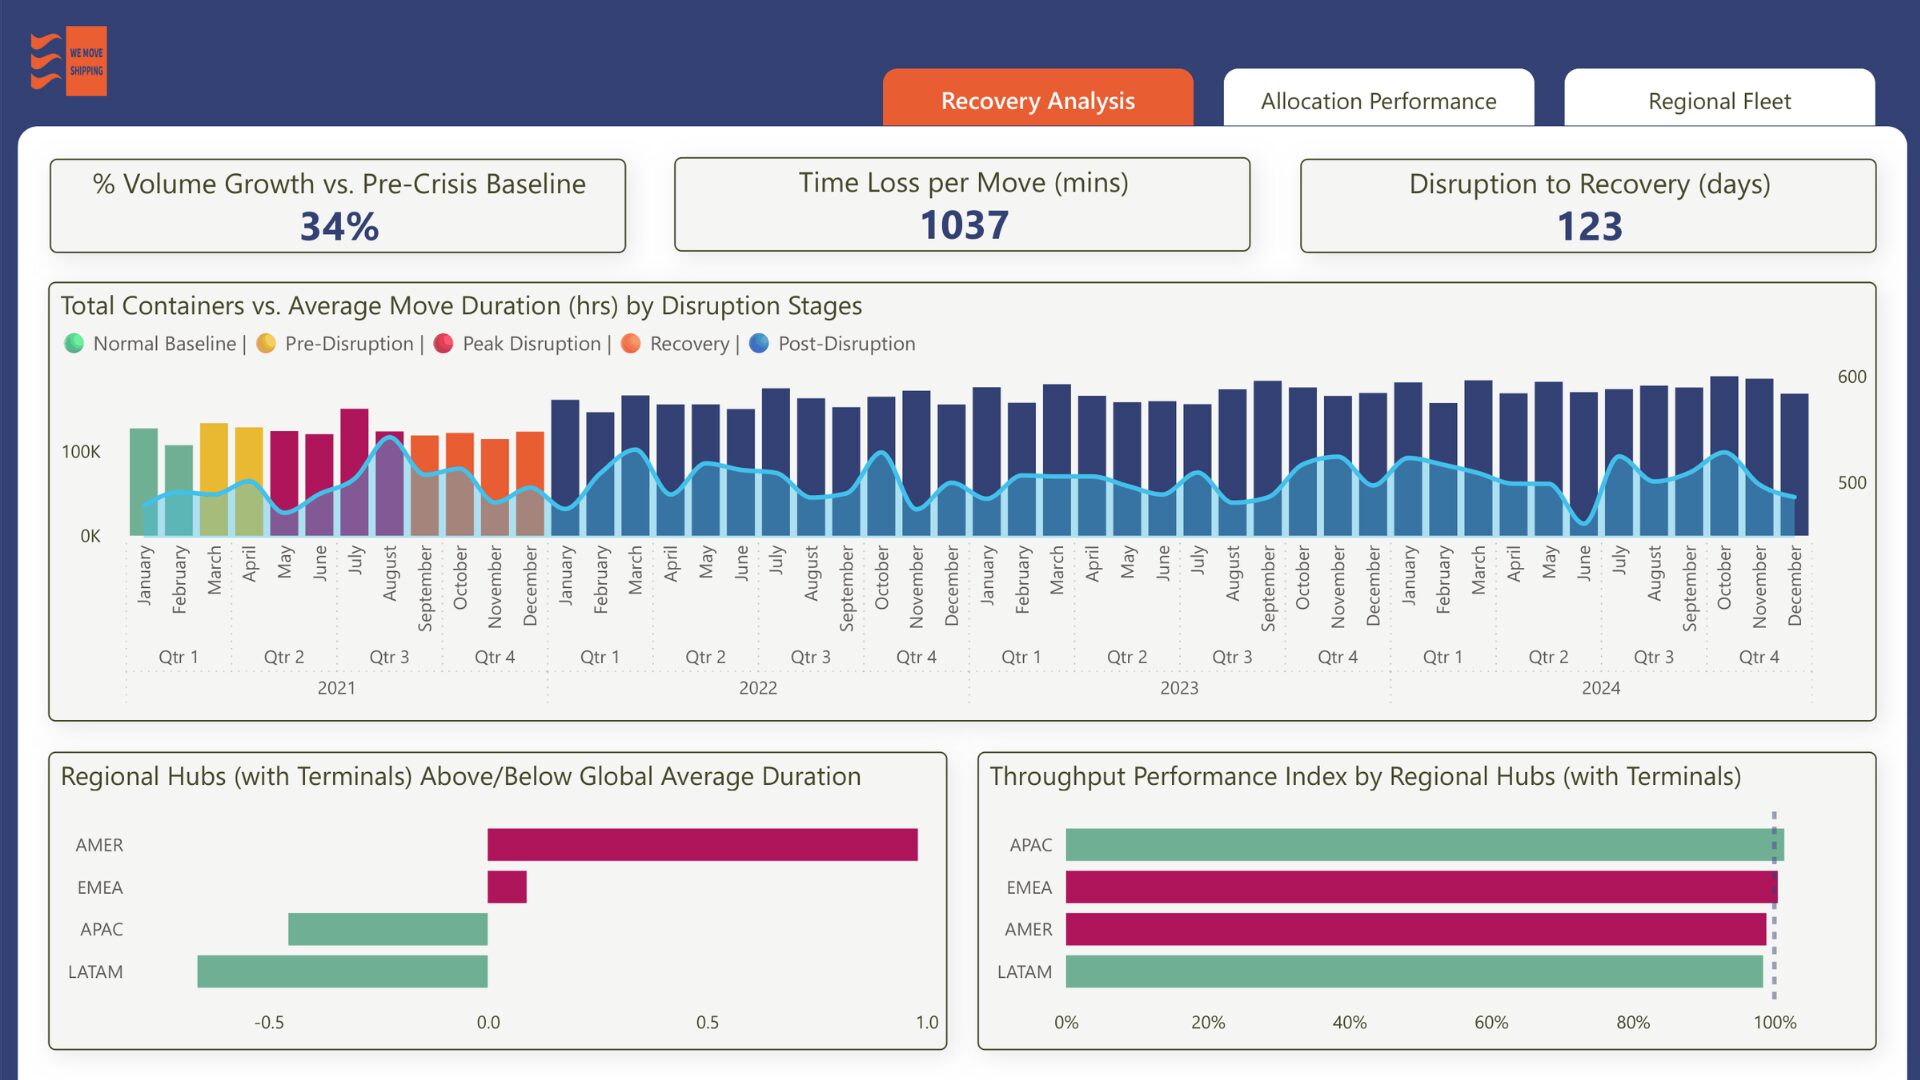
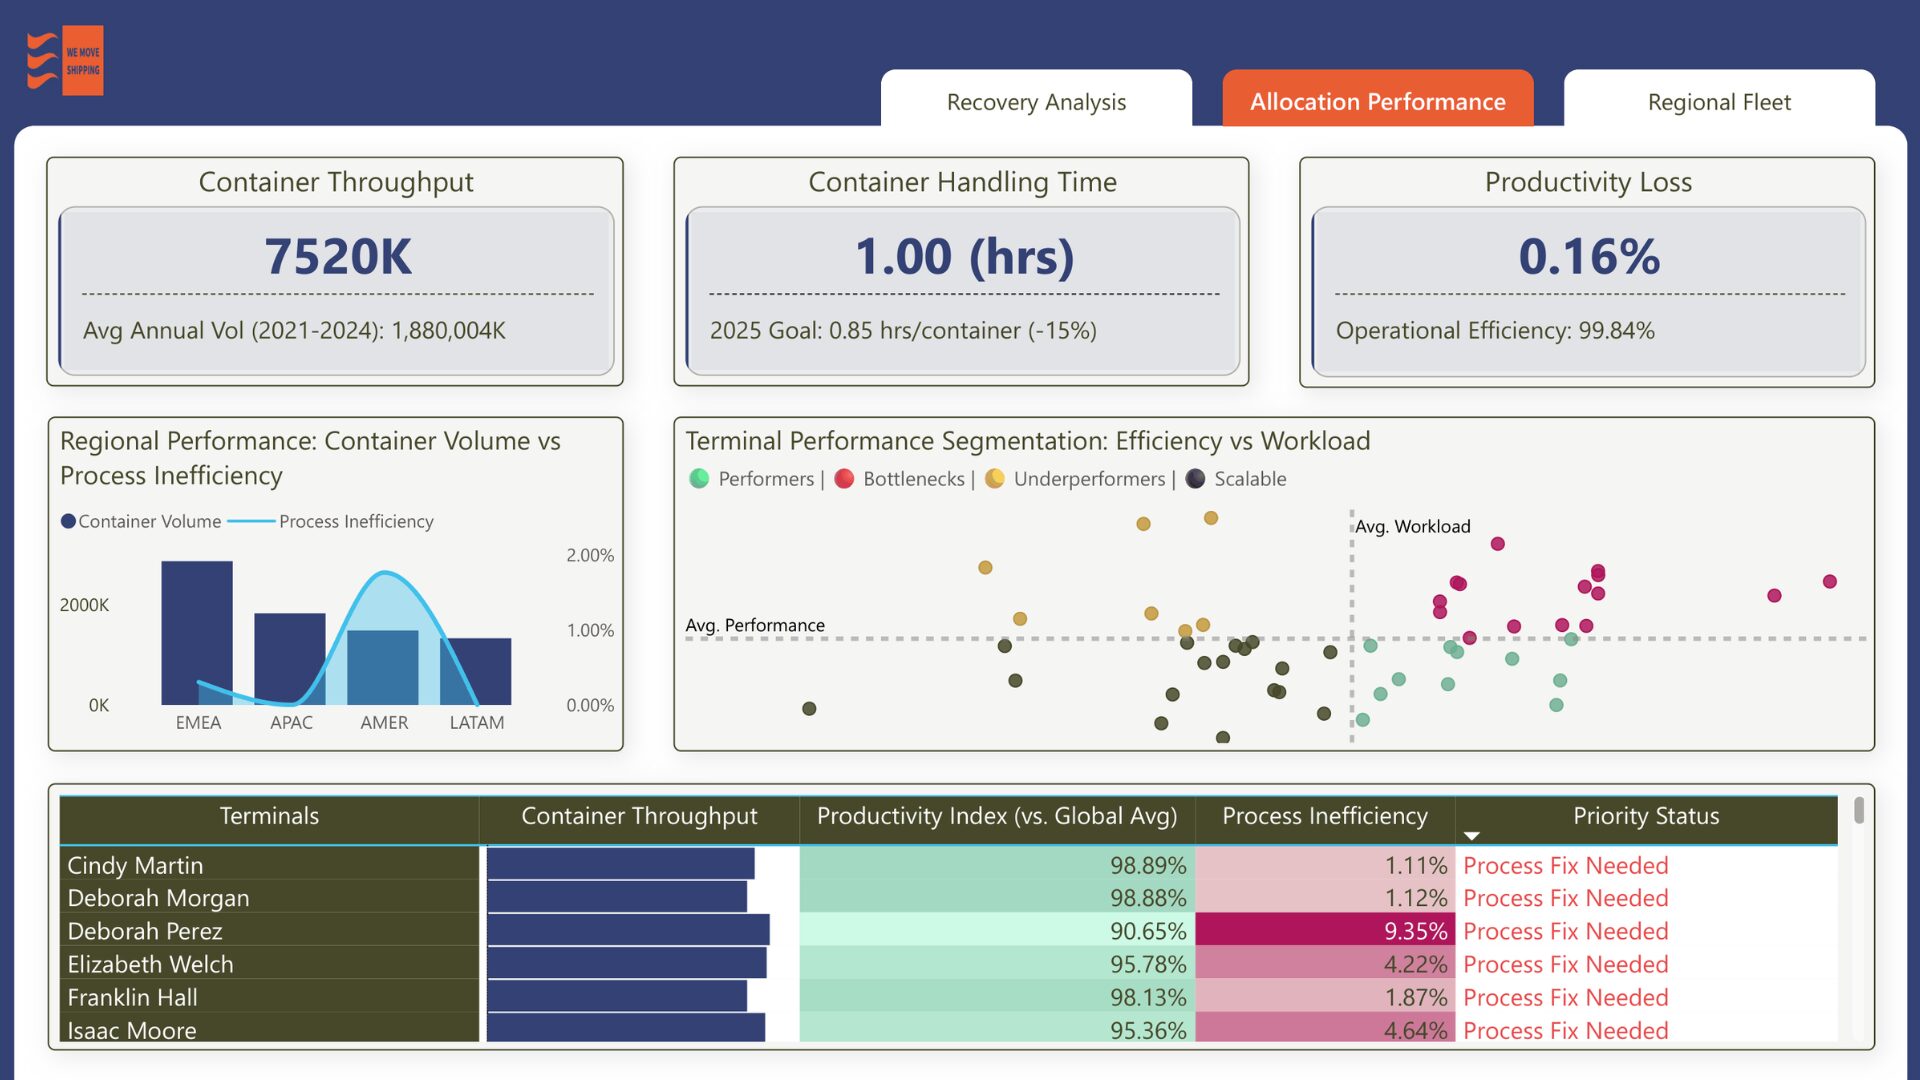
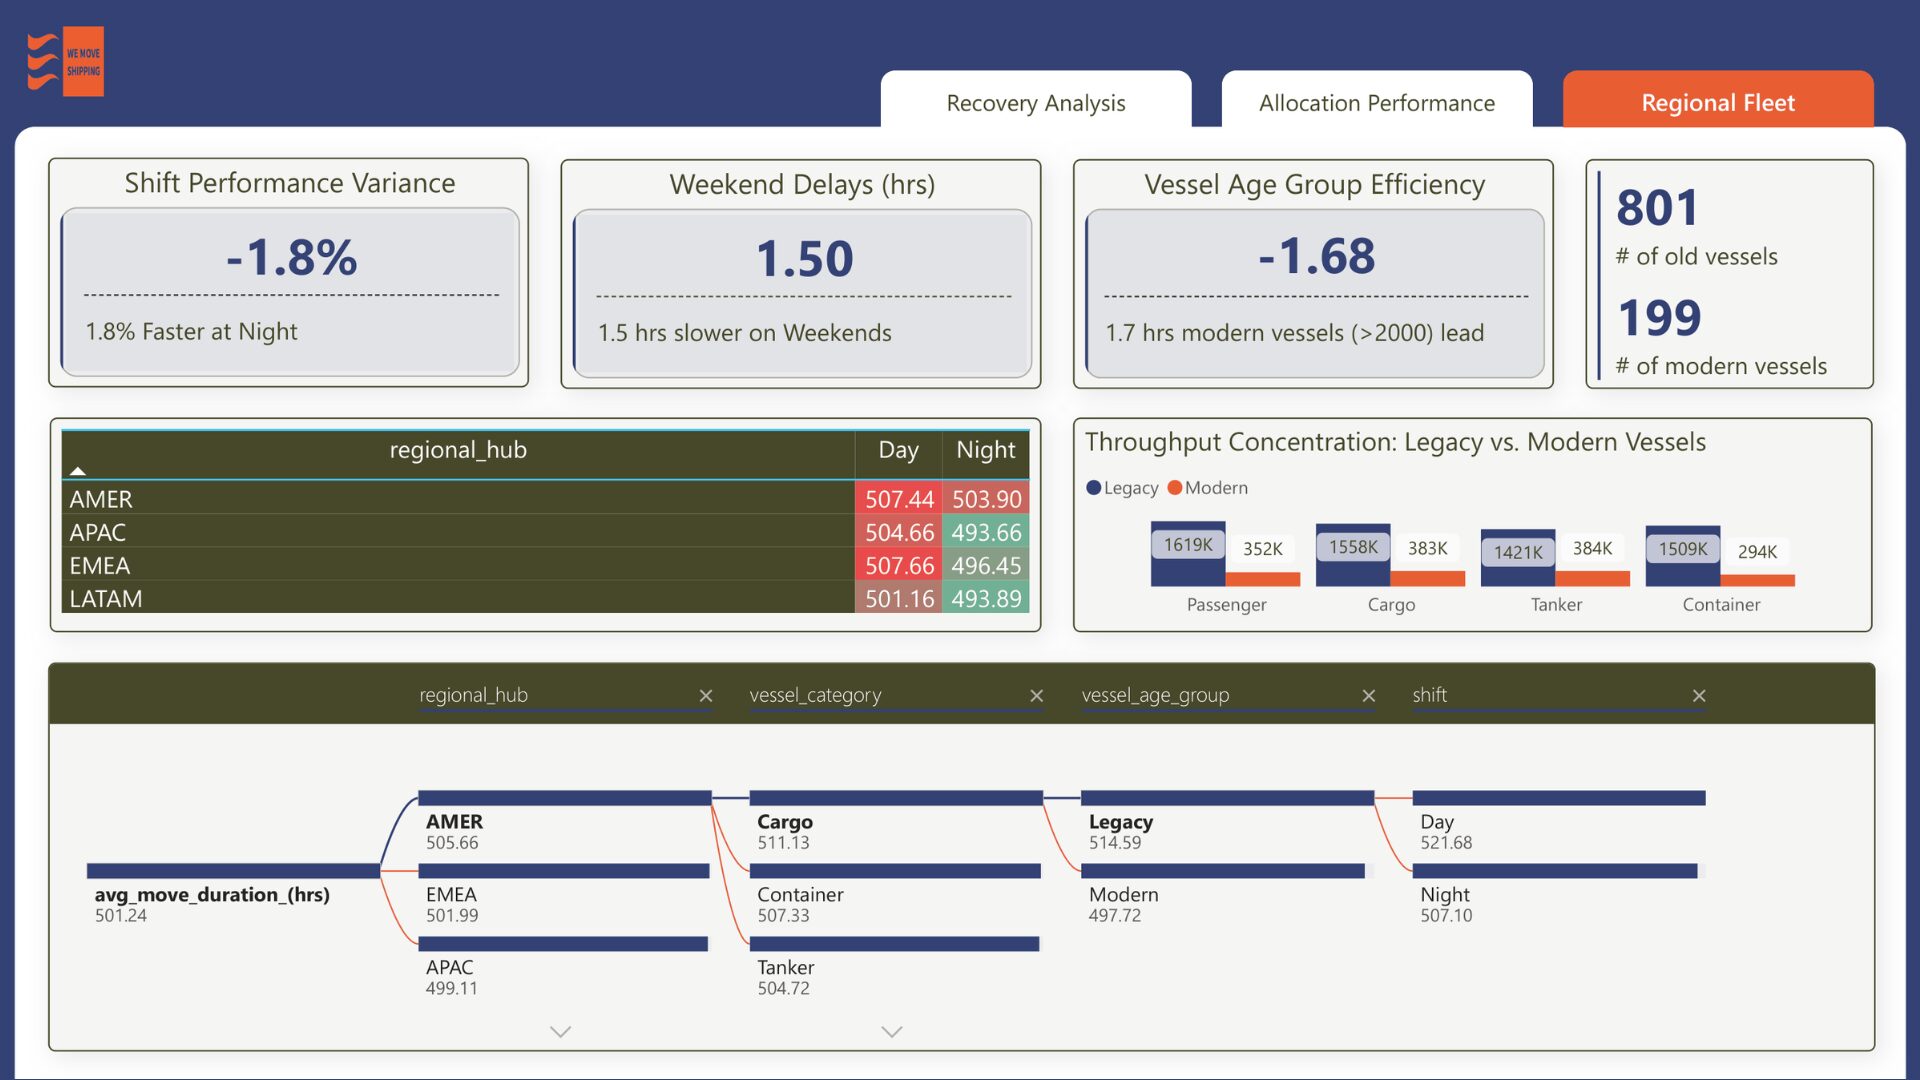
Minimum Viable Output for March-April 2026 DataDNA – Dataset Challenge: INTERNATIONAL_MARITIME_LOGISTICS_TERMINAL_EFFICIENCY

Findings: >>Recovery Analysis The Suez incident triggered a 123-day recovery window, characterized by a 34% surge in "vessel bunching" volume, which evolved into a permanent step-up in global throughput demand. This "new normal" imposes a 1,037-minute efficiency tax per move, exposing a regional disparity where high-volume hubs, such as EMEA, are red-lining due to infrastructure stress, while the AMER hub suffers from structural bottlenecks despite lower throughput. To mitigate the risk of total system seizure during future disruptions, the 2026 investment strategy must prioritize capacity expansion in EMEA to absorb high-intensity surges and a comprehensive process audit in AMER to resolve its inherent operational latency. >>Allocation Performance While the global network maintains a 99.84% operational efficiency with a handling time of 1.00 hours per container, the regional and terminal-level data reveal critical infrastructure imbalances that threaten our 2025 goal of 0.85 hrs/container. The Regional Performance analysis identifies a clear disparity: EMEA successfully processes the highest container volumes despite minor inefficiencies, whereas AMER exhibits the most significant process gaps relative to its workload. At the terminal level, our Performance Segmentation highlights a dense cluster of "Bottleneck" and "Underperformer" sites, specifically those in the upper-right quadrant of the scatterplot that are struggling under high workloads, contrasted against "Performers" and "Scalable" hubs that possess the latent capacity to absorb excess volume. With the Priority Status matrix currently flagging nearly all scrutinized terminals as either "Optimal" or requiring a "Process Fix," the immediate operational mandate is to prioritize infrastructure optimization and resource reallocation from high-pressure AMER bottlenecks and EMEA toward our scalable hubs to mitigate the identified 0.16% productivity loss and secure long-term network resilience. To see which terminals can benefit more through capacity expansion, you can access the file to explore my report. >>Regional Fleet An analysis of our fleet performance reveals that vessel age and weekend operational lag are the most significant predictors of movement delays, with legacy vessels—which constitute 80% of our fleet (801 units)—performing 1.68 hours slower than modern alternatives. While night shifts surprisingly demonstrate a 1.8% efficiency advantage over day shifts across all regional hubs, this gain is completely offset by a severe 1.5-hour degradation in performance during weekends. The Decomposition Tree highlights the AMER regional hub as the primary operational outlier, driven specifically by a high concentration of Legacy Cargo vessels during day shifts, which peak at an average duration of 521.68 hours. Consequently, our baseline efficiency is structurally tied to a "modernization gap" where the overwhelming throughput concentration of older vessels, particularly in the Passenger and Cargo categories, creates a systemic bottleneck that night-shift gains alone cannot resolve, necessitating a strategic focus on modernizing the AMER-based fleet and addressing the critical weekend service-level drop. To explore more, please access and explore my report. >>Recommendations: >Prioritize EMEA for crane expansions and yard automation. Since this hub bears the brunt of global surges (as seen in the Suez audit), increasing its "peak capacity" is the fastest way to hit the -15% efficiency target. Conduct a business process audit specifically for AMER. Since volume isn't the primary cause of delay here (unlike EMEA), the bottleneck is likely administrative, customs-related, or labor-shift synchronization. >Incentivize Modernization: Offer "Fast-Track" berthing priorities for modern vessels to encourage carriers to upgrade. The "Weekend Shift Sync": Apply the high-efficiency night-shift protocols to weekend day-shifts to eliminate the 1.5-hour "service-level sag." >Overall, to optimize the global network and mitigate the 1,037-minute efficiency tax, the strategic focus must shift toward load balancing across terminals identified as "Performers" or "Scalable." While the EMEA and AMER hubs are currently red-lining due to infrastructure stress and structural bottlenecks, the Allocation Performance scatterplot reveals specific terminals that maintain high efficiency despite varying workloads. By cross-referencing the Regional Fleet analysis with the Priority Status matrix, the team can identify underutilized hubs—particularly in the APAC and LATAM regions—that demonstrate the operational elasticity to absorb excess cargo. Prioritizing these "Scalable" terminals for diverted volumes will alleviate the pressure on high-risk bottlenecks, turning a regional disparity into a strategic advantage and securing the path toward our -15% handling time goal. >>Approach for the report: >Data Preparation Using a data query, I identified and inspected the data based on its usability for the report. I cleansed the data by changing the data types of the records, uppercasing, capitalizing each word, or trimming some of the data to ensure consistency. I created new columns from the dim_time table, including quarter name, month name, weekday, or weekend. I discovered that the source vessel_id contained duplicates in the dimension table (e.g., ID 434 assigned to multiple keys). To maintain a valid 1-to-Many relationship, I generated a Surrogate Key using an Index column in the Dimension table. I then mapped this back to the Fact table using the vessel_key to ensure each movement was attributed to the specific, unique vessel. I performed a data profile on the route_geometry column and found it had a cardinality of 1. Since 100% of the rows contained identical coordinate strings, the column provided no analytical value for route optimization or spatial variance. It means the "ships" are all traveling the same "path" but taking different amounts of time to do it. >Data Modeling I modeled the data through a star schema since we have a three-dimensions table and one fact table. >Data Analysis I did the analysis with the use of DAX measures for quick calculations, and other measures’ purpose is for the legend or colors in some of the visuals. >Data Visualization I followed the Z layout, making sure that the elements are consistent across the pages. I have a minimum of 6 elements and a maximum of 7 elements.

Skills & Tools Used:

Power BI

Share this Project:

Get In Touch

Contact our team

    name

    email

    number

    Pre-estimated budget

    Message

    locations

    Office Address

    16 Upper Woburn Place, London, Greater London, WC1H 0AF, United Kingdom

    call

    Telephone number

    +44 204 534 7858
    Loader