Join a community of the most creative Business Intelligence Professionals
Join a community of the most creative Business Intelligence Professionals
View the DataDNA Data Visualisation portfolios below
Browse AI-reviewed portfolios from our global community of data professionals
Used Power BI for the Presentation Downloaded and Explored the Data provided Used the guide in developing the Analytics and...

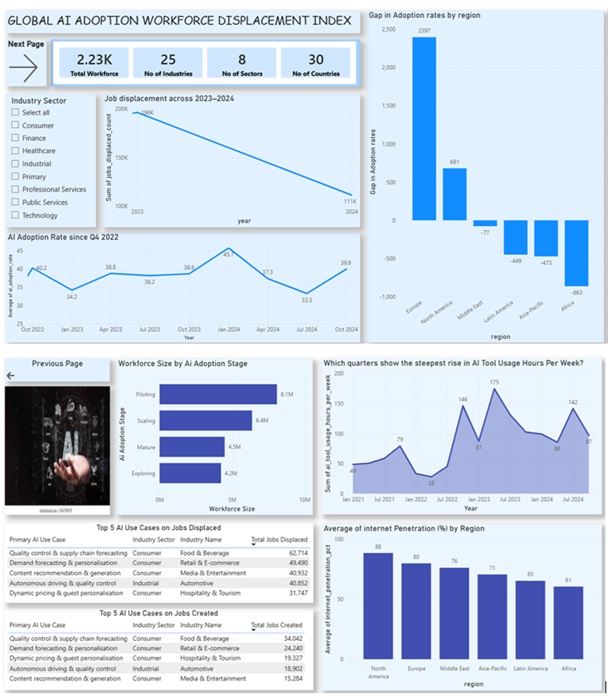
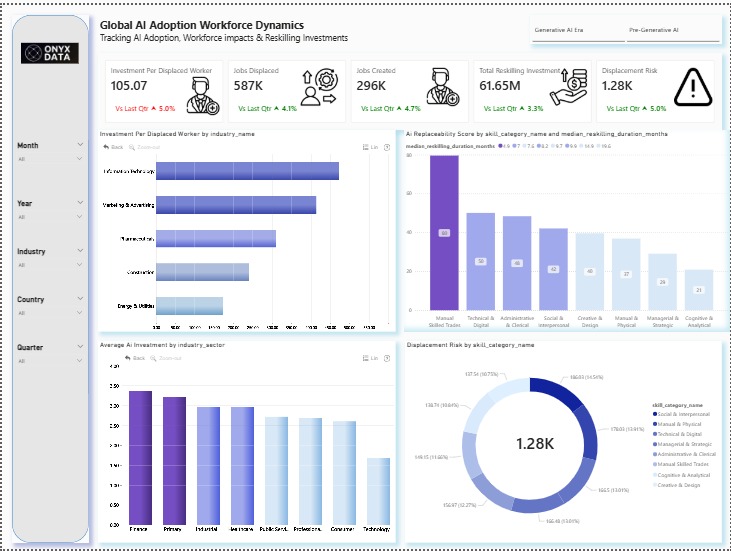
The story explores AI adoption trends, regional and industry comparisons, productivity, job displacement risks, industry vulnerability to automation, and more
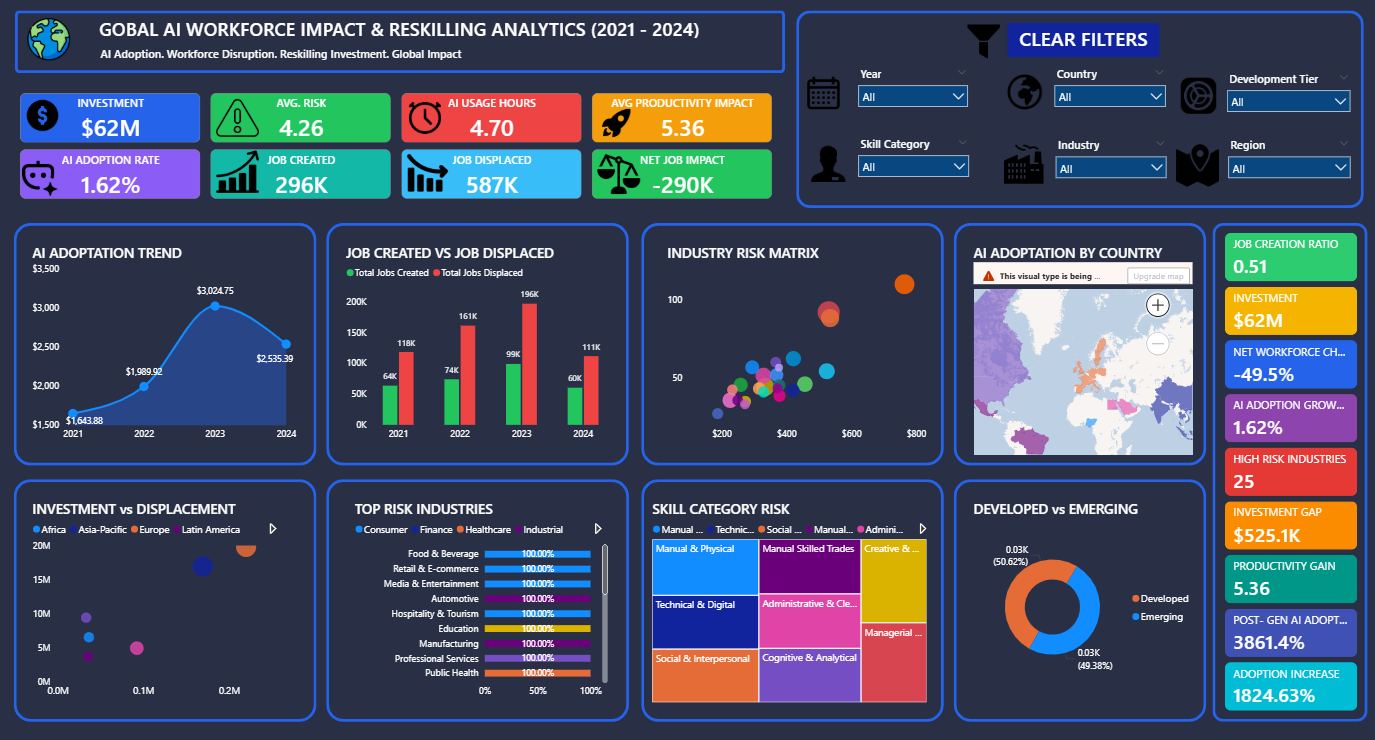
AI Workforce Impact & Reskilling Analytics Dashboard (2021–2024) This interactive Power BI dashboard analyzes the global impact of Artificial Intelligence...
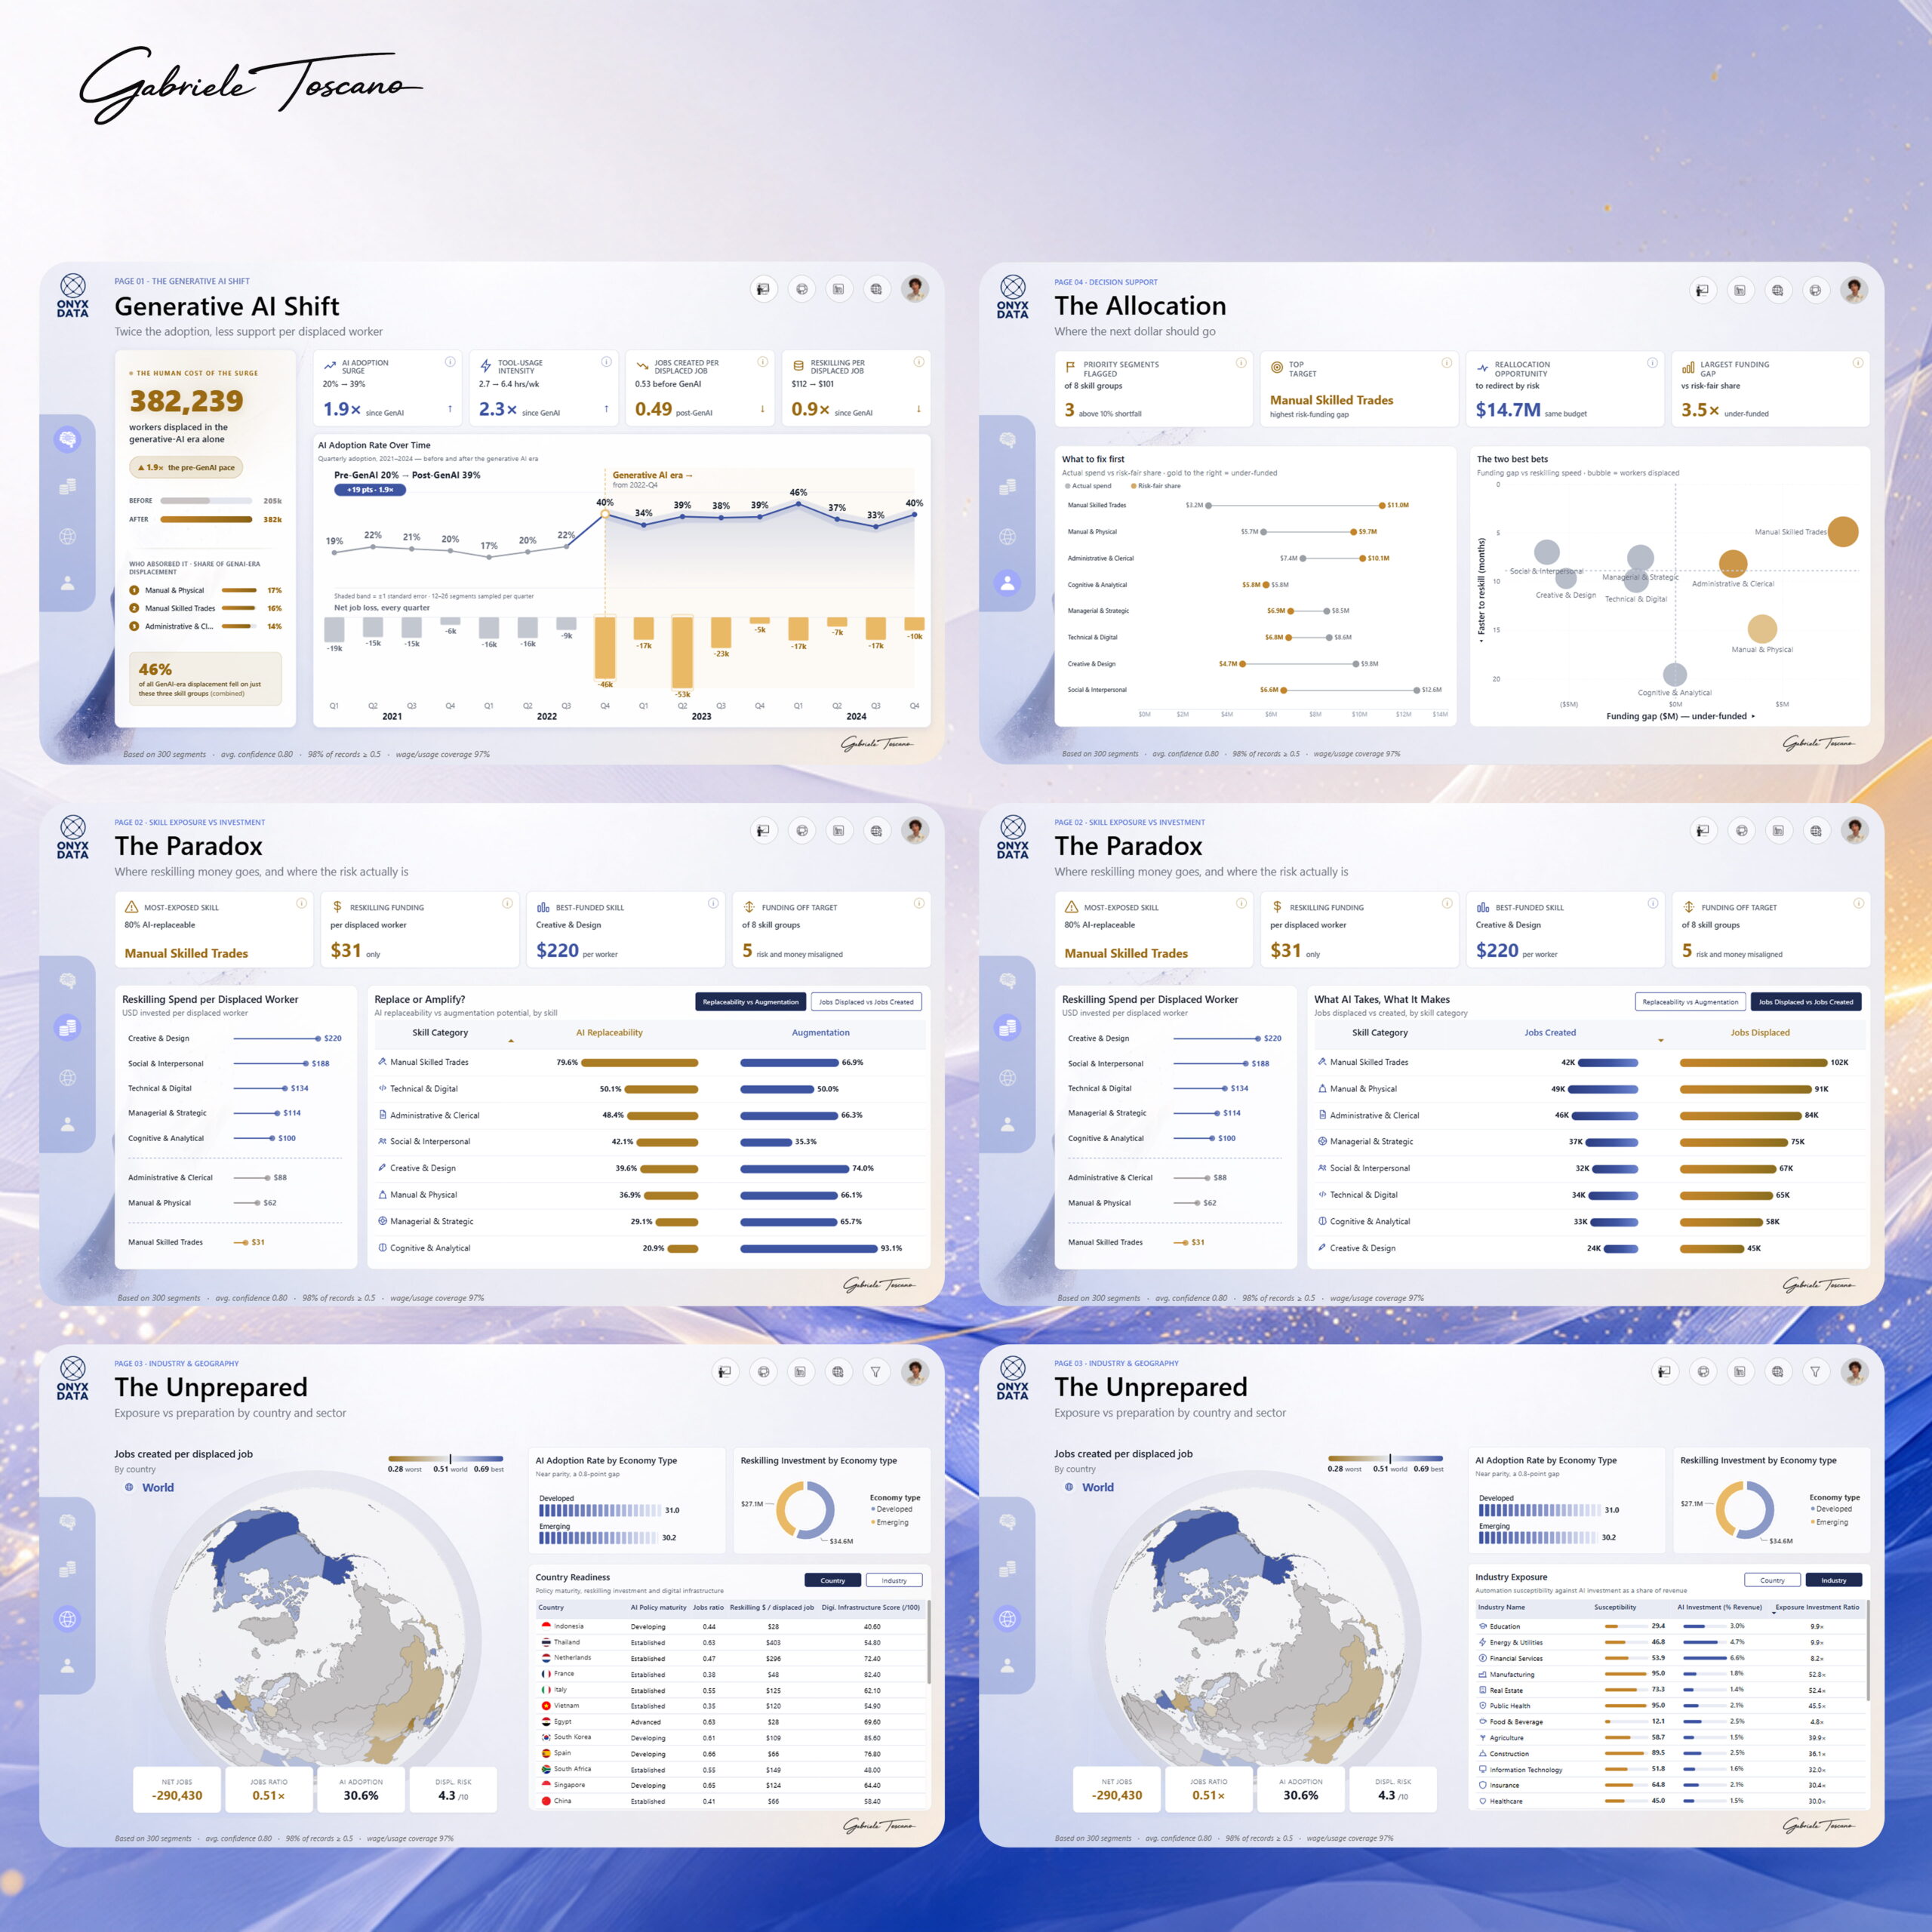
How AI reshaped work from 2021–2024 and why the money meant to protect workers isn’t going where the risk is.
🌍 AI adoption is rising — but workforce resilience isn’t rising at the same pace. For the Onyx Data July...
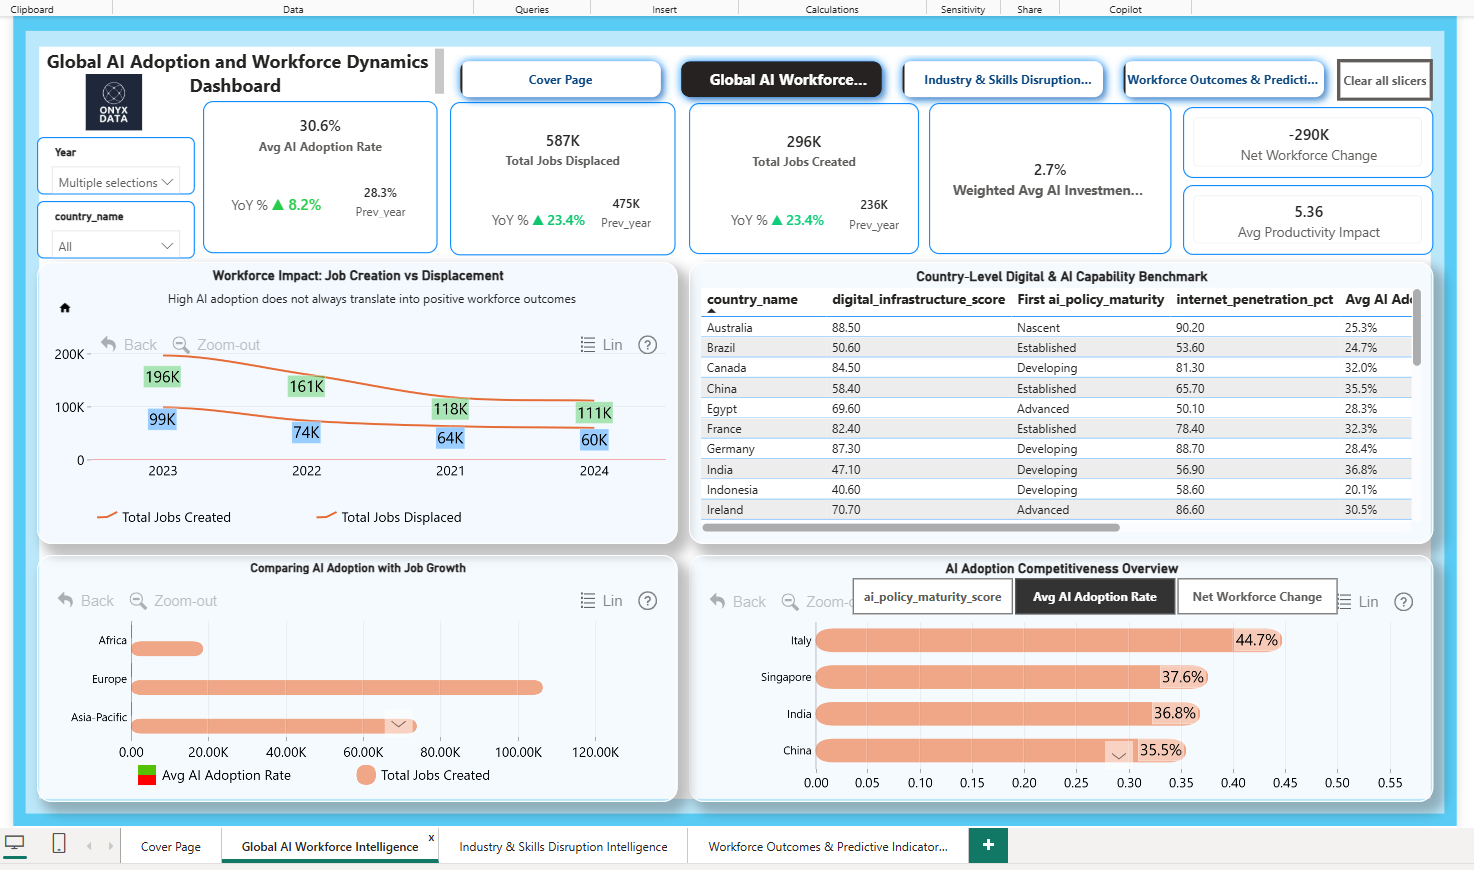
An interactive Power Bi exploring global AI adoption, Workforce transformation, industry trends, AI investment and regional insights to support data...
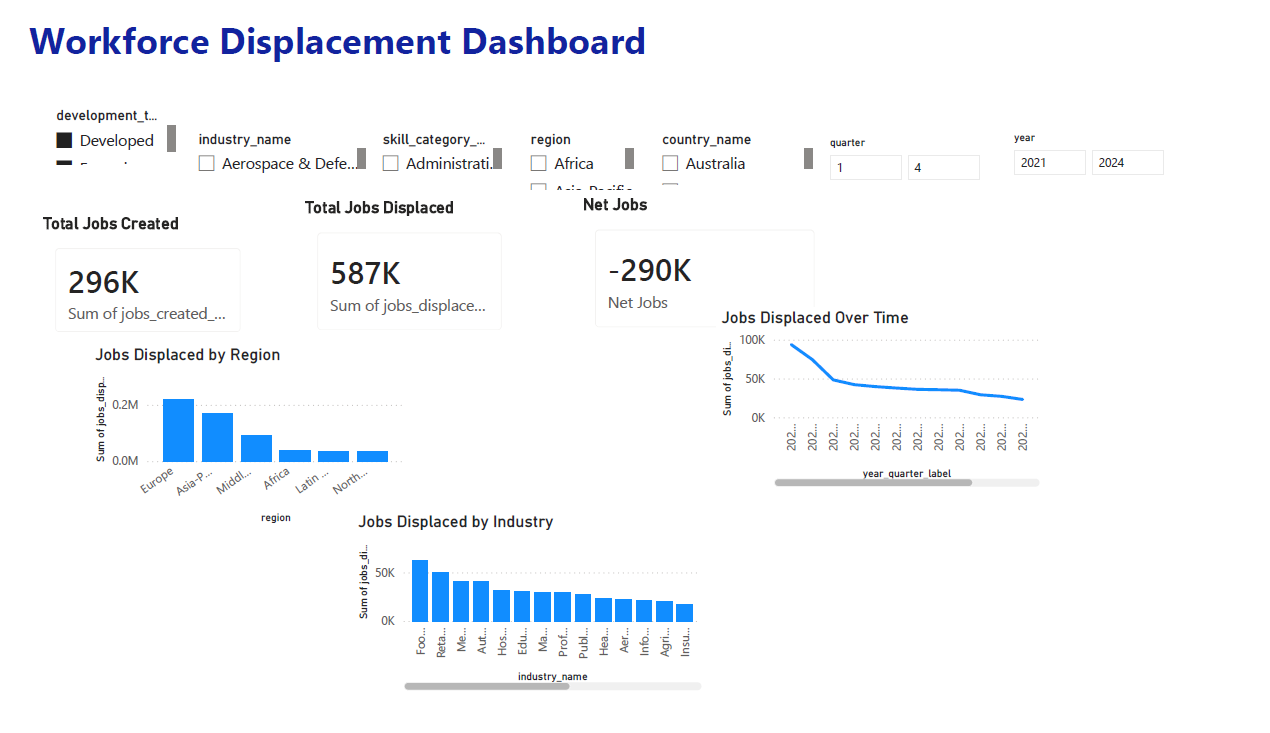
Portfolio Description Developed an interactive Power BI dashboard to analyze global AI adoption trends and their impact on workforce displacement,...
Discover the latest AI & Data challenges


Contact our team

16 Upper Woburn Place, London, Greater London, WC1H 0AF, United Kingdom