Join a community of the most creative Business Intelligence Professionals
Join a community of the most creative Business Intelligence Professionals
View the DataDNA Data Visualisation portfolios below
Browse AI-reviewed portfolios from our global community of data professionals

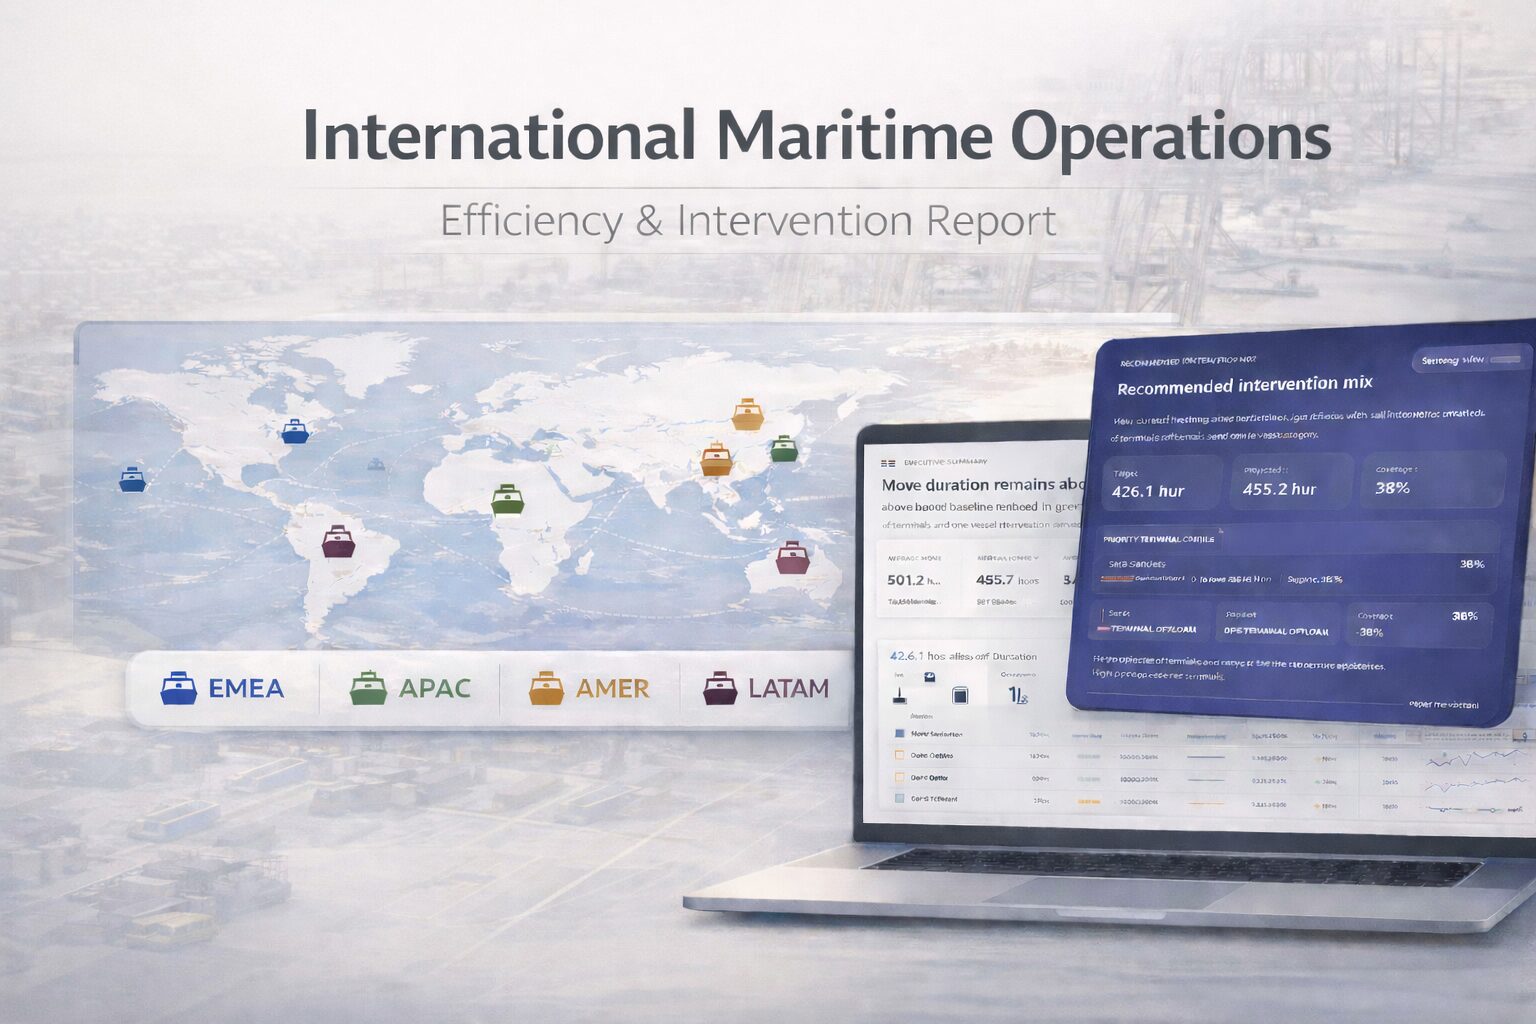
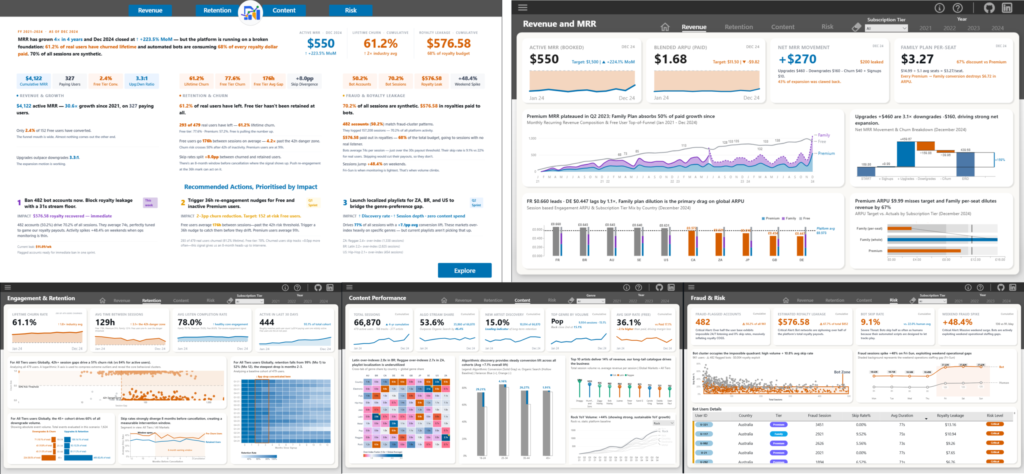
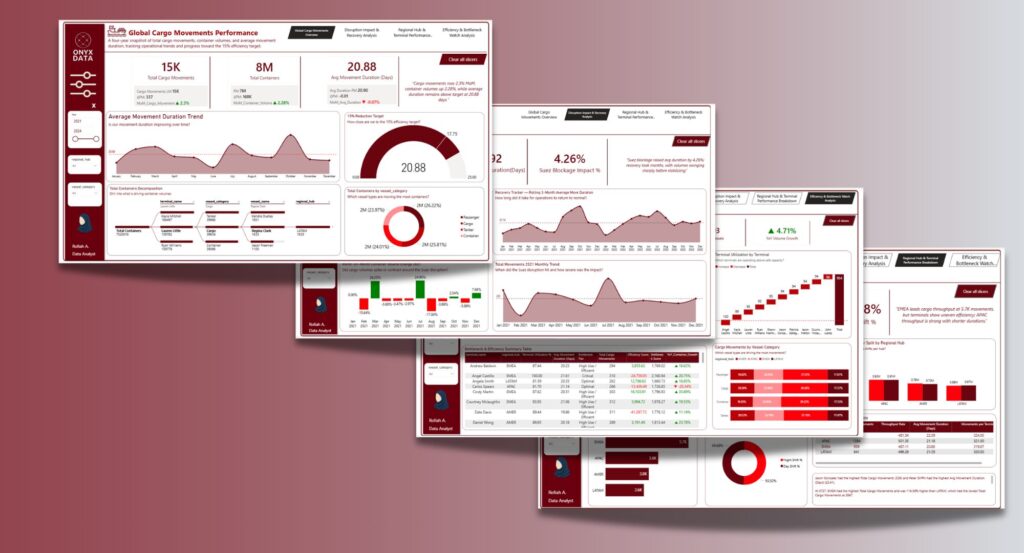
This report provides a strategic view of global terminal performance, operational efficiency, and network-wide intervention opportunities. Navigate through regional insights...
The 2021 Suez Canal blockage exposed critical vulnerabilities across global maritime logistics. With terminals operating above optimal capacity and cargo...
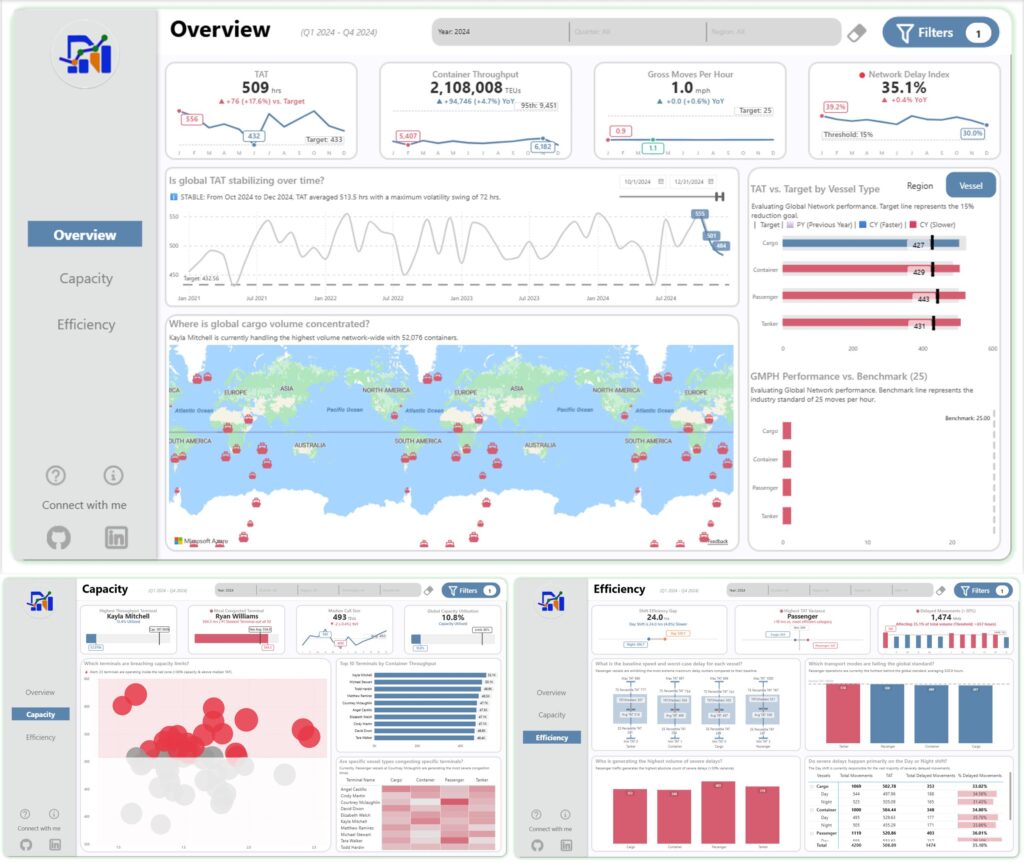
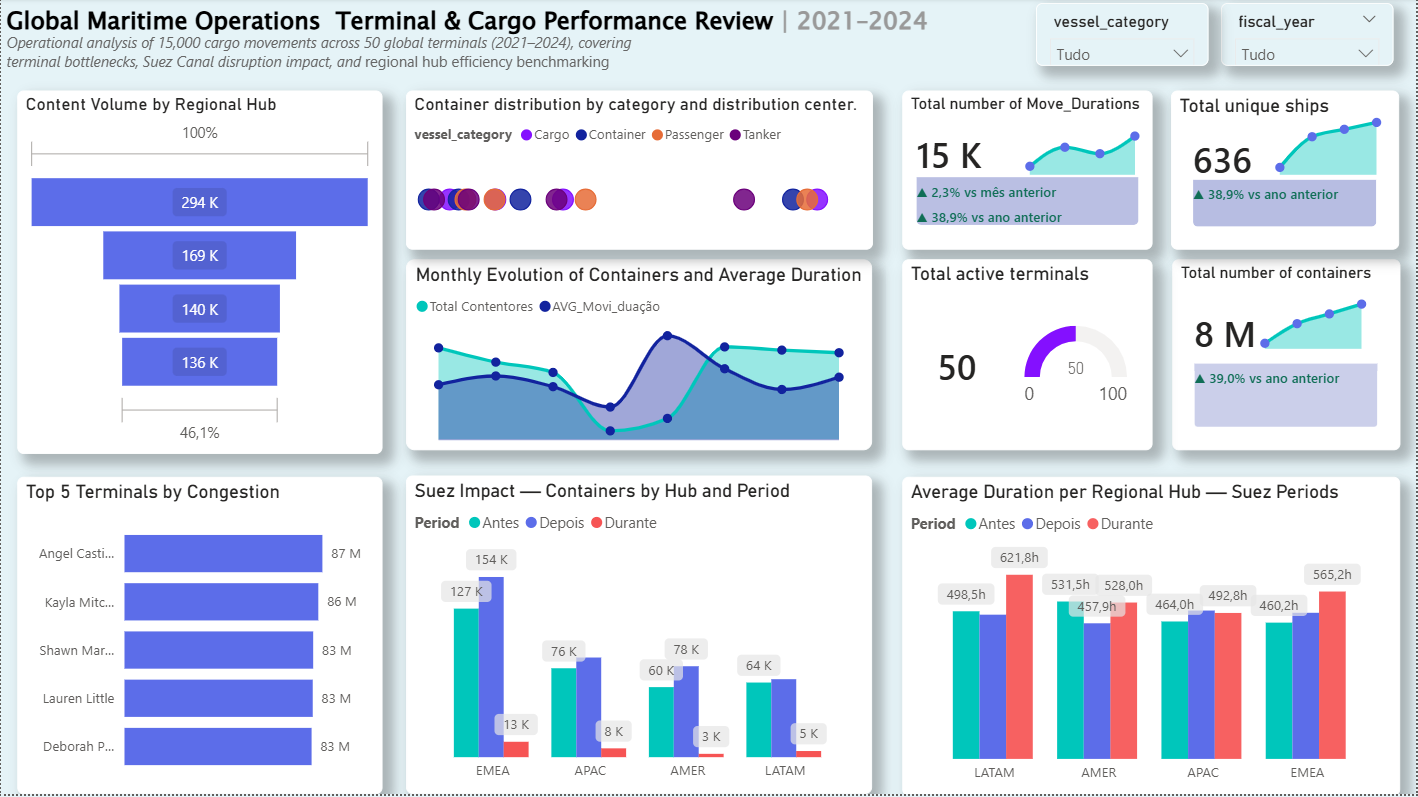
This project delivers an interactive Power BI dashboard that analyzes maritime logistics performance across vessel categories, terminals, and time periods....
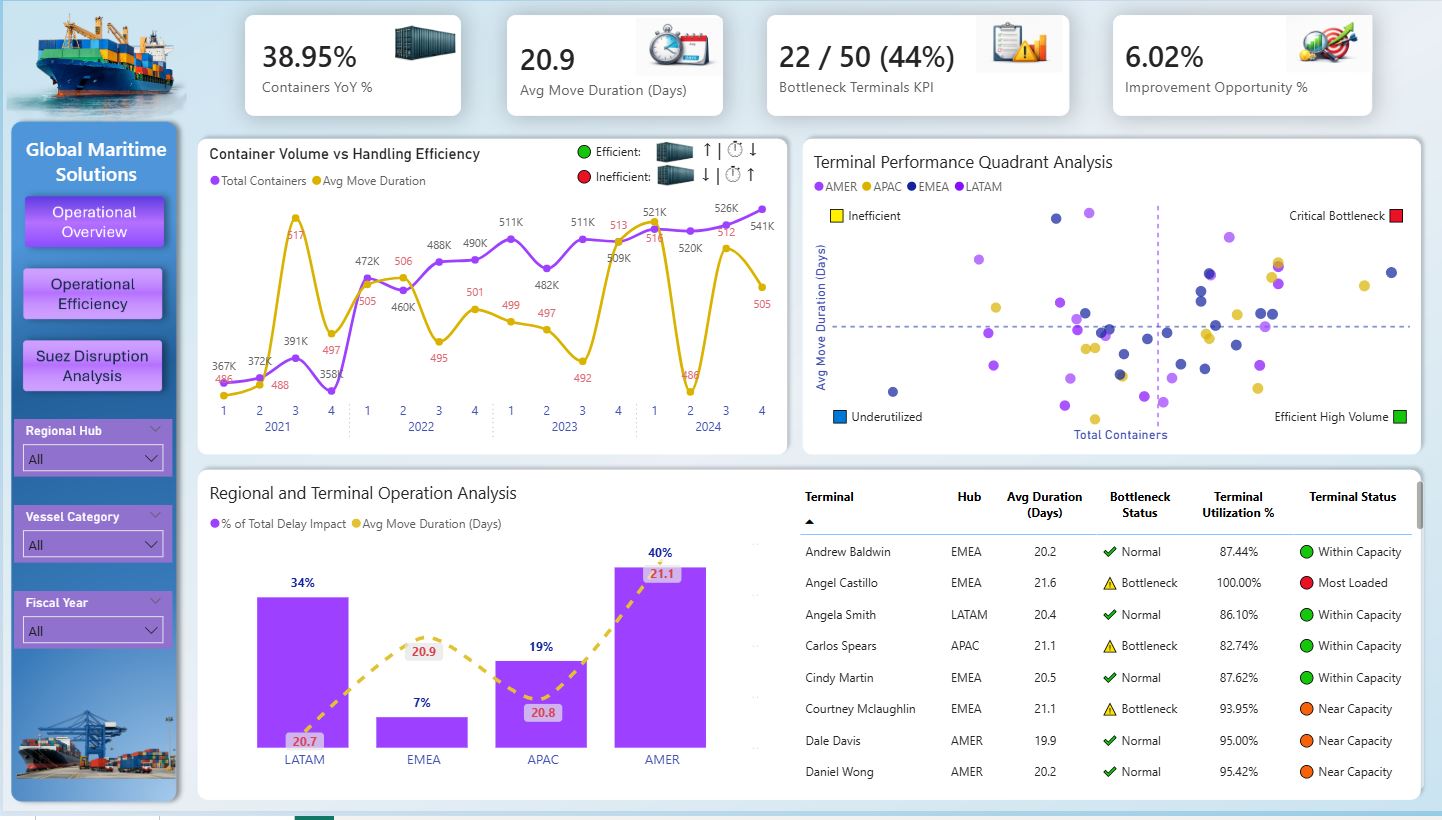
Power BI dashboard built around maritime logistics performance and disruption analysis. This project focuses on uncovering inefficiencies and understanding how...
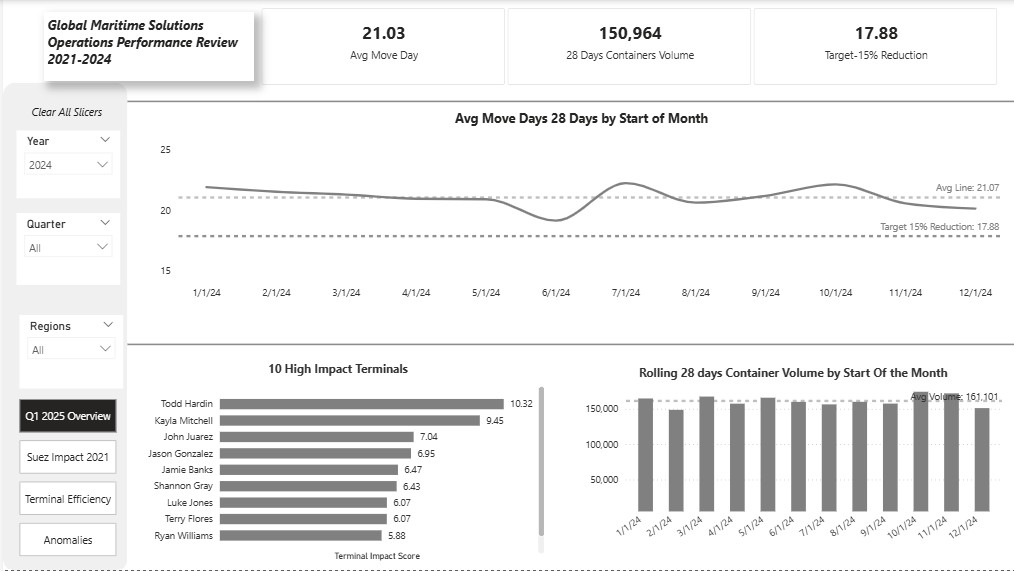
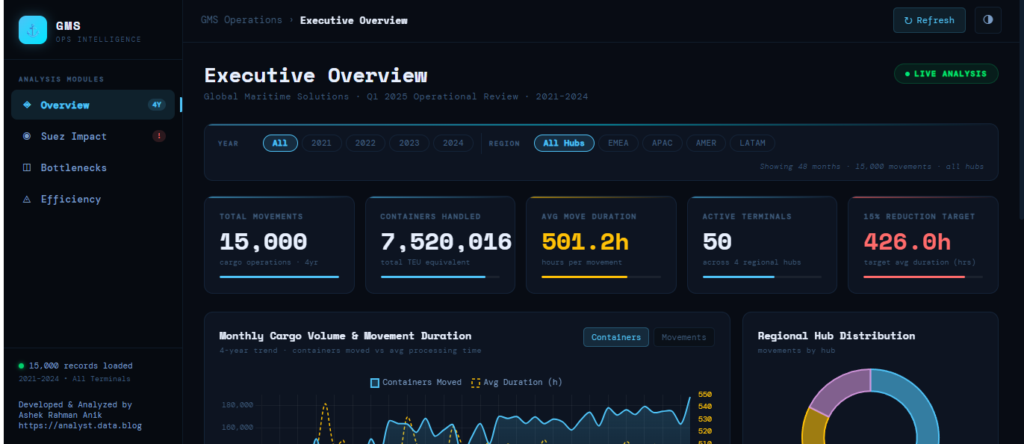
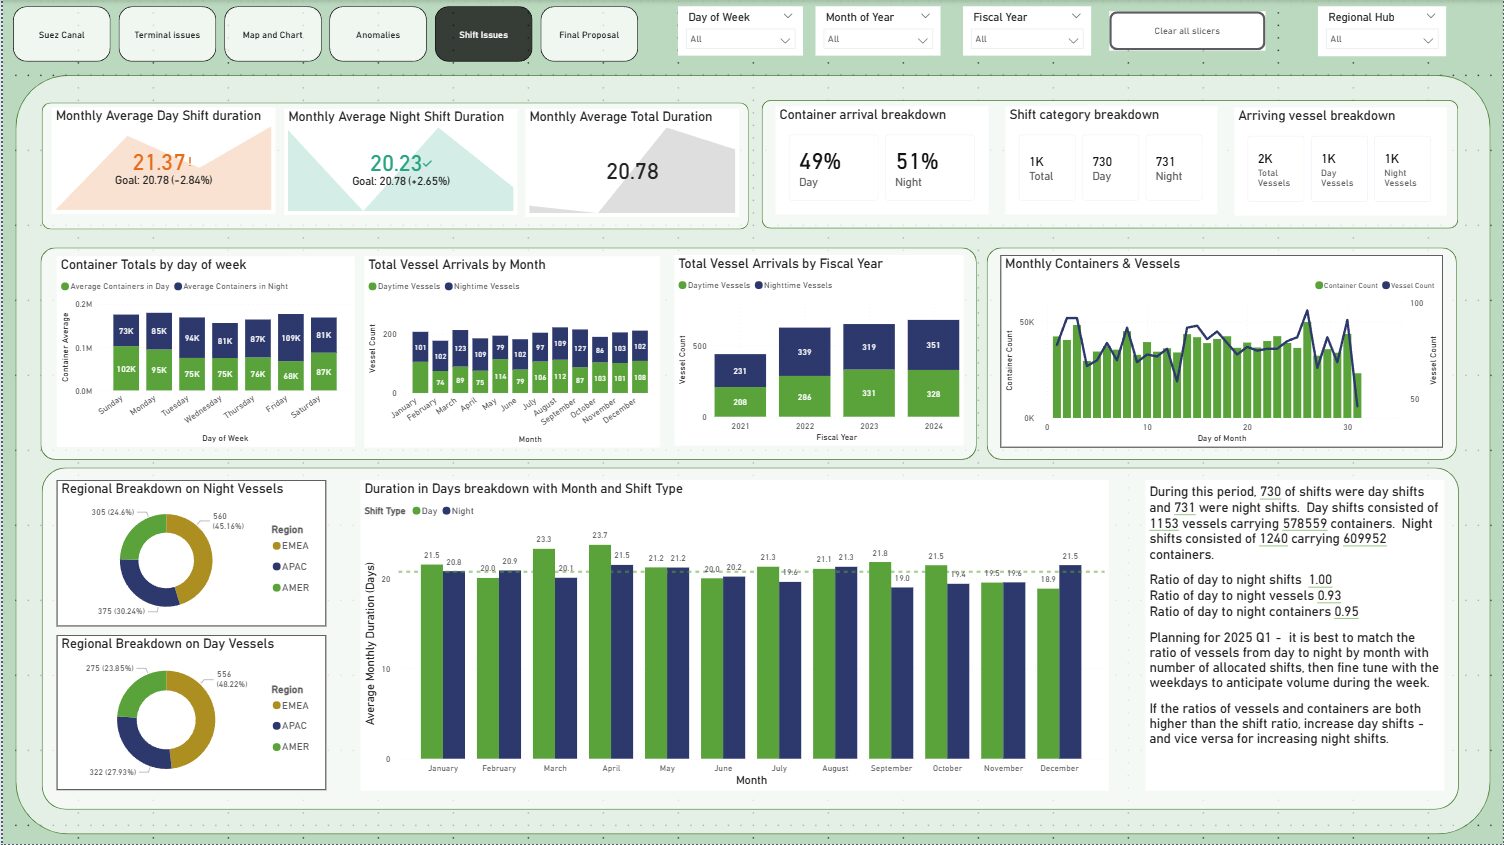
Page 1 Q1 2025 overview: It shows overall view of operations across years from 2021-2024 based on selected slicer period...

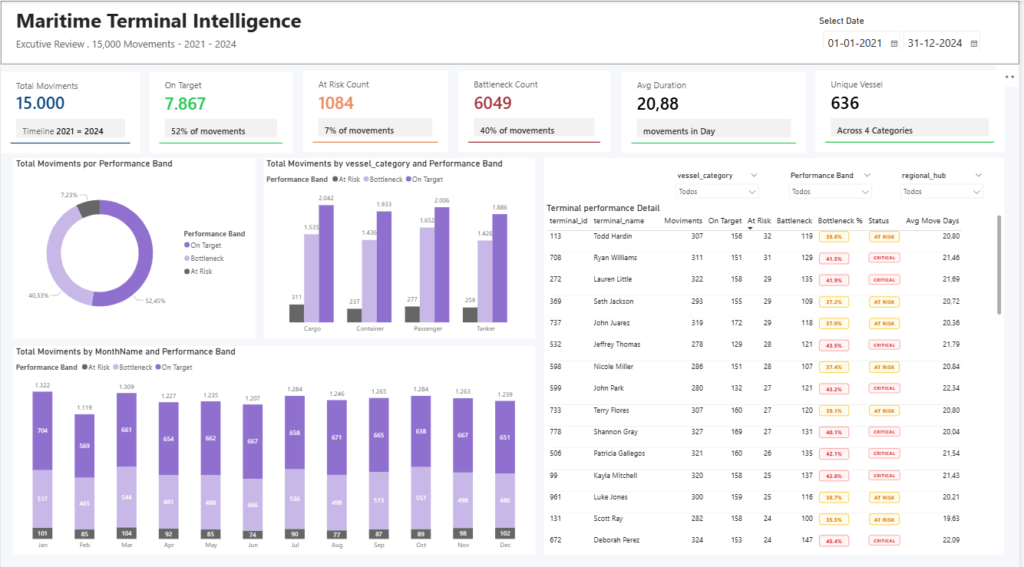
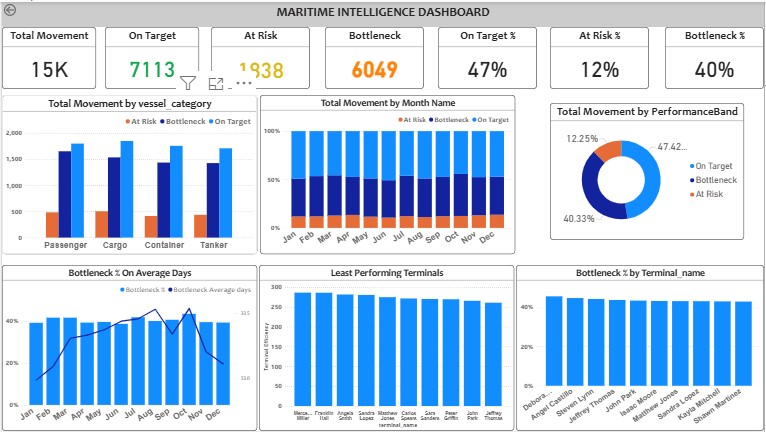
The Maritime Terminal Intelligence dashboard provides a clear overview of terminal operations, analyzing 15,000 movements from 2021 to 2024. It...
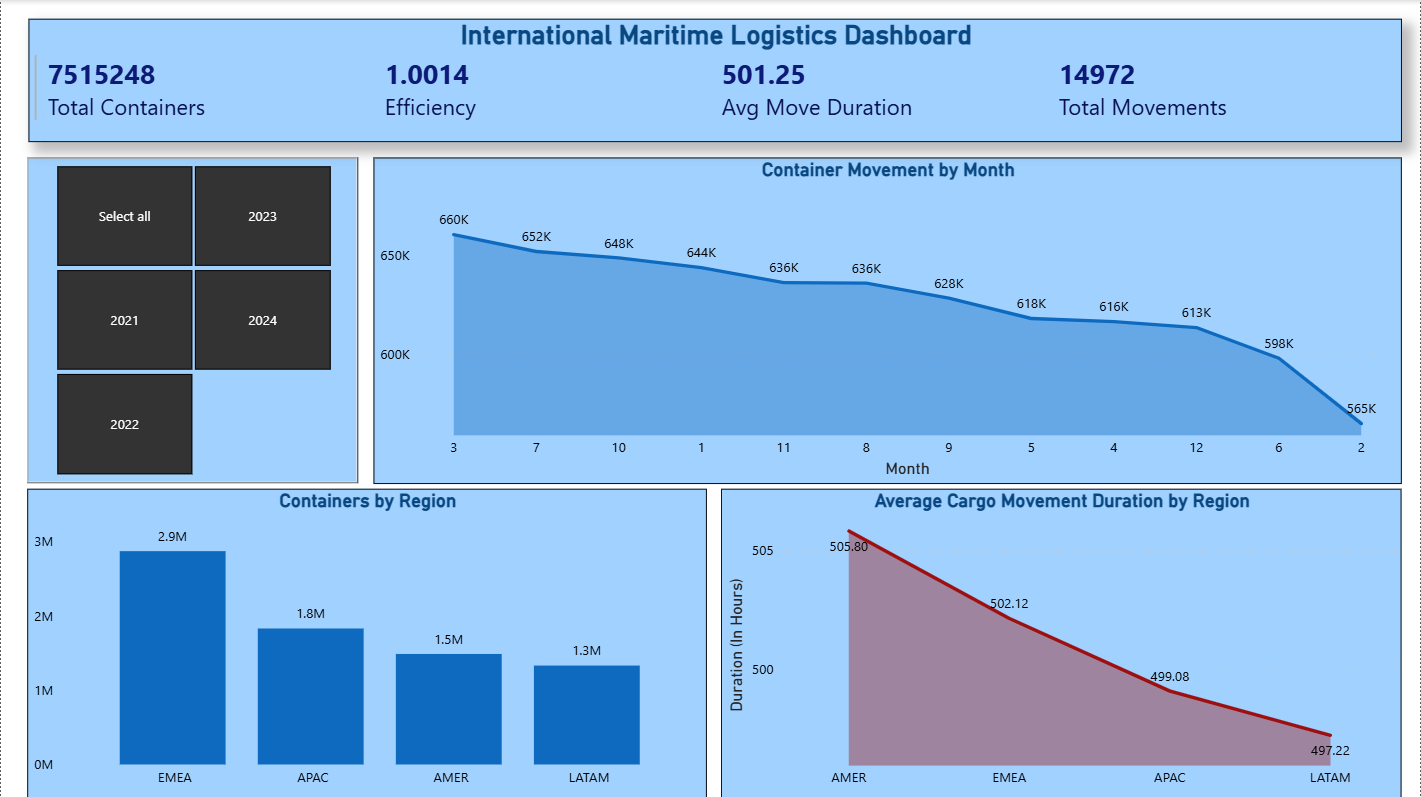
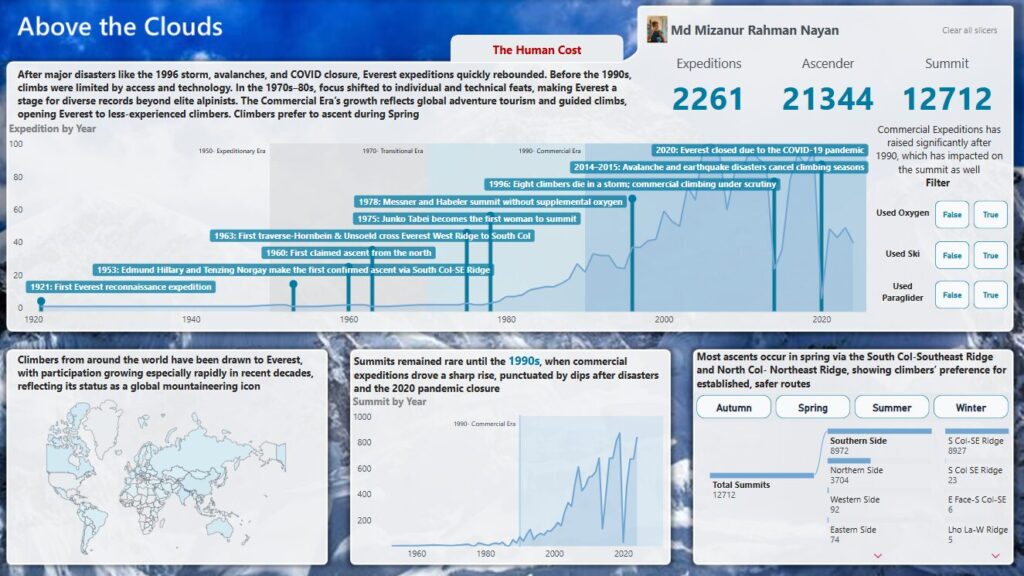
🚢 What makes a maritime terminal truly efficient? I recently explored this question through the Data DNA Challenge by Onyx...
Discover the latest AI & Data challenges


Contact our team

16 Upper Woburn Place, London, Greater London, WC1H 0AF, United Kingdom