Join a community of the most creative Business Intelligence Professionals
Join a community of the most creative Business Intelligence Professionals
View the DataDNA Data Visualisation portfolios below
Browse AI-reviewed portfolios from our global community of data professionals
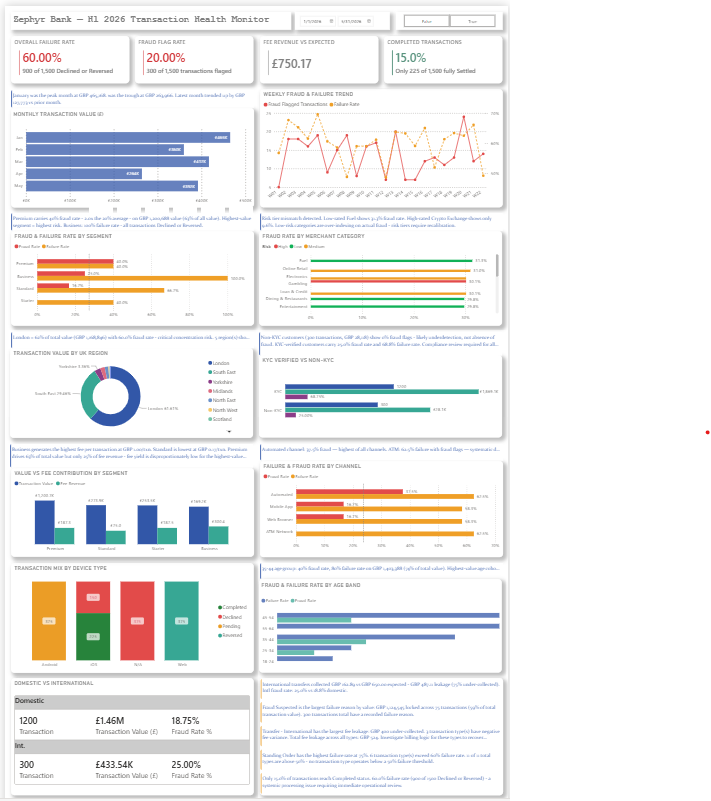
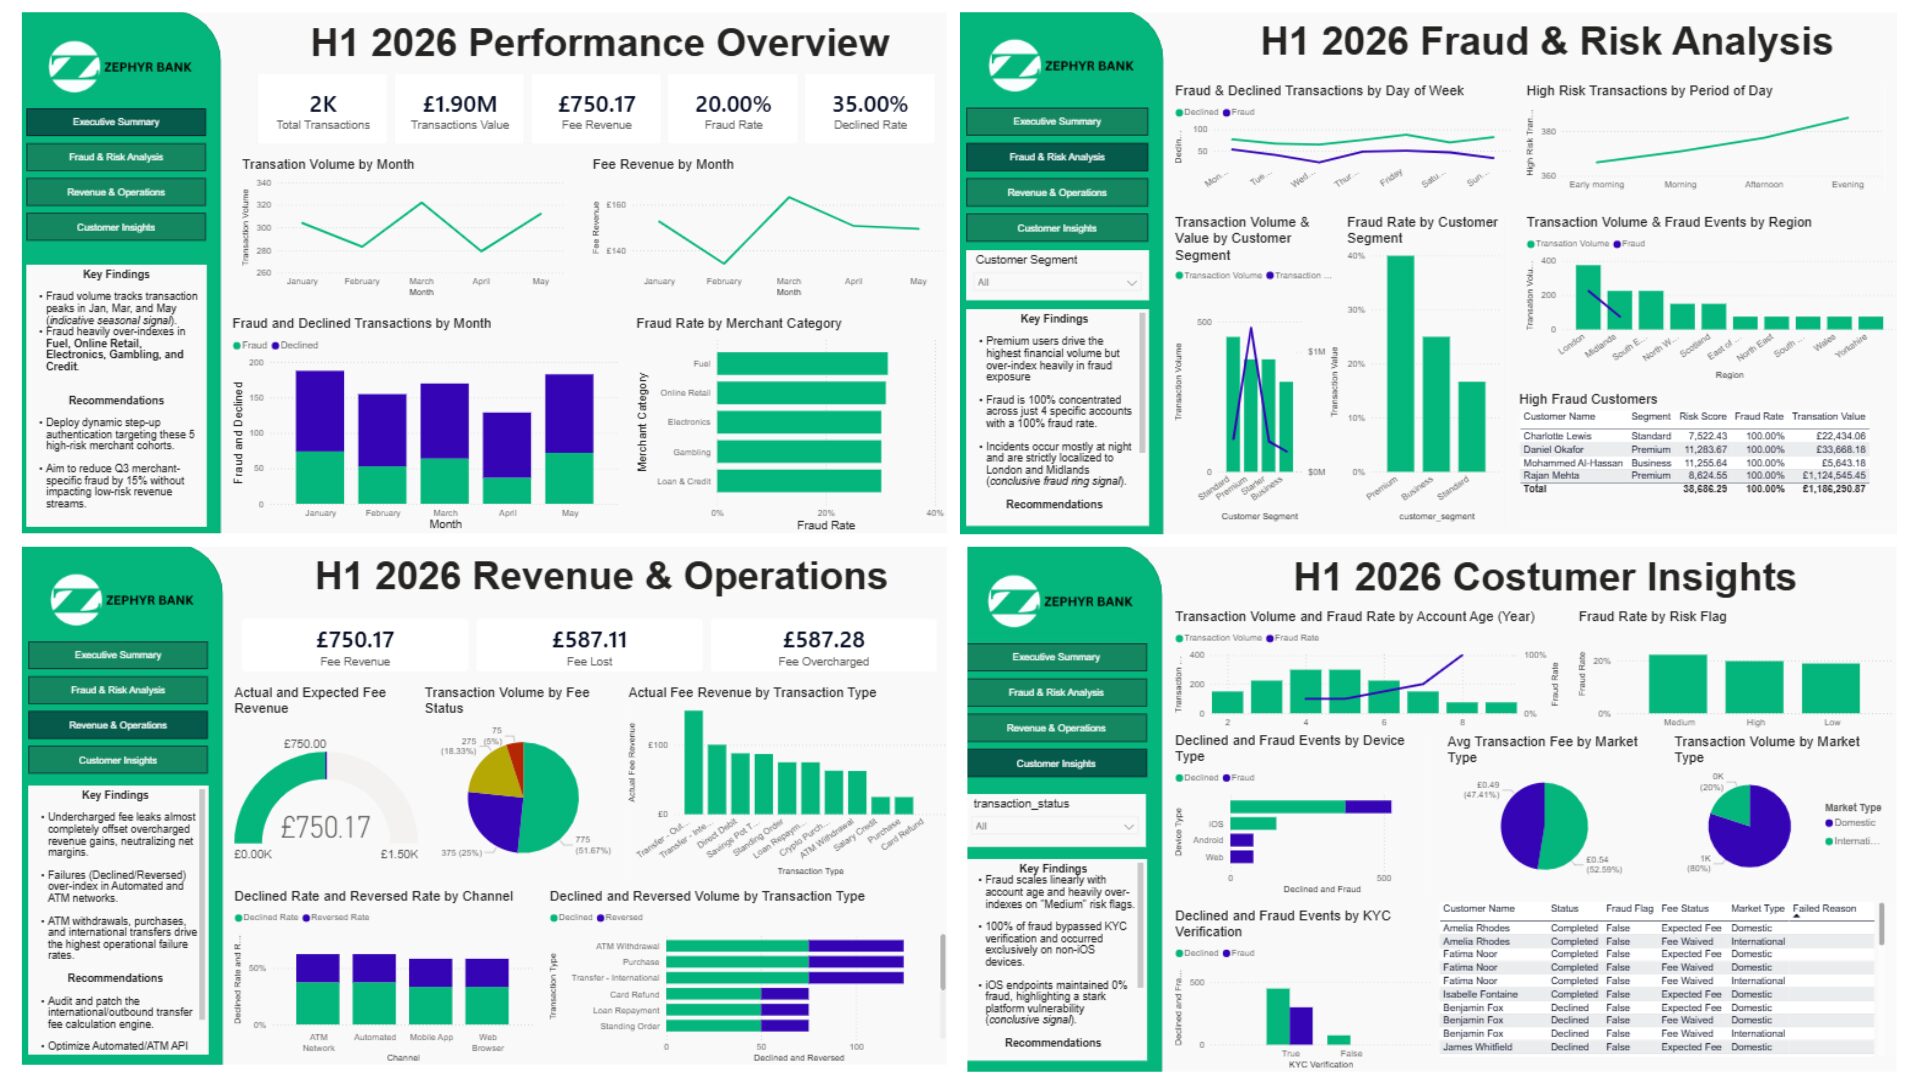
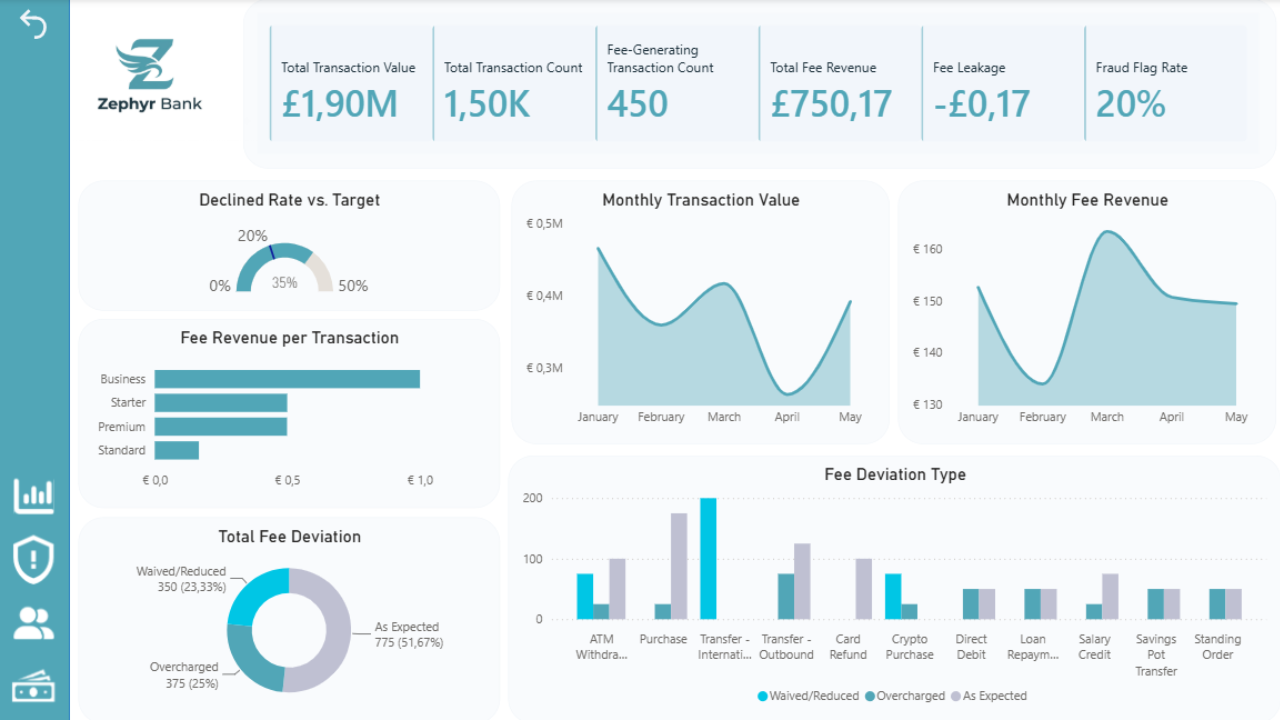
A Power BI analysis of Zephyr Bank’s H1 2026 transaction data. I uncovered a 15% completion rate, £400 fee leakage,...
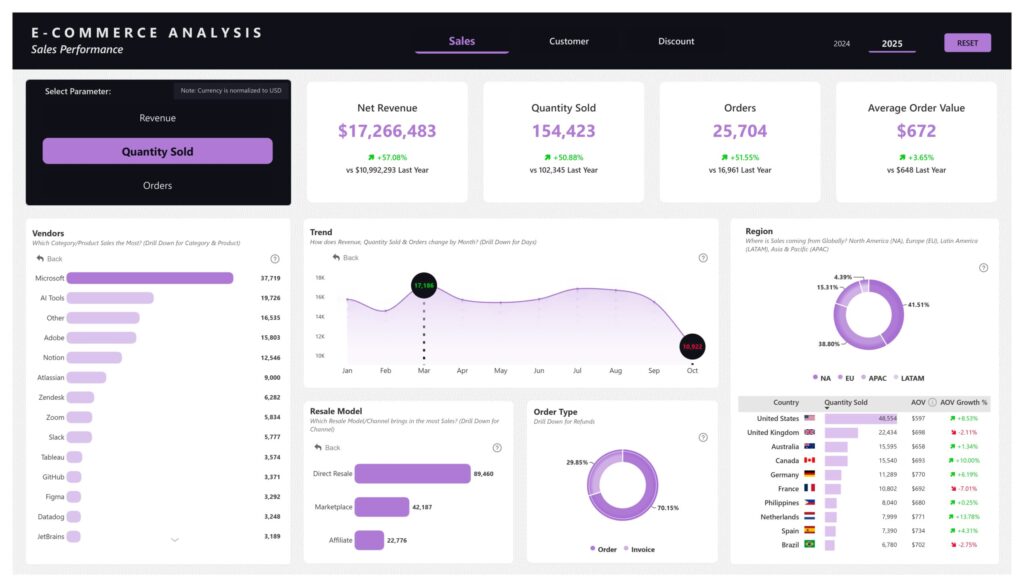
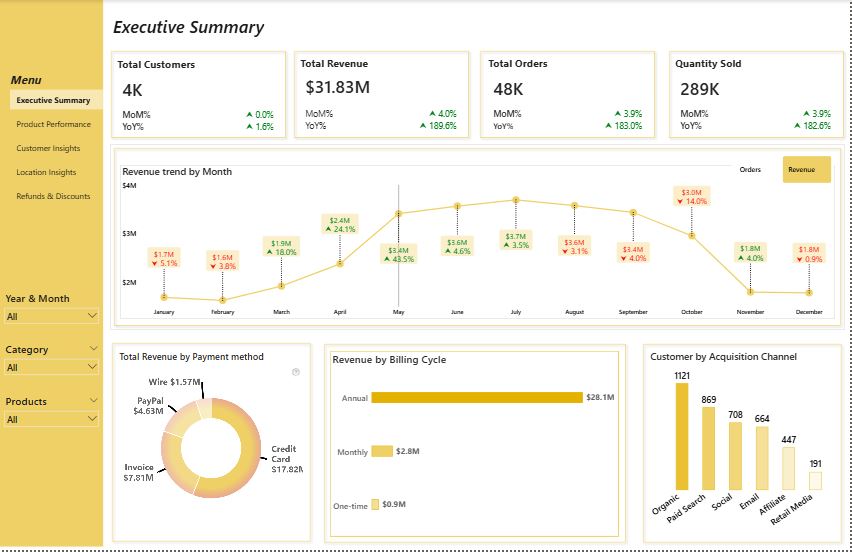
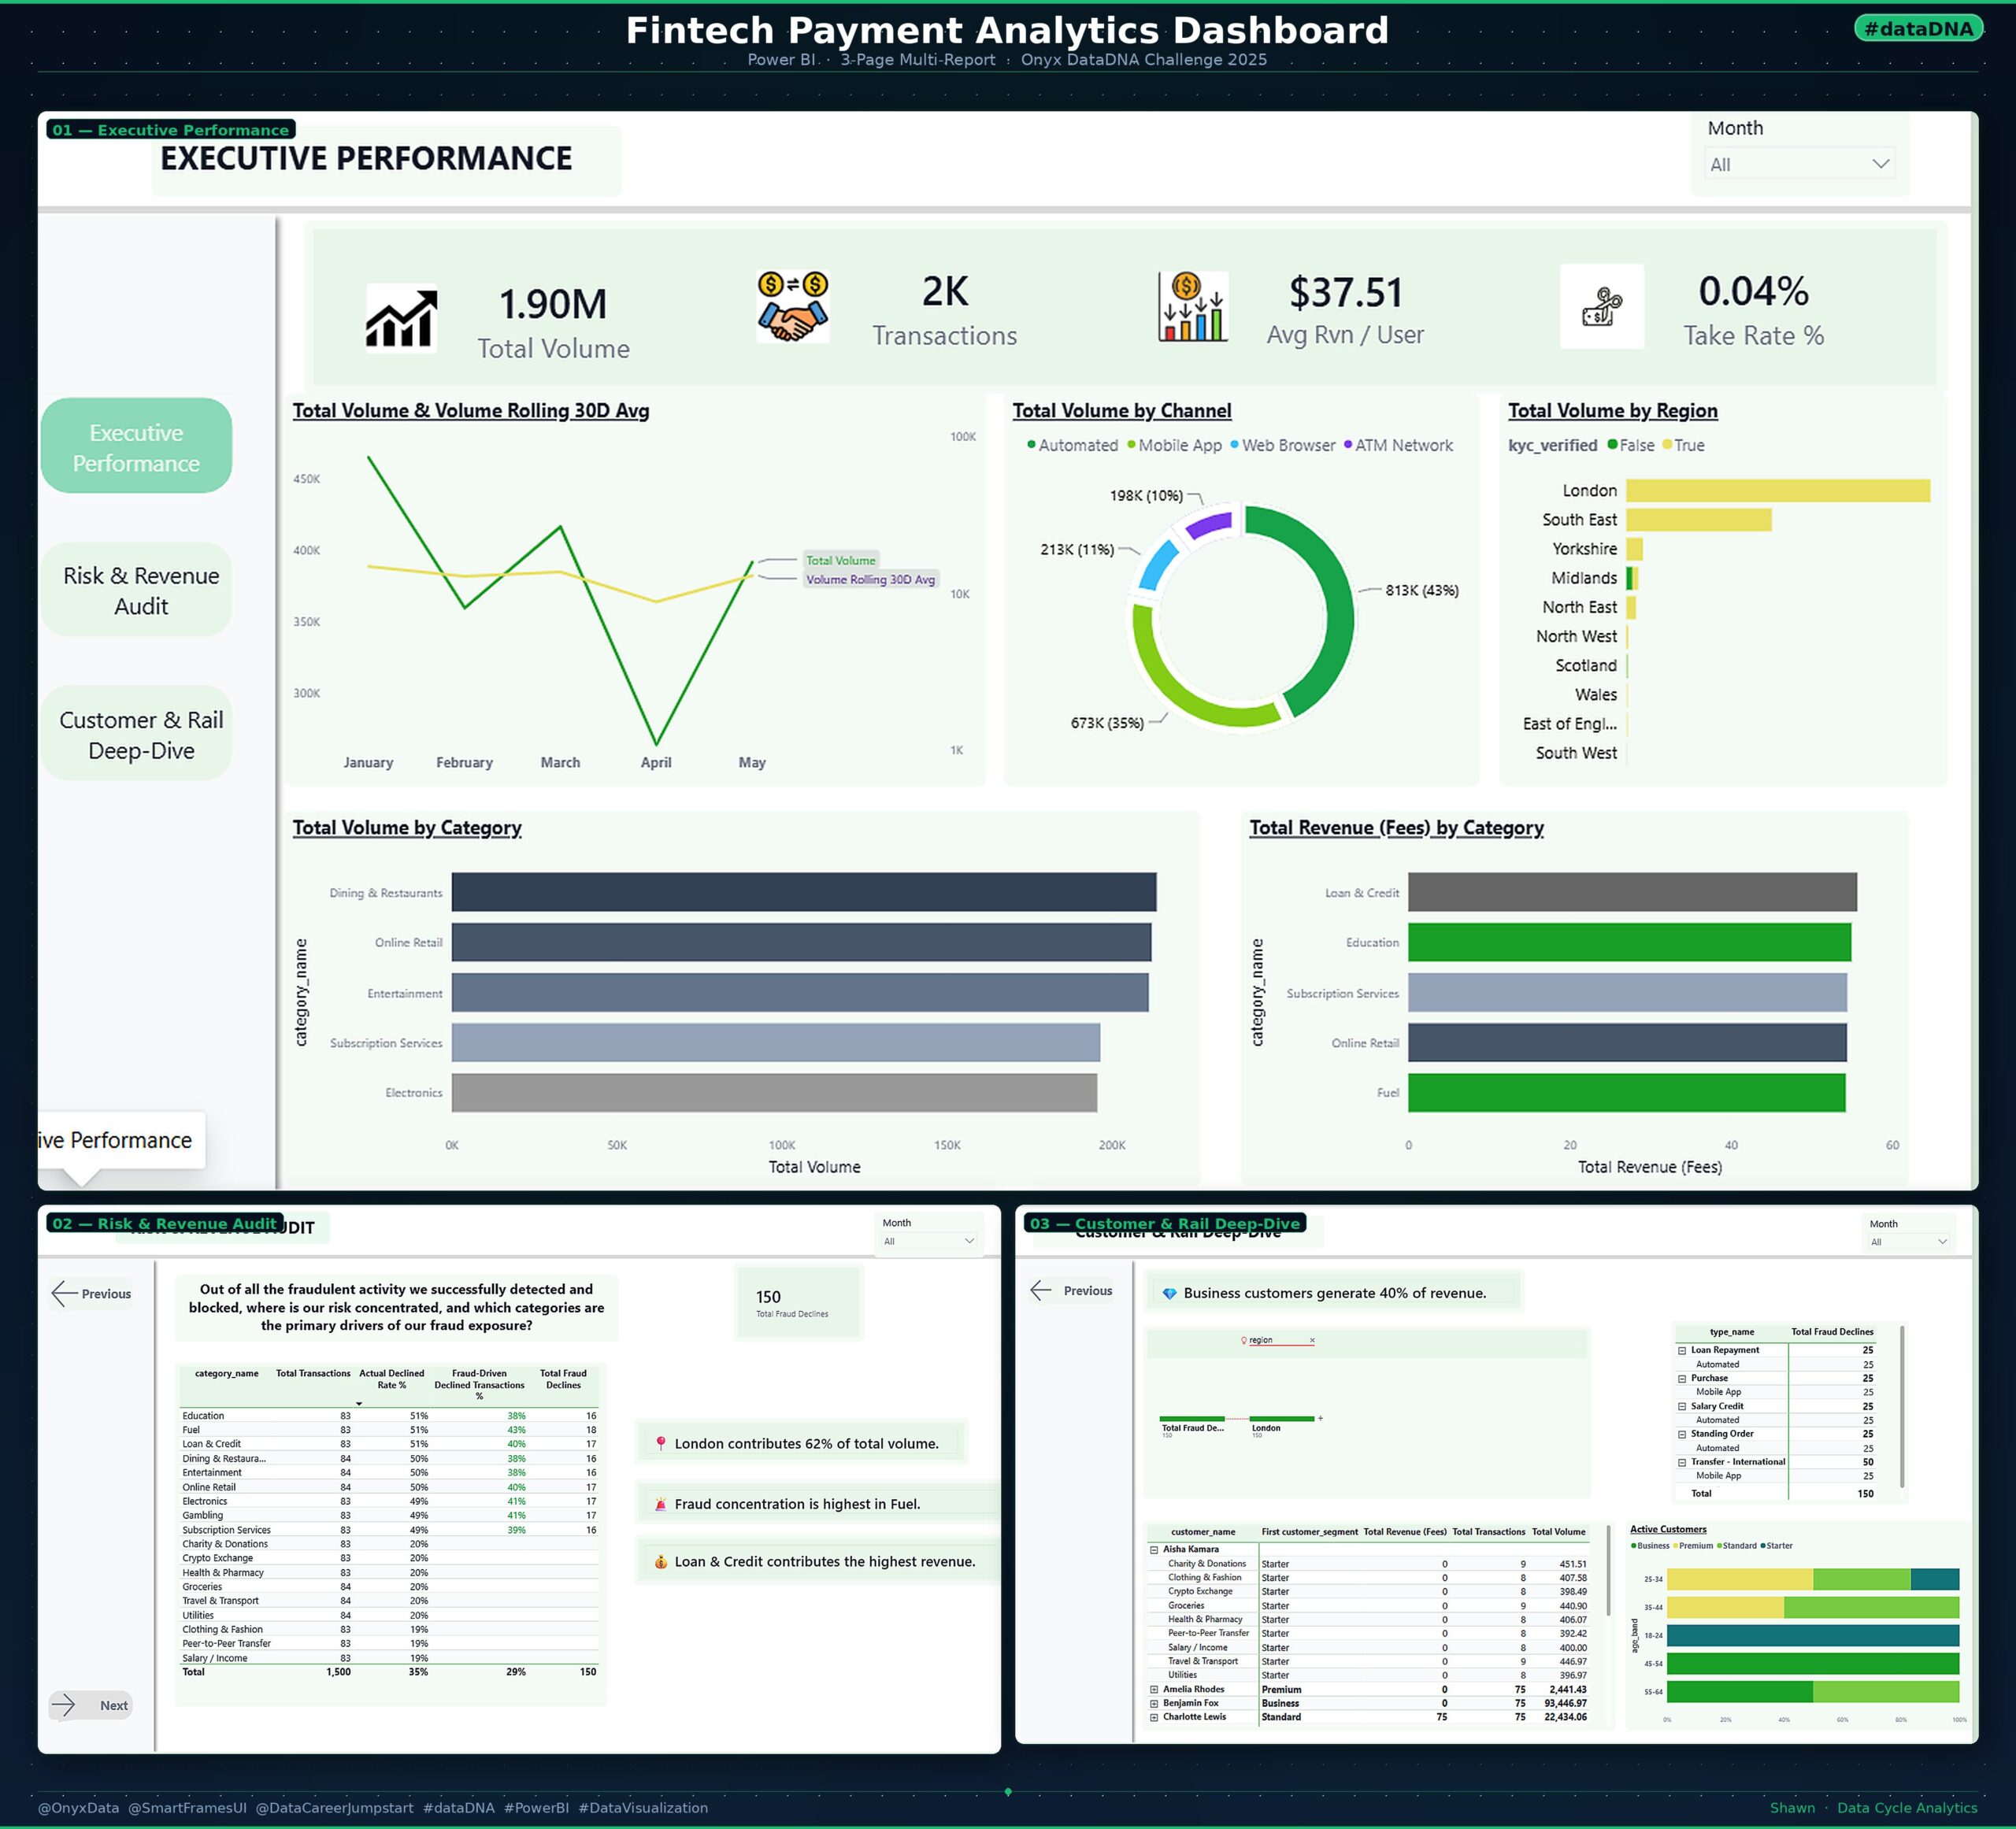
This dashboard was developed as part of the dataDNA Challenge using Power BI. The objective was to analyze transaction, customer,...
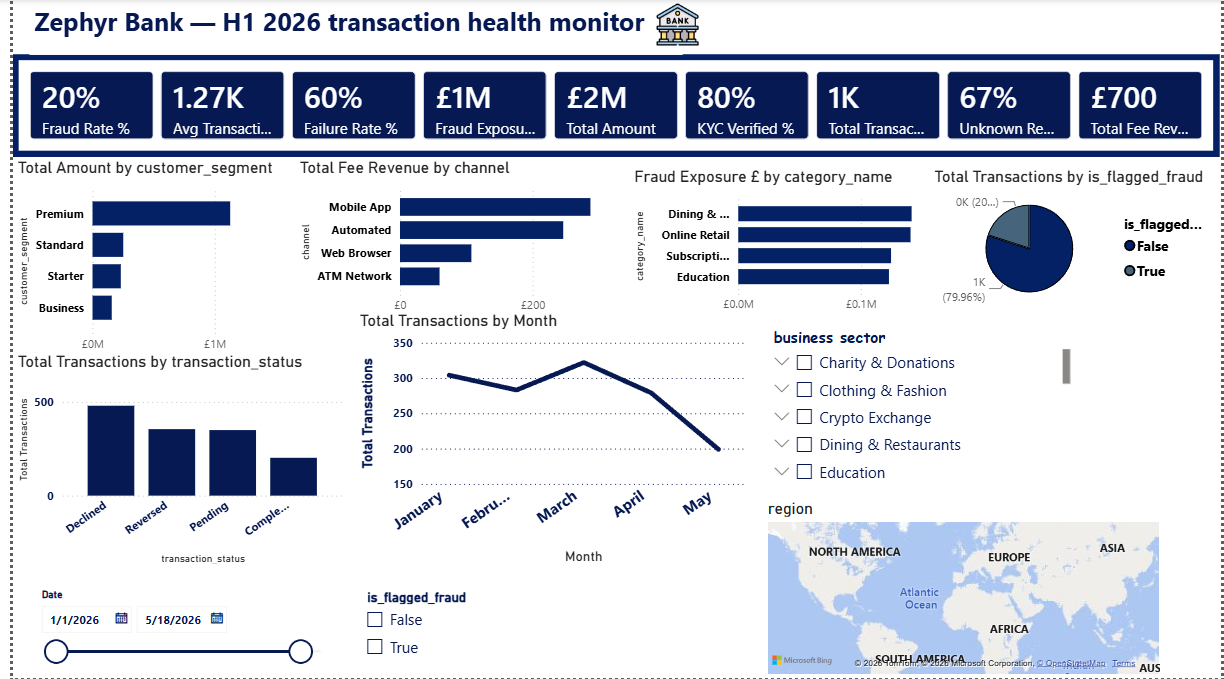
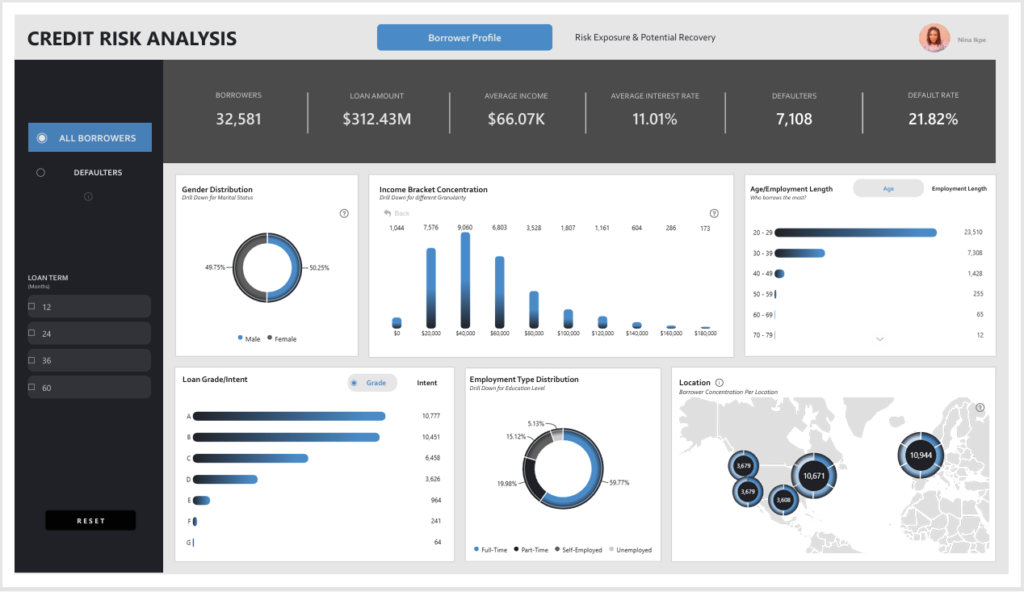
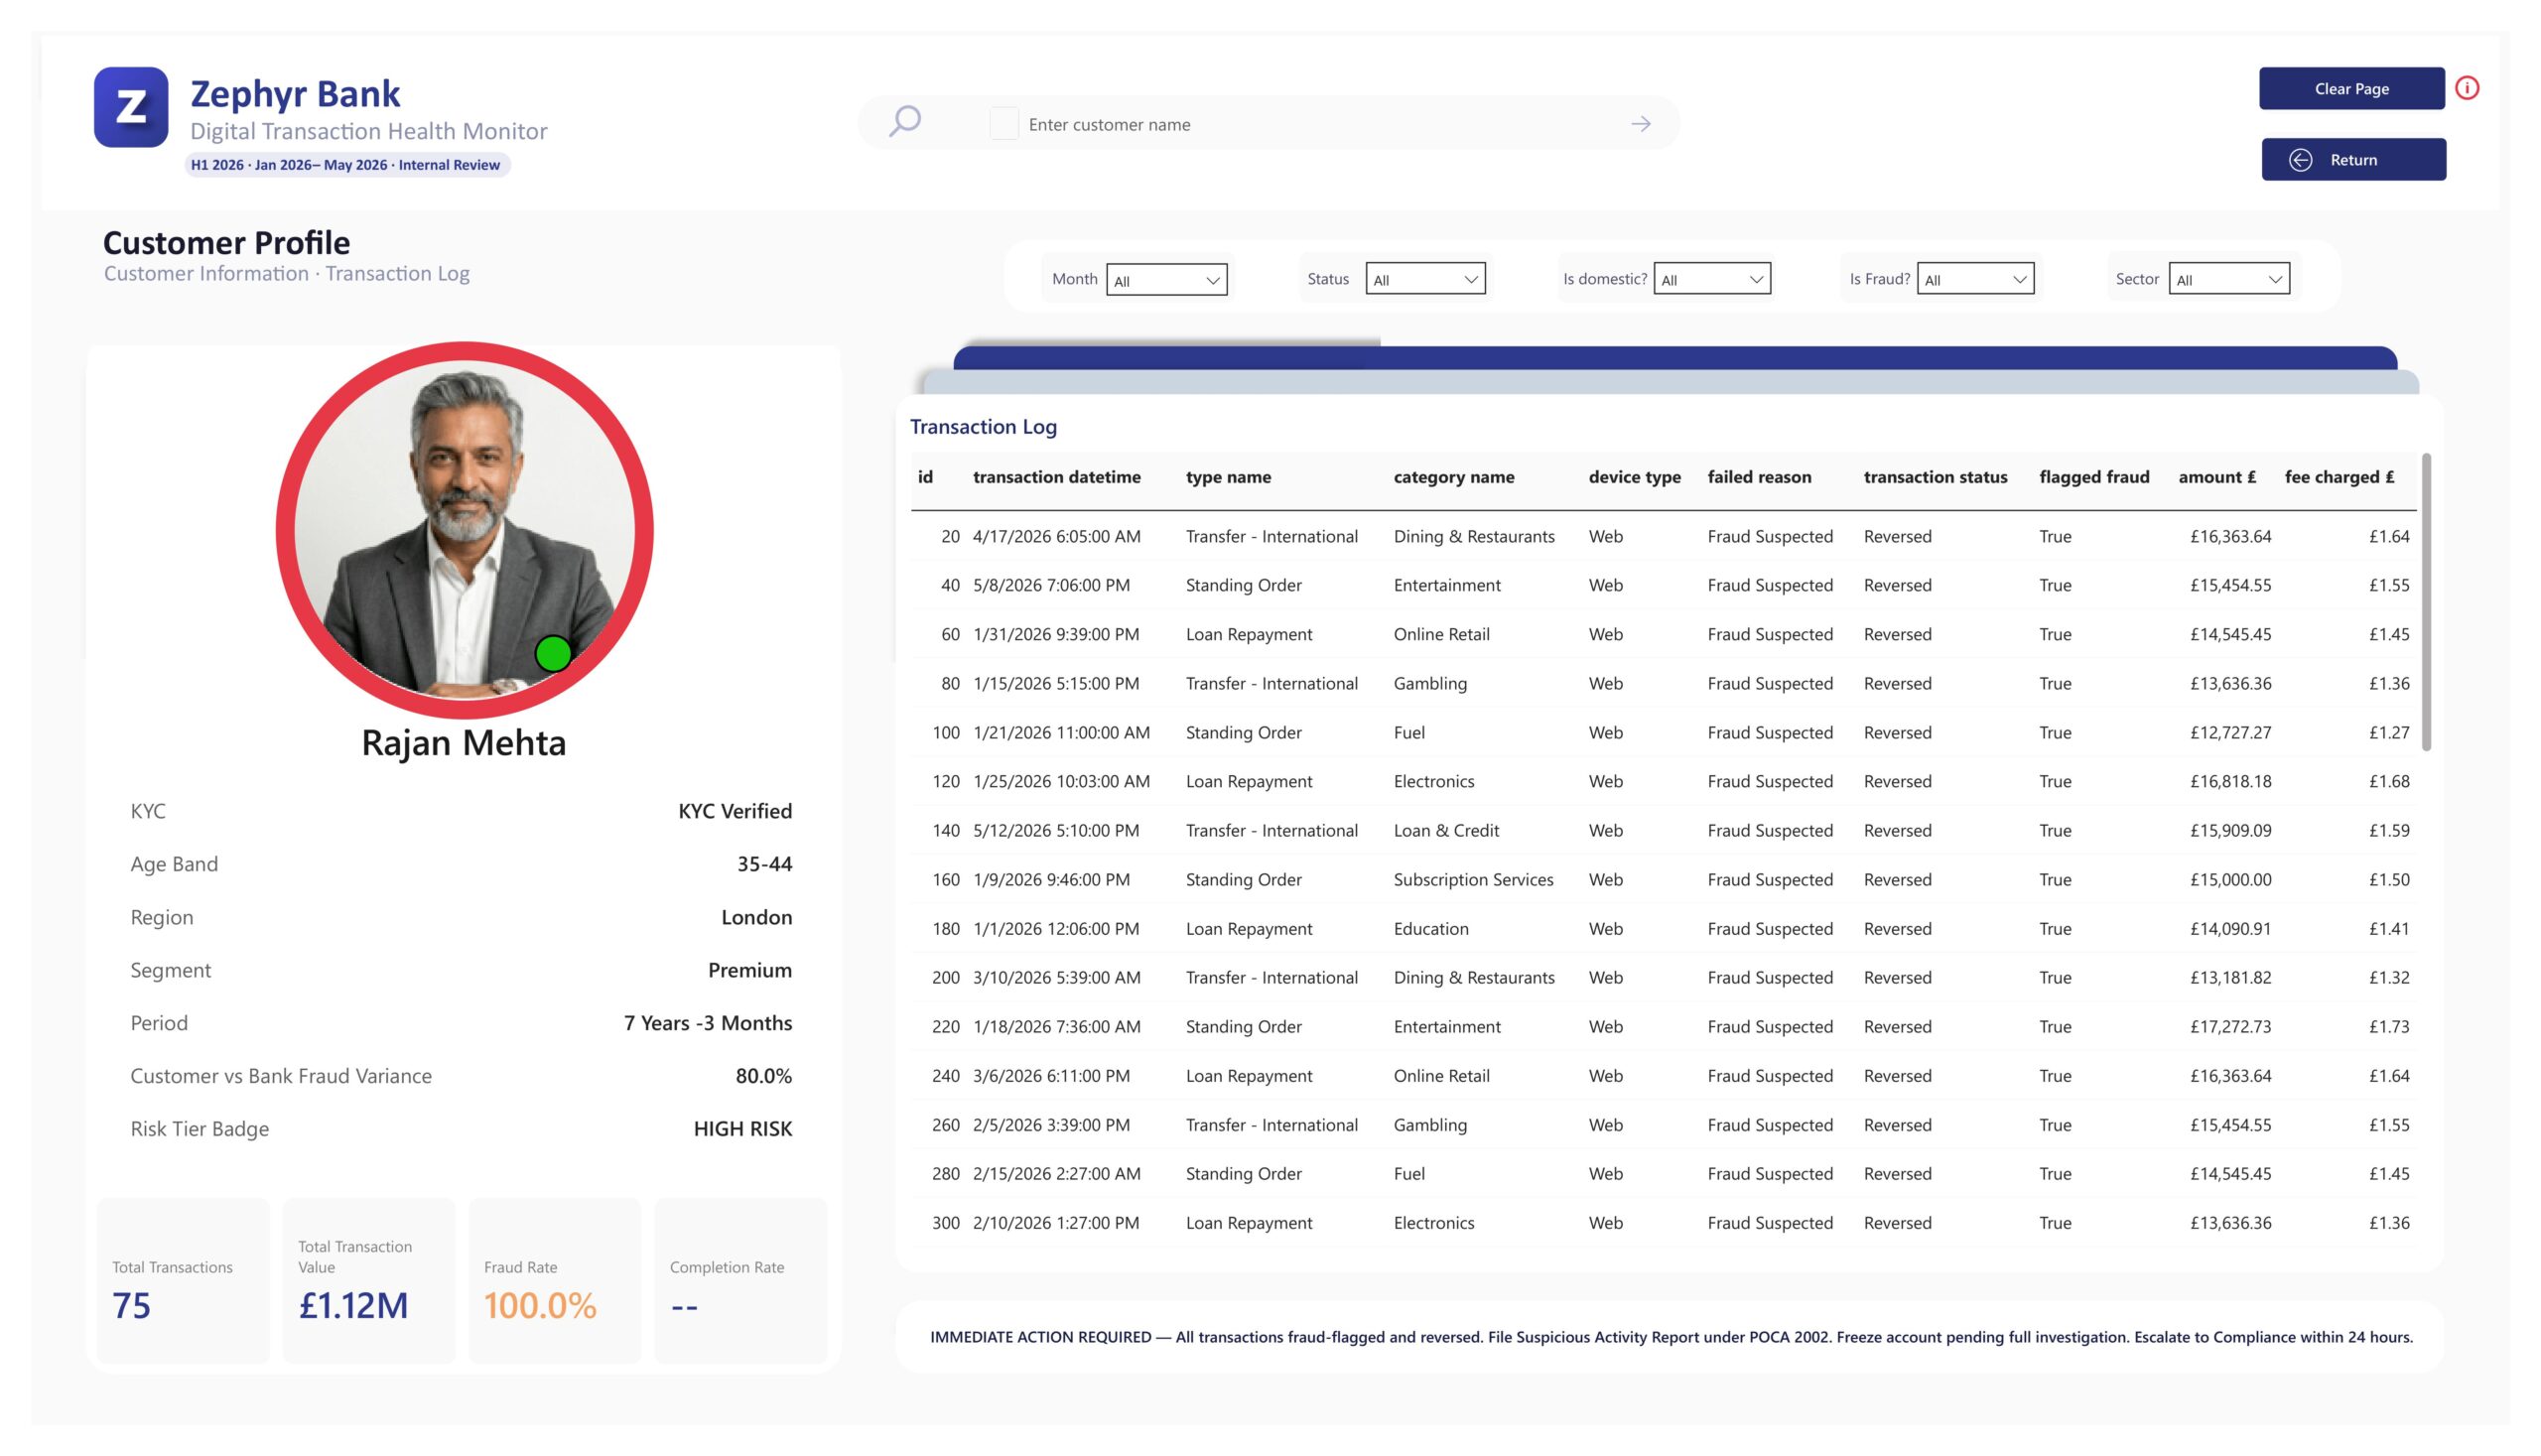
This project analyzes bank transaction data to identify fraud patterns, financial risk exposure, and customer transaction behavior. I used Power...
A simple dashboard that traces exactly where your operational leaks are.
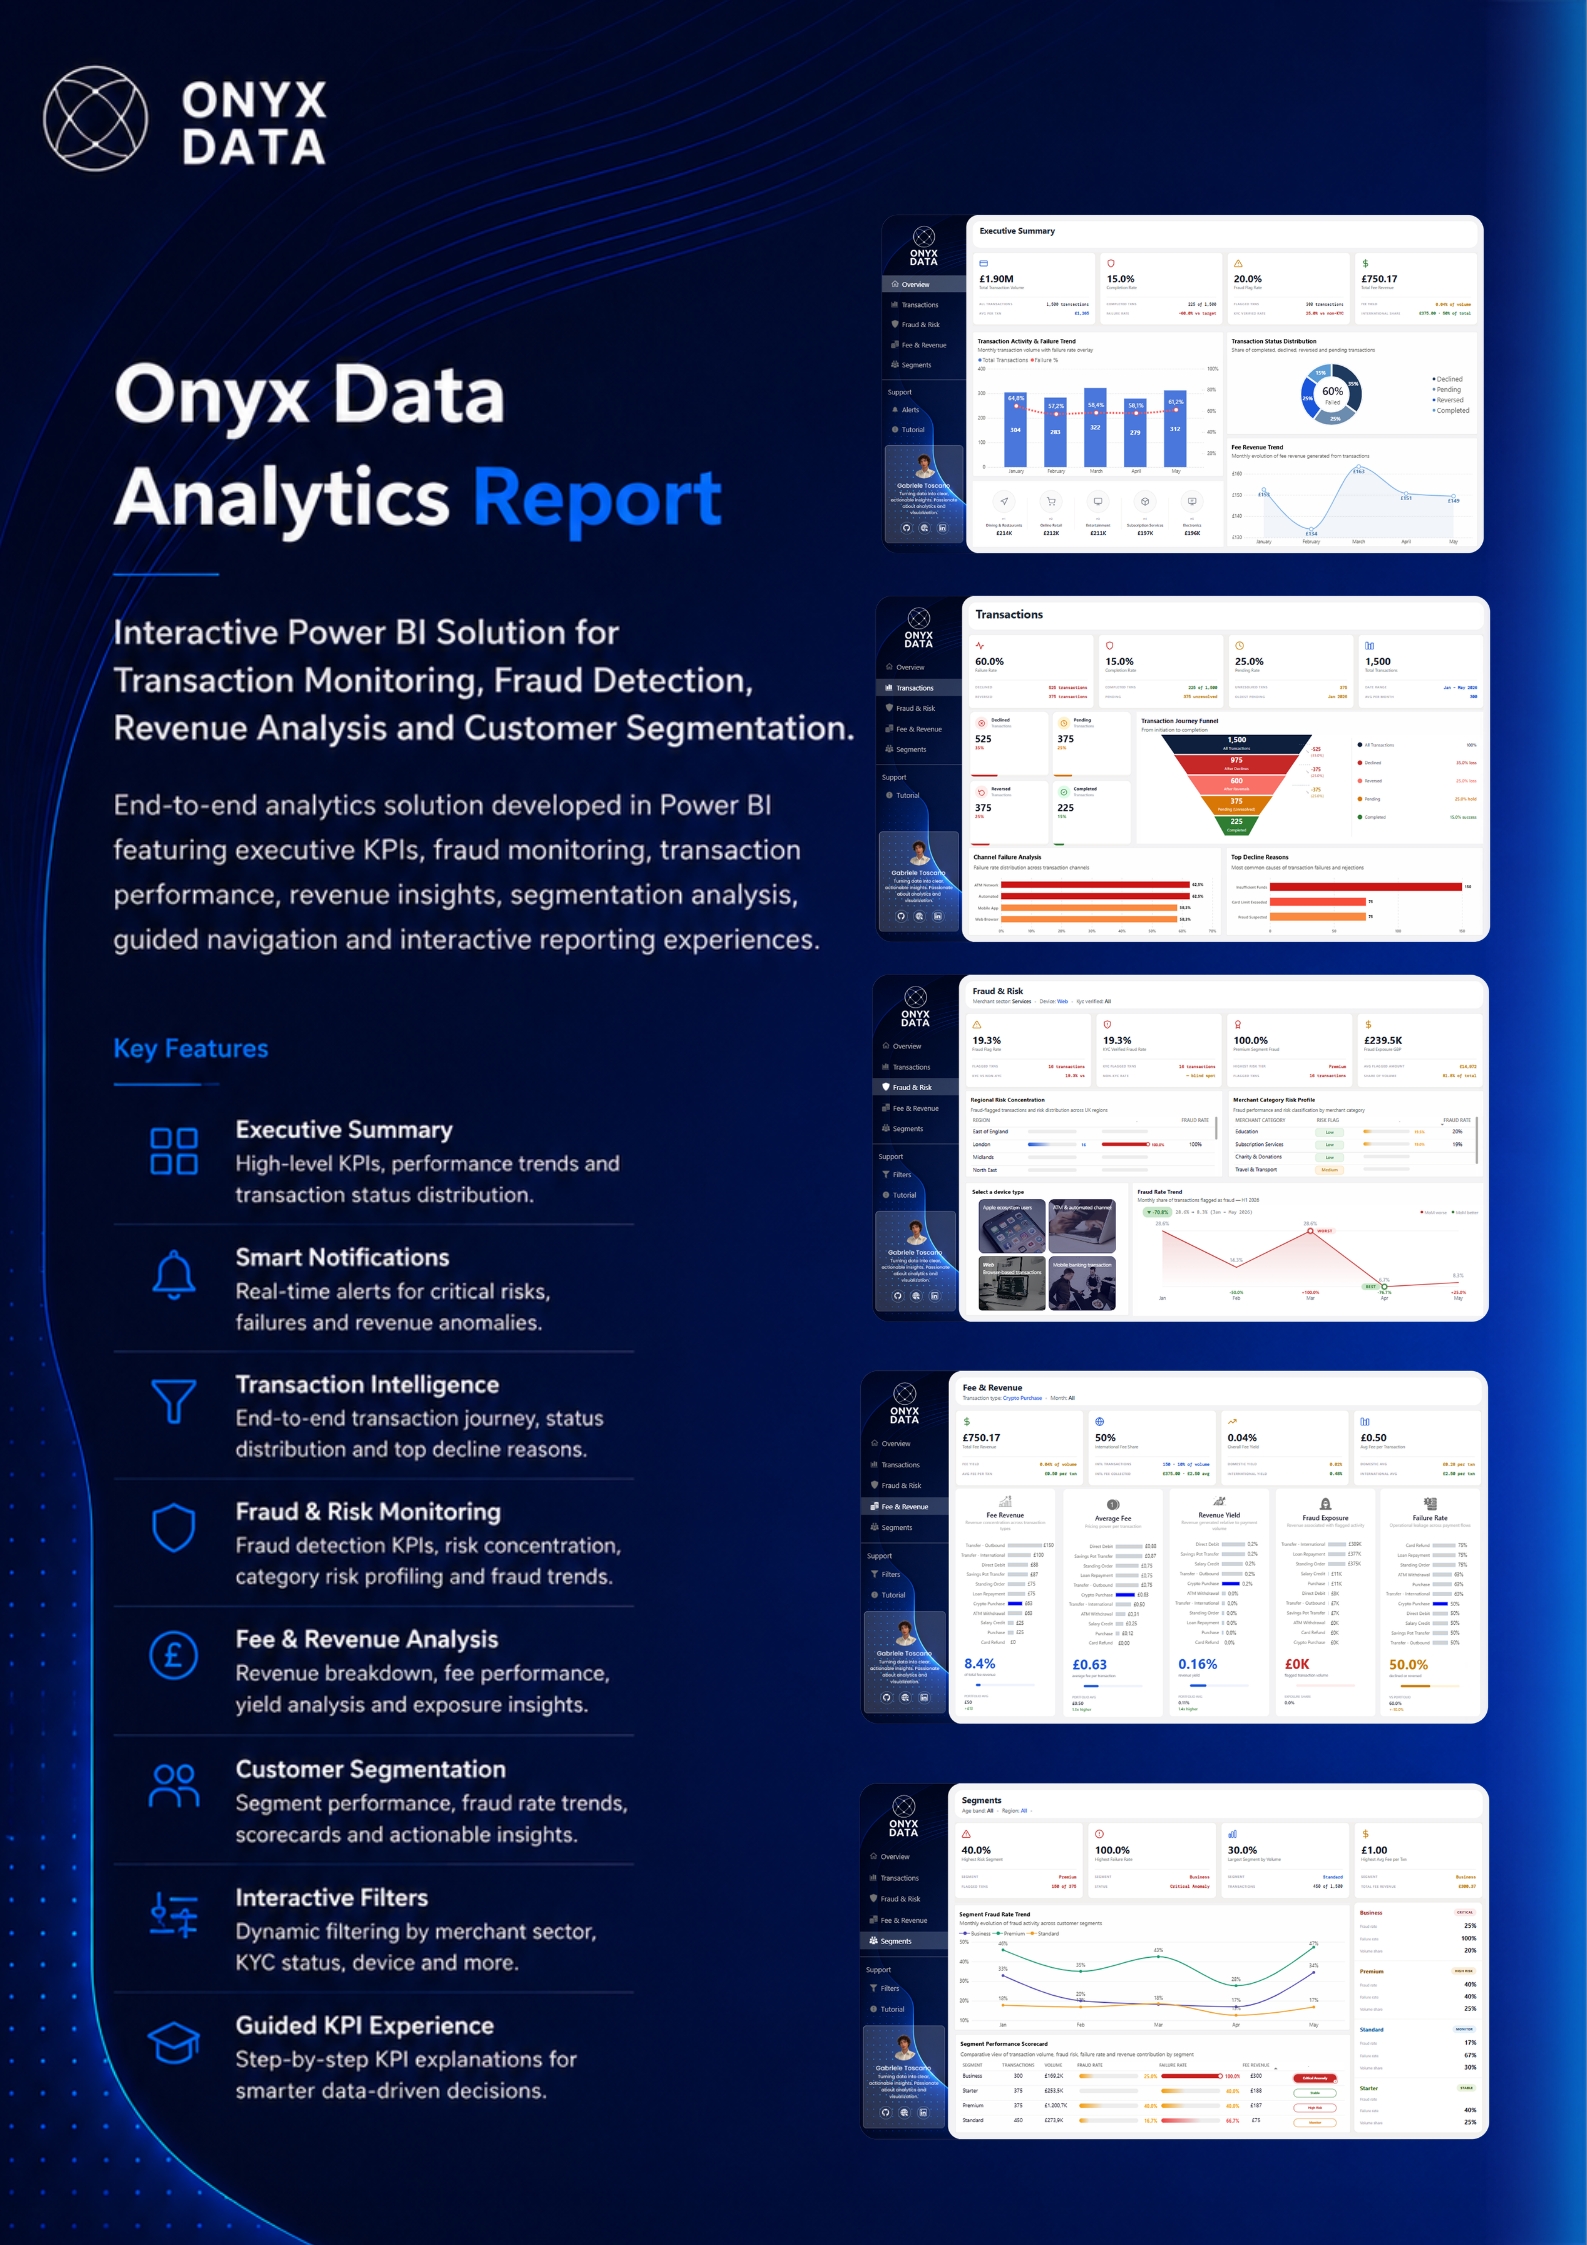
Built with Power BI to analyze transaction patterns, fraud exposure, and channel performance across a UK fintech neobank dataset. Covers...
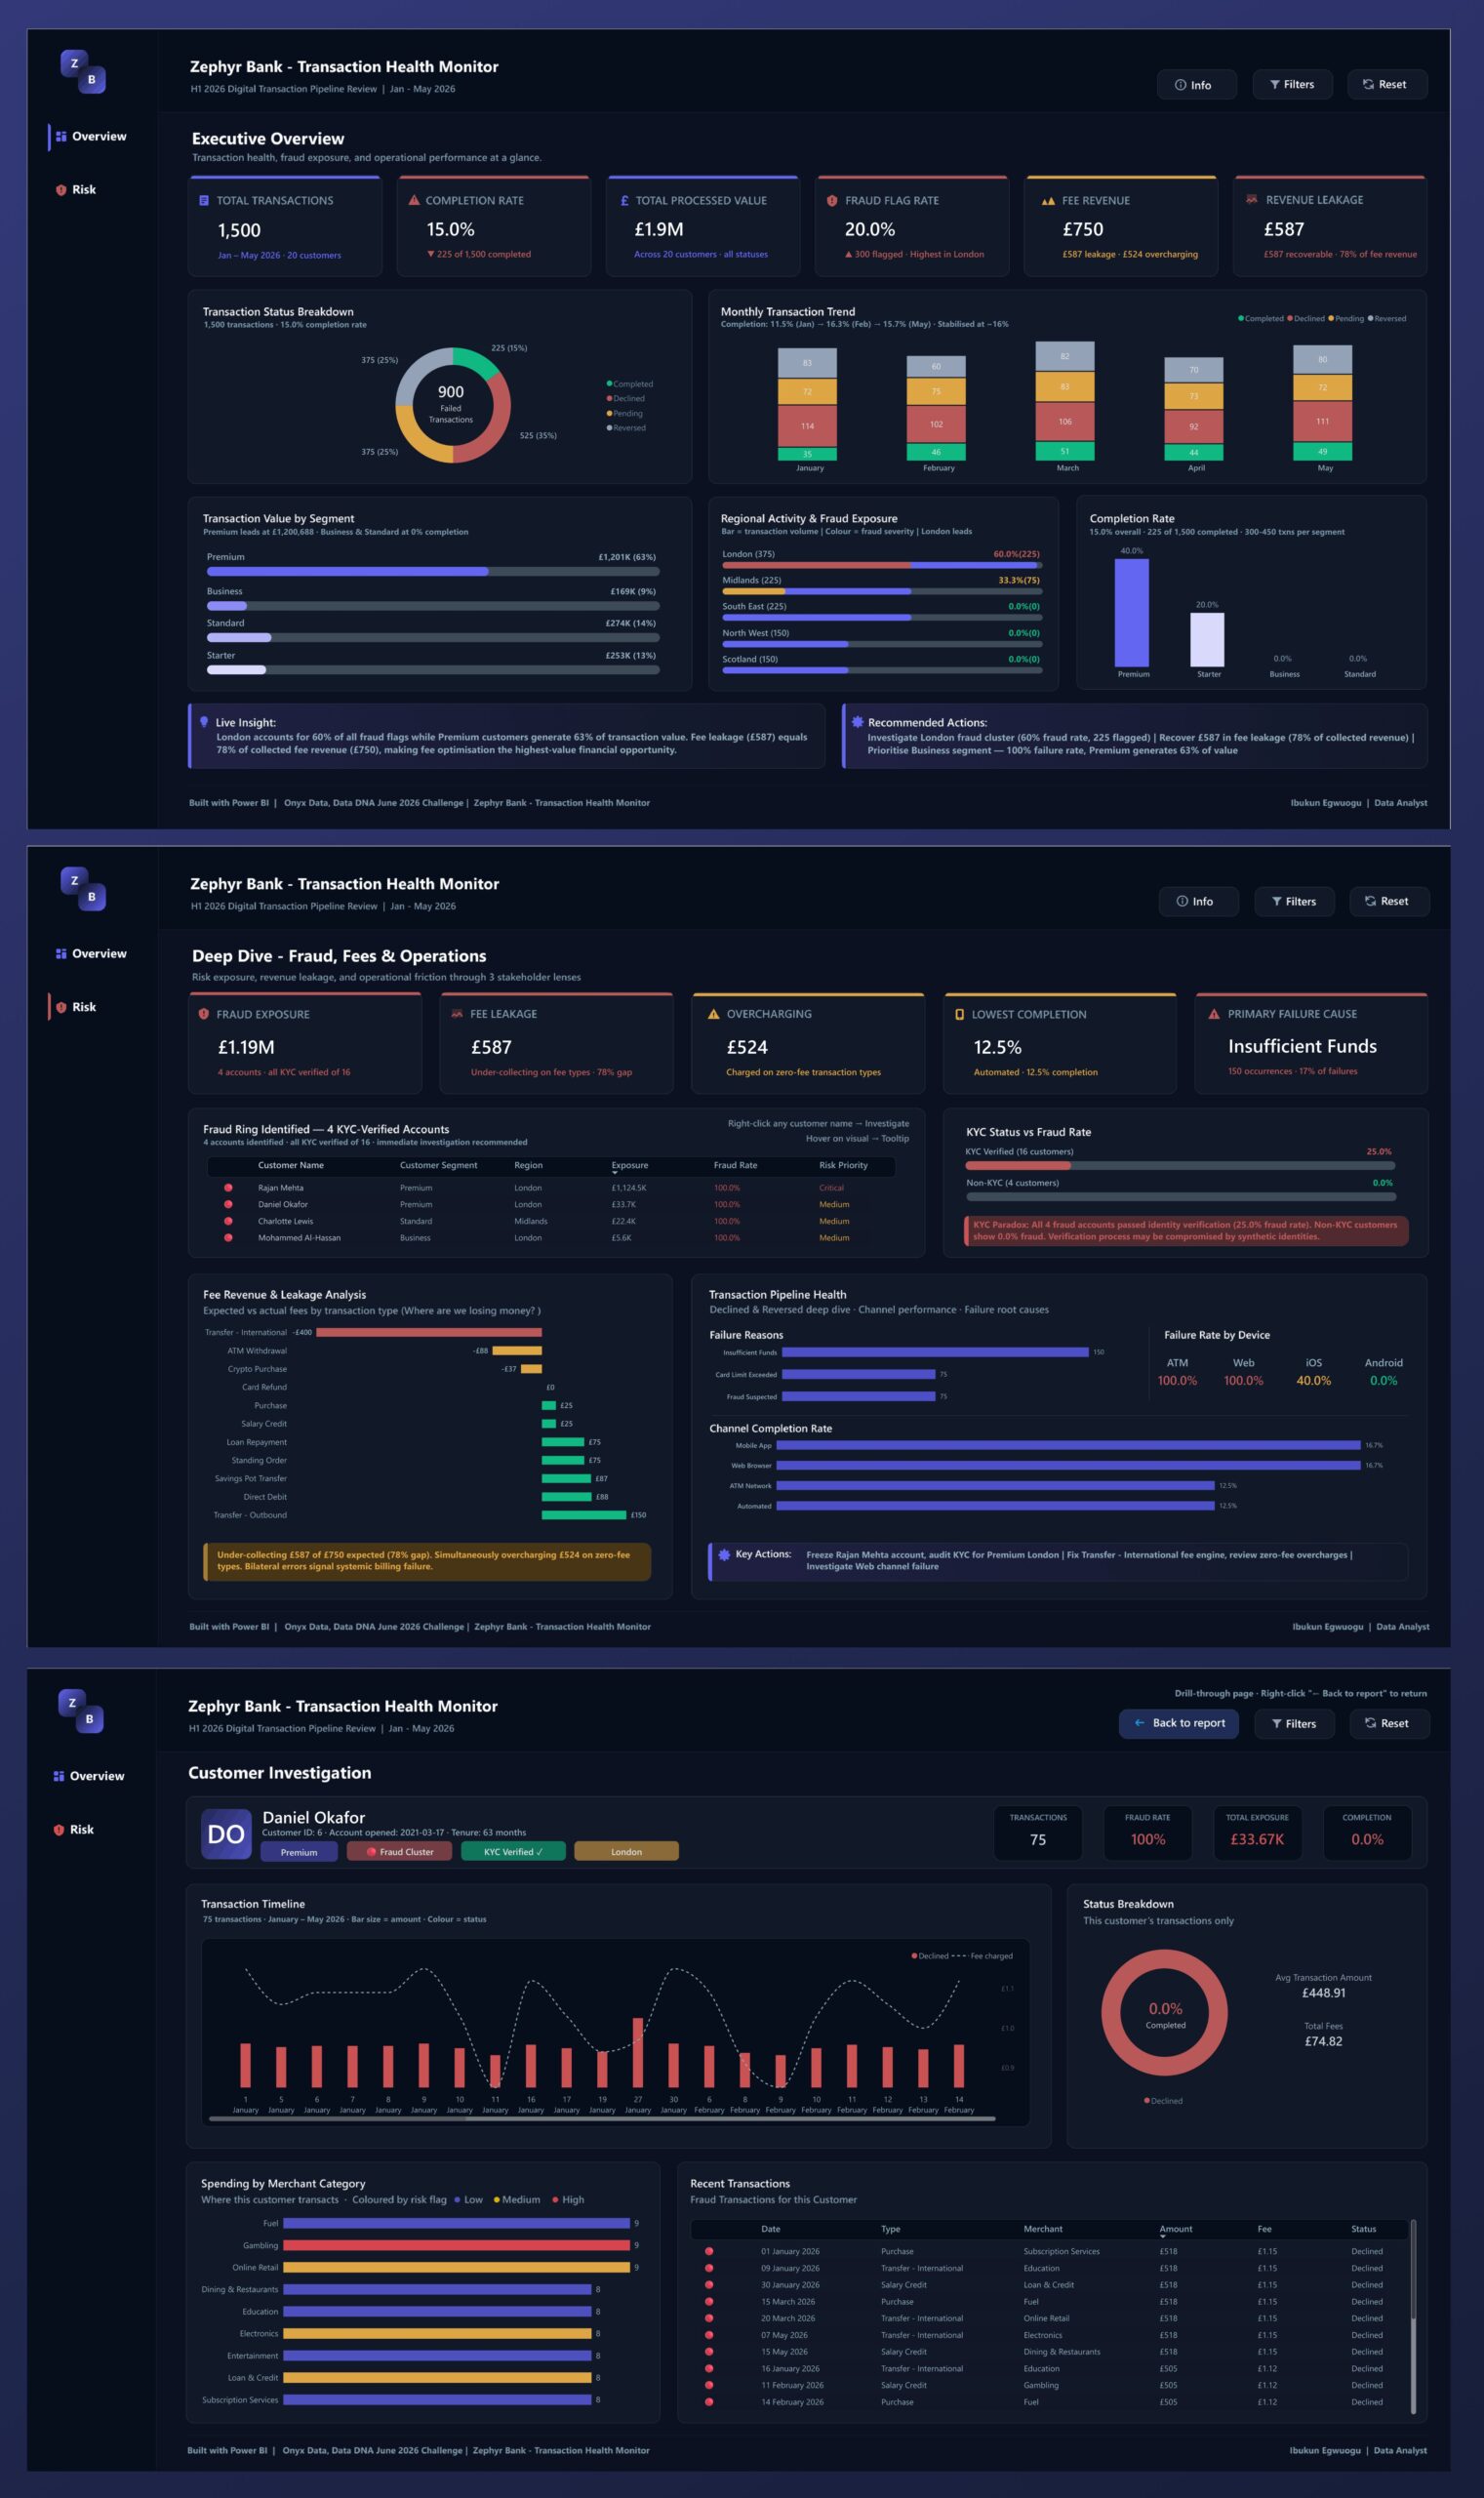
Analysed 1,500 digital transactions across a UK fintech neobank’s pipeline to diagnose a 15% completion rate, a £1.19M fraud exposure...
I joined this month’s Onyx Data DataDNA Challenge. The brief: build a transaction health report covering fraud, fees, and channel...
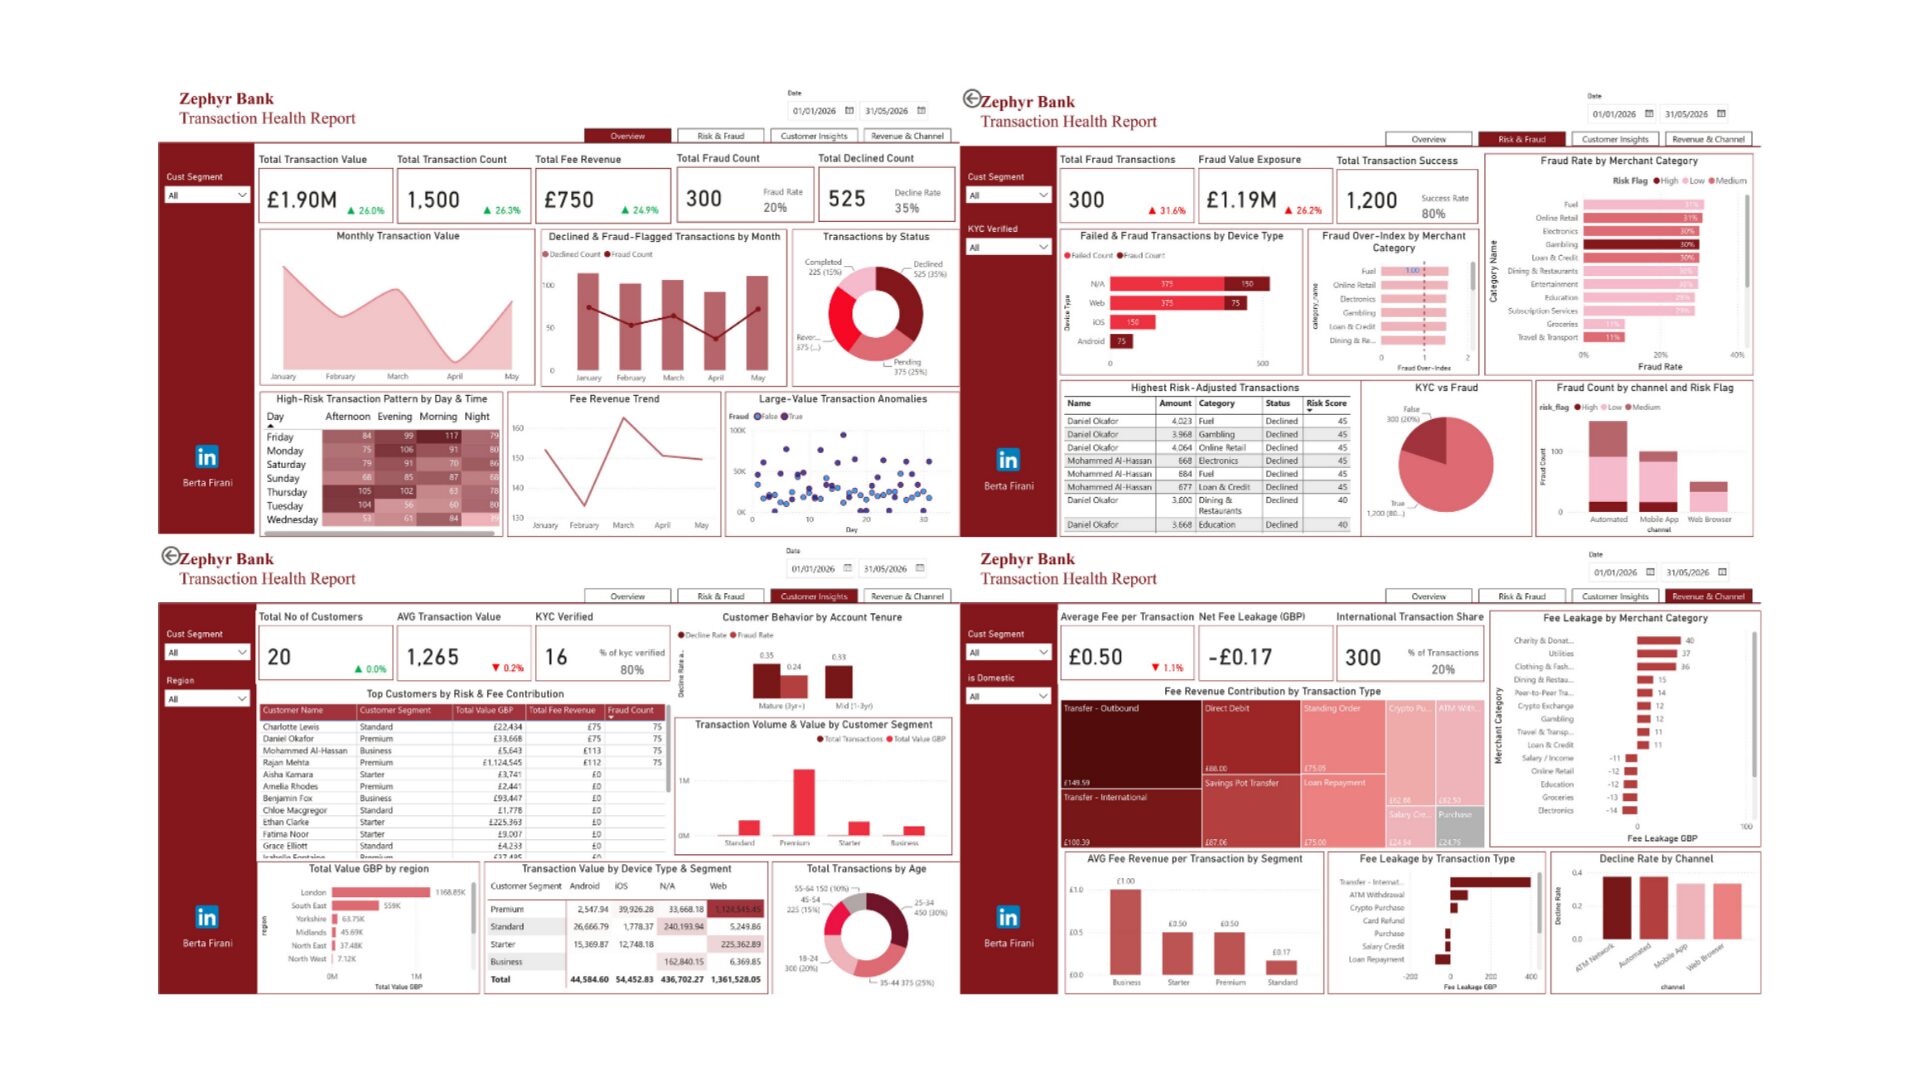
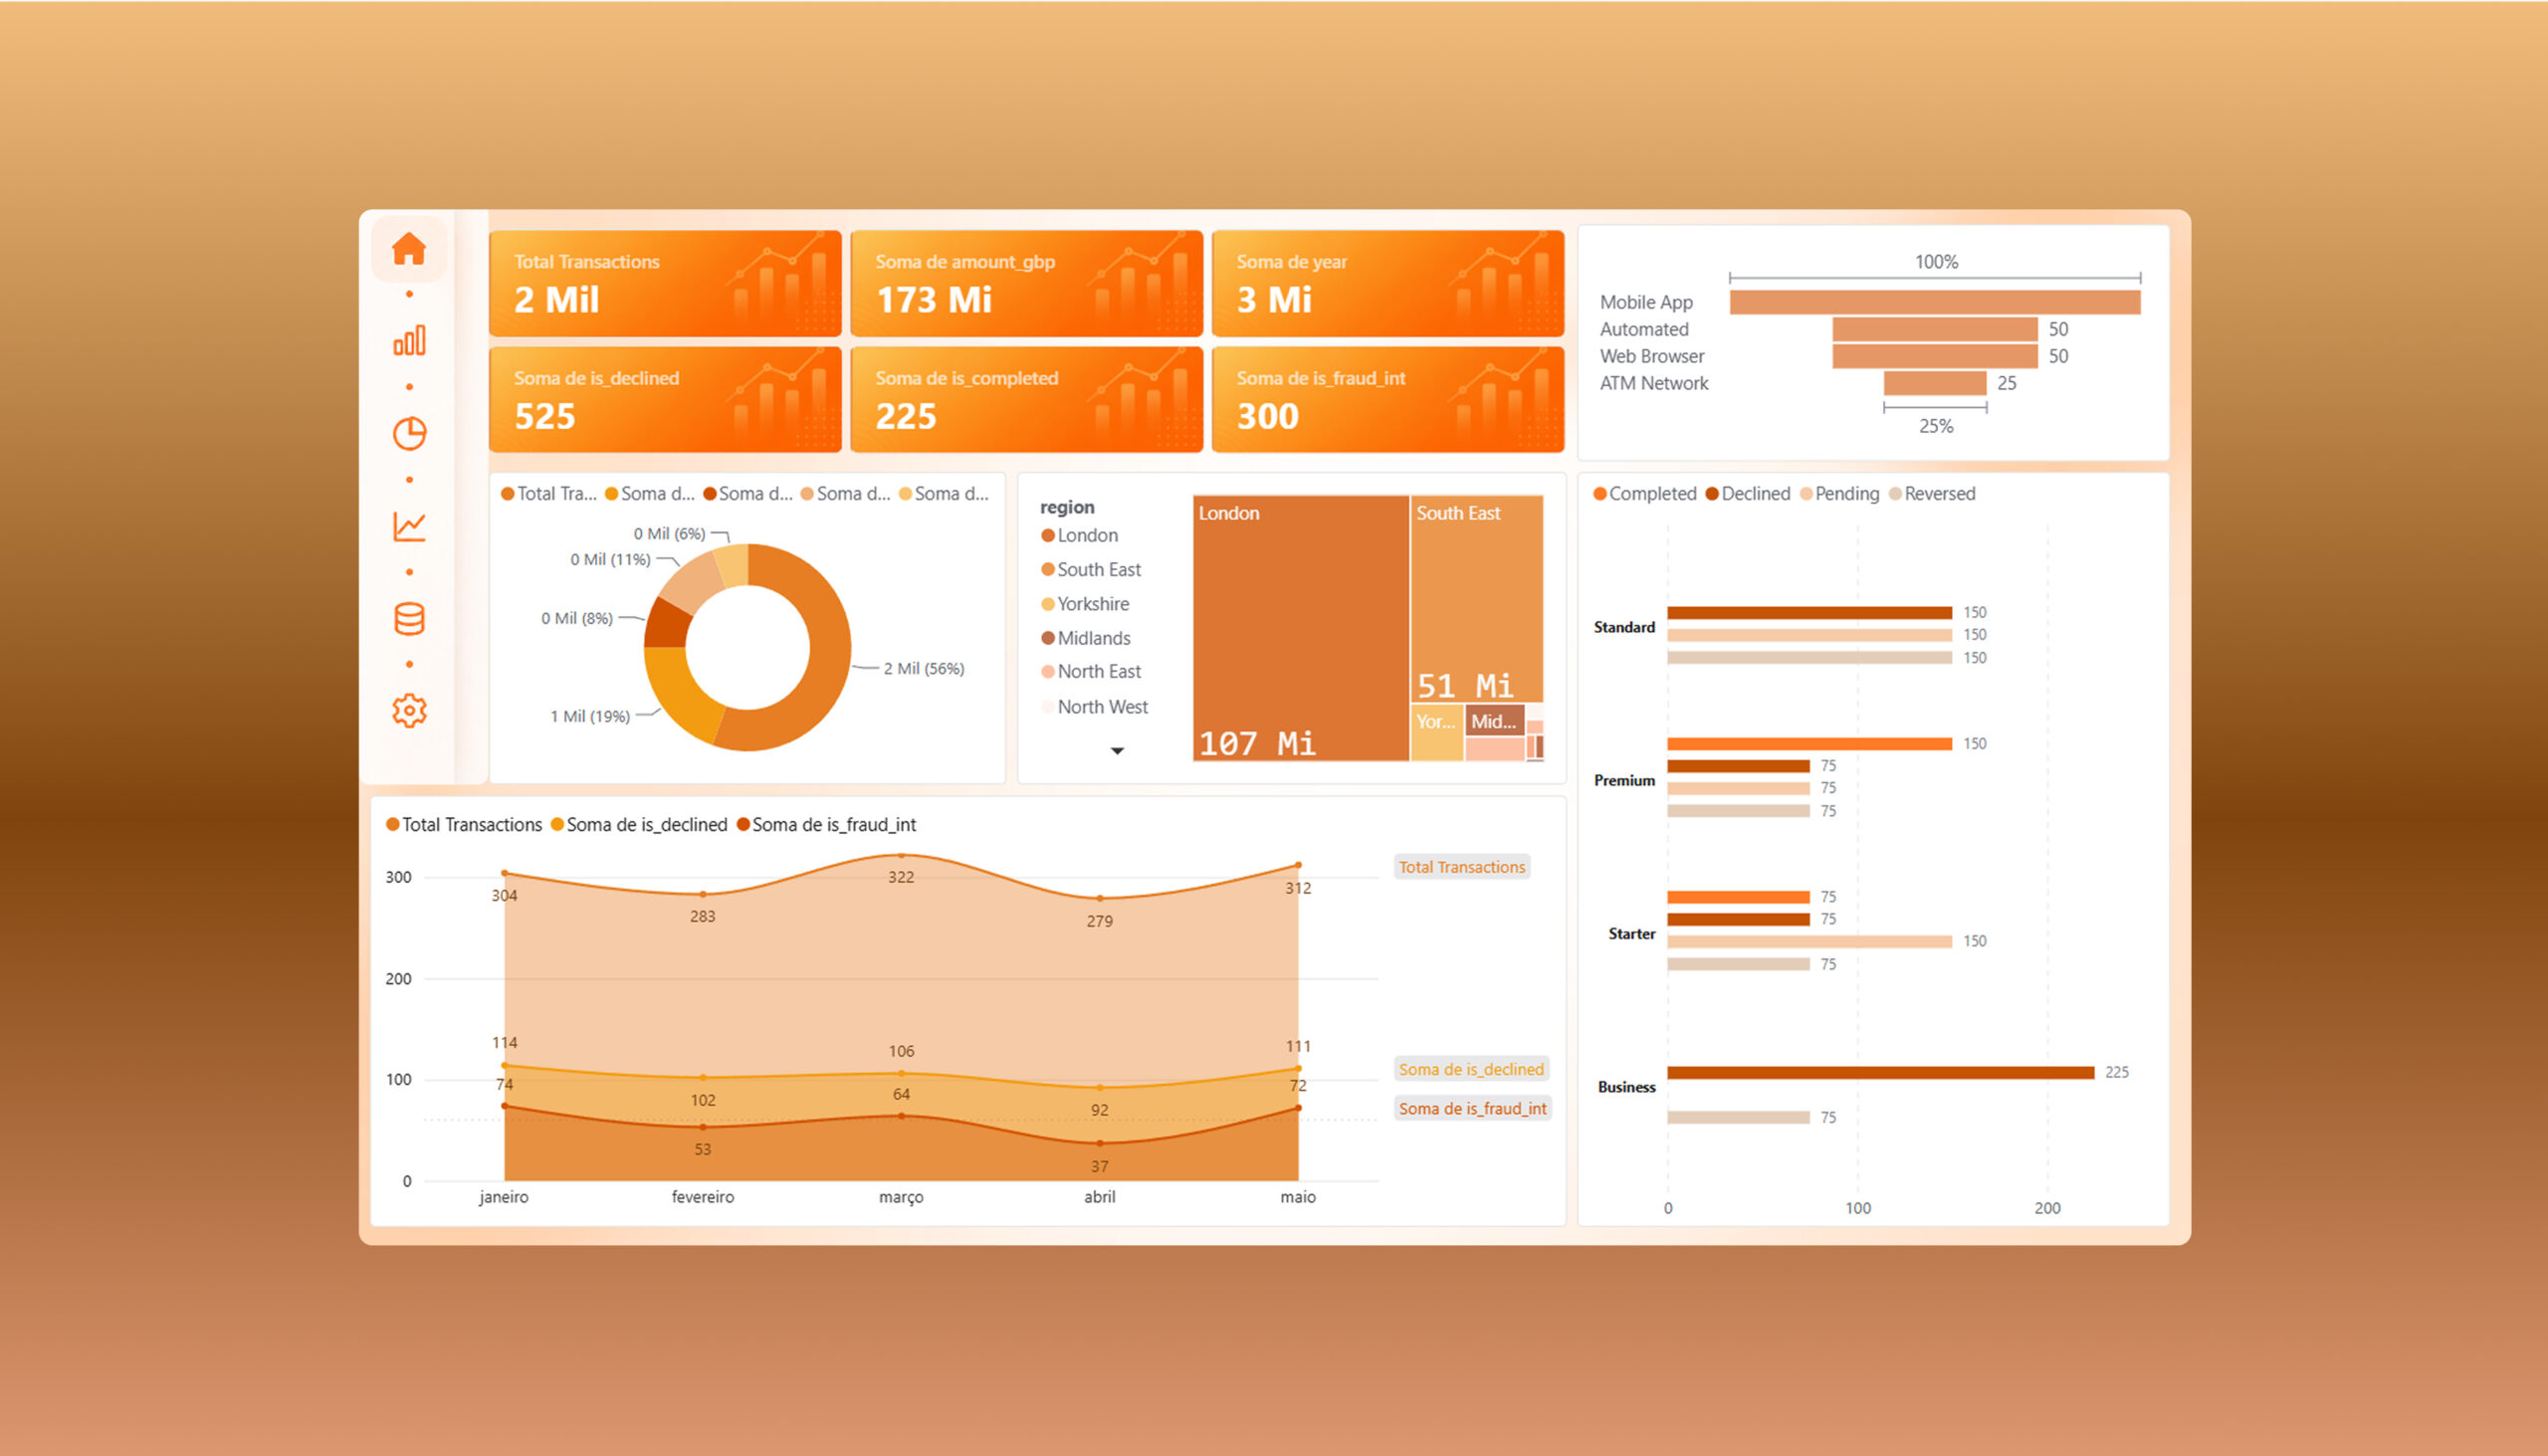
Describe: The dashboard analyzes transaction health, fraud exposure, fee revenue leakage, and operational failures across a UK-based fintech neobank built...
Discover the latest AI & Data challenges


Contact our team

16 Upper Woburn Place, London, Greater London, WC1H 0AF, United Kingdom