Join a community of the most creative Business Intelligence Professionals
Join a community of the most creative Business Intelligence Professionals
Find data professionals with skills verified through real challenge performance.
Browse Talent DirectoryCreate realistic synthetic data for training, testing, and demonstrations.
Explore Dataset Generator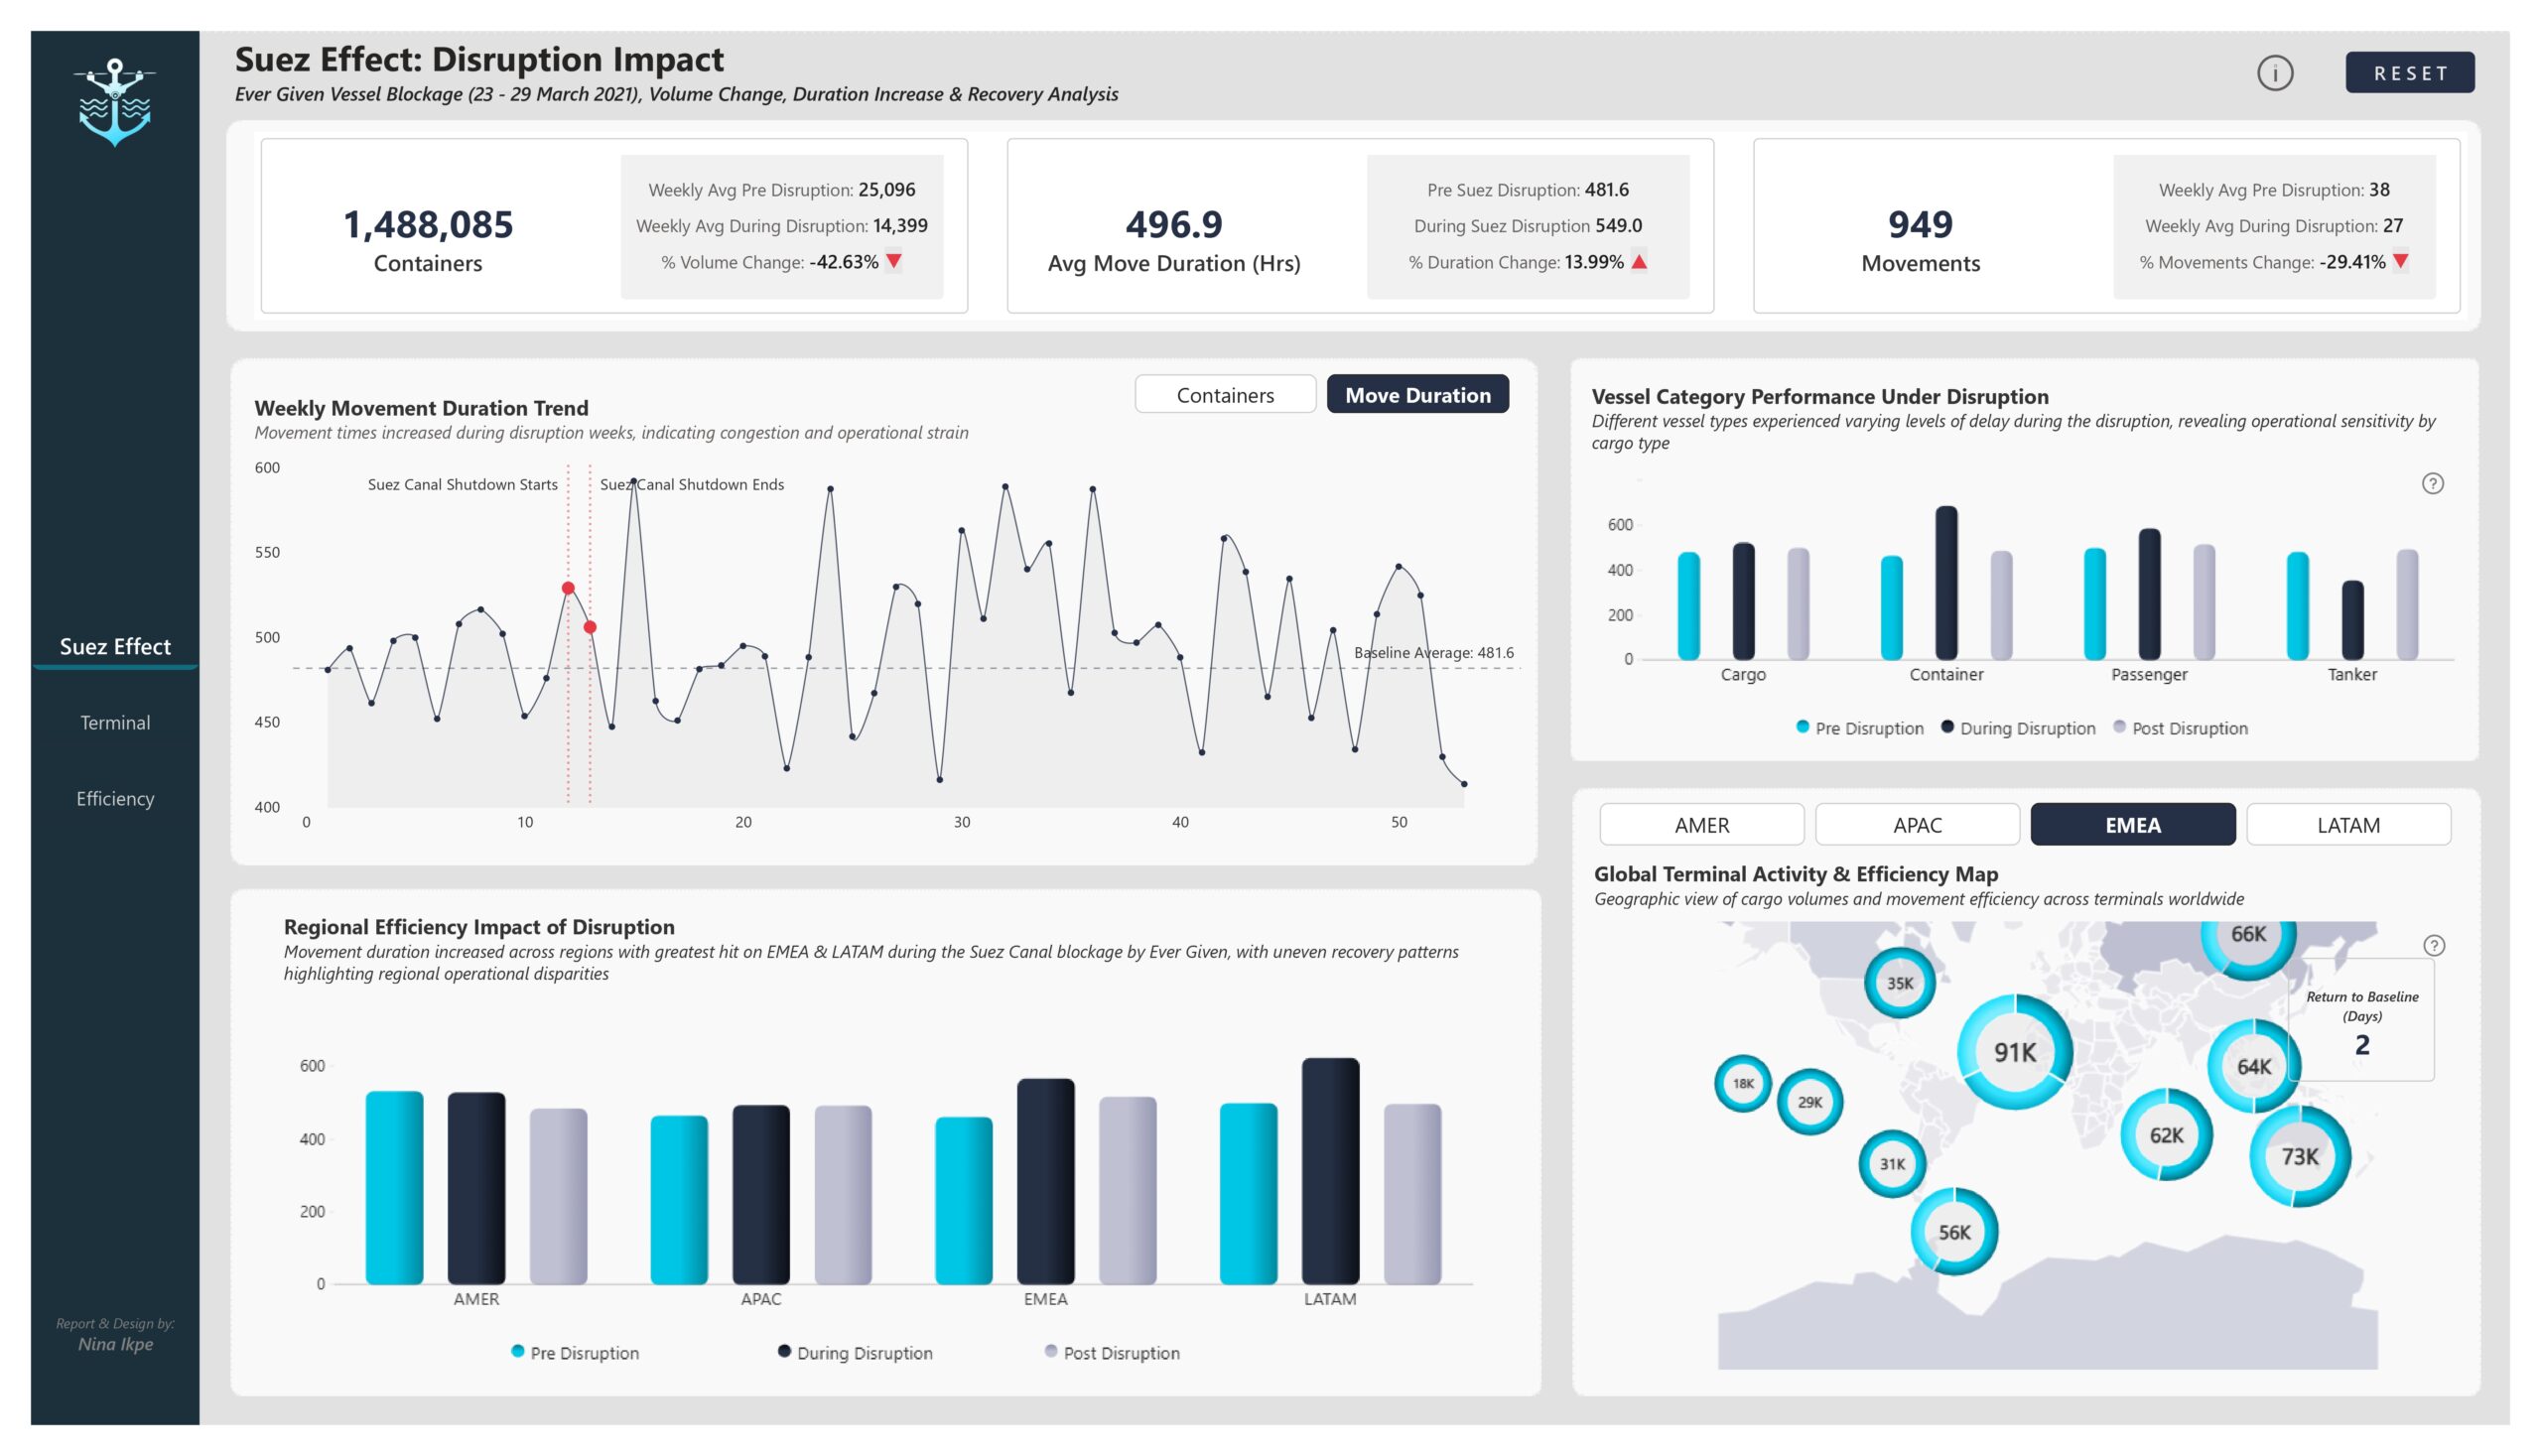

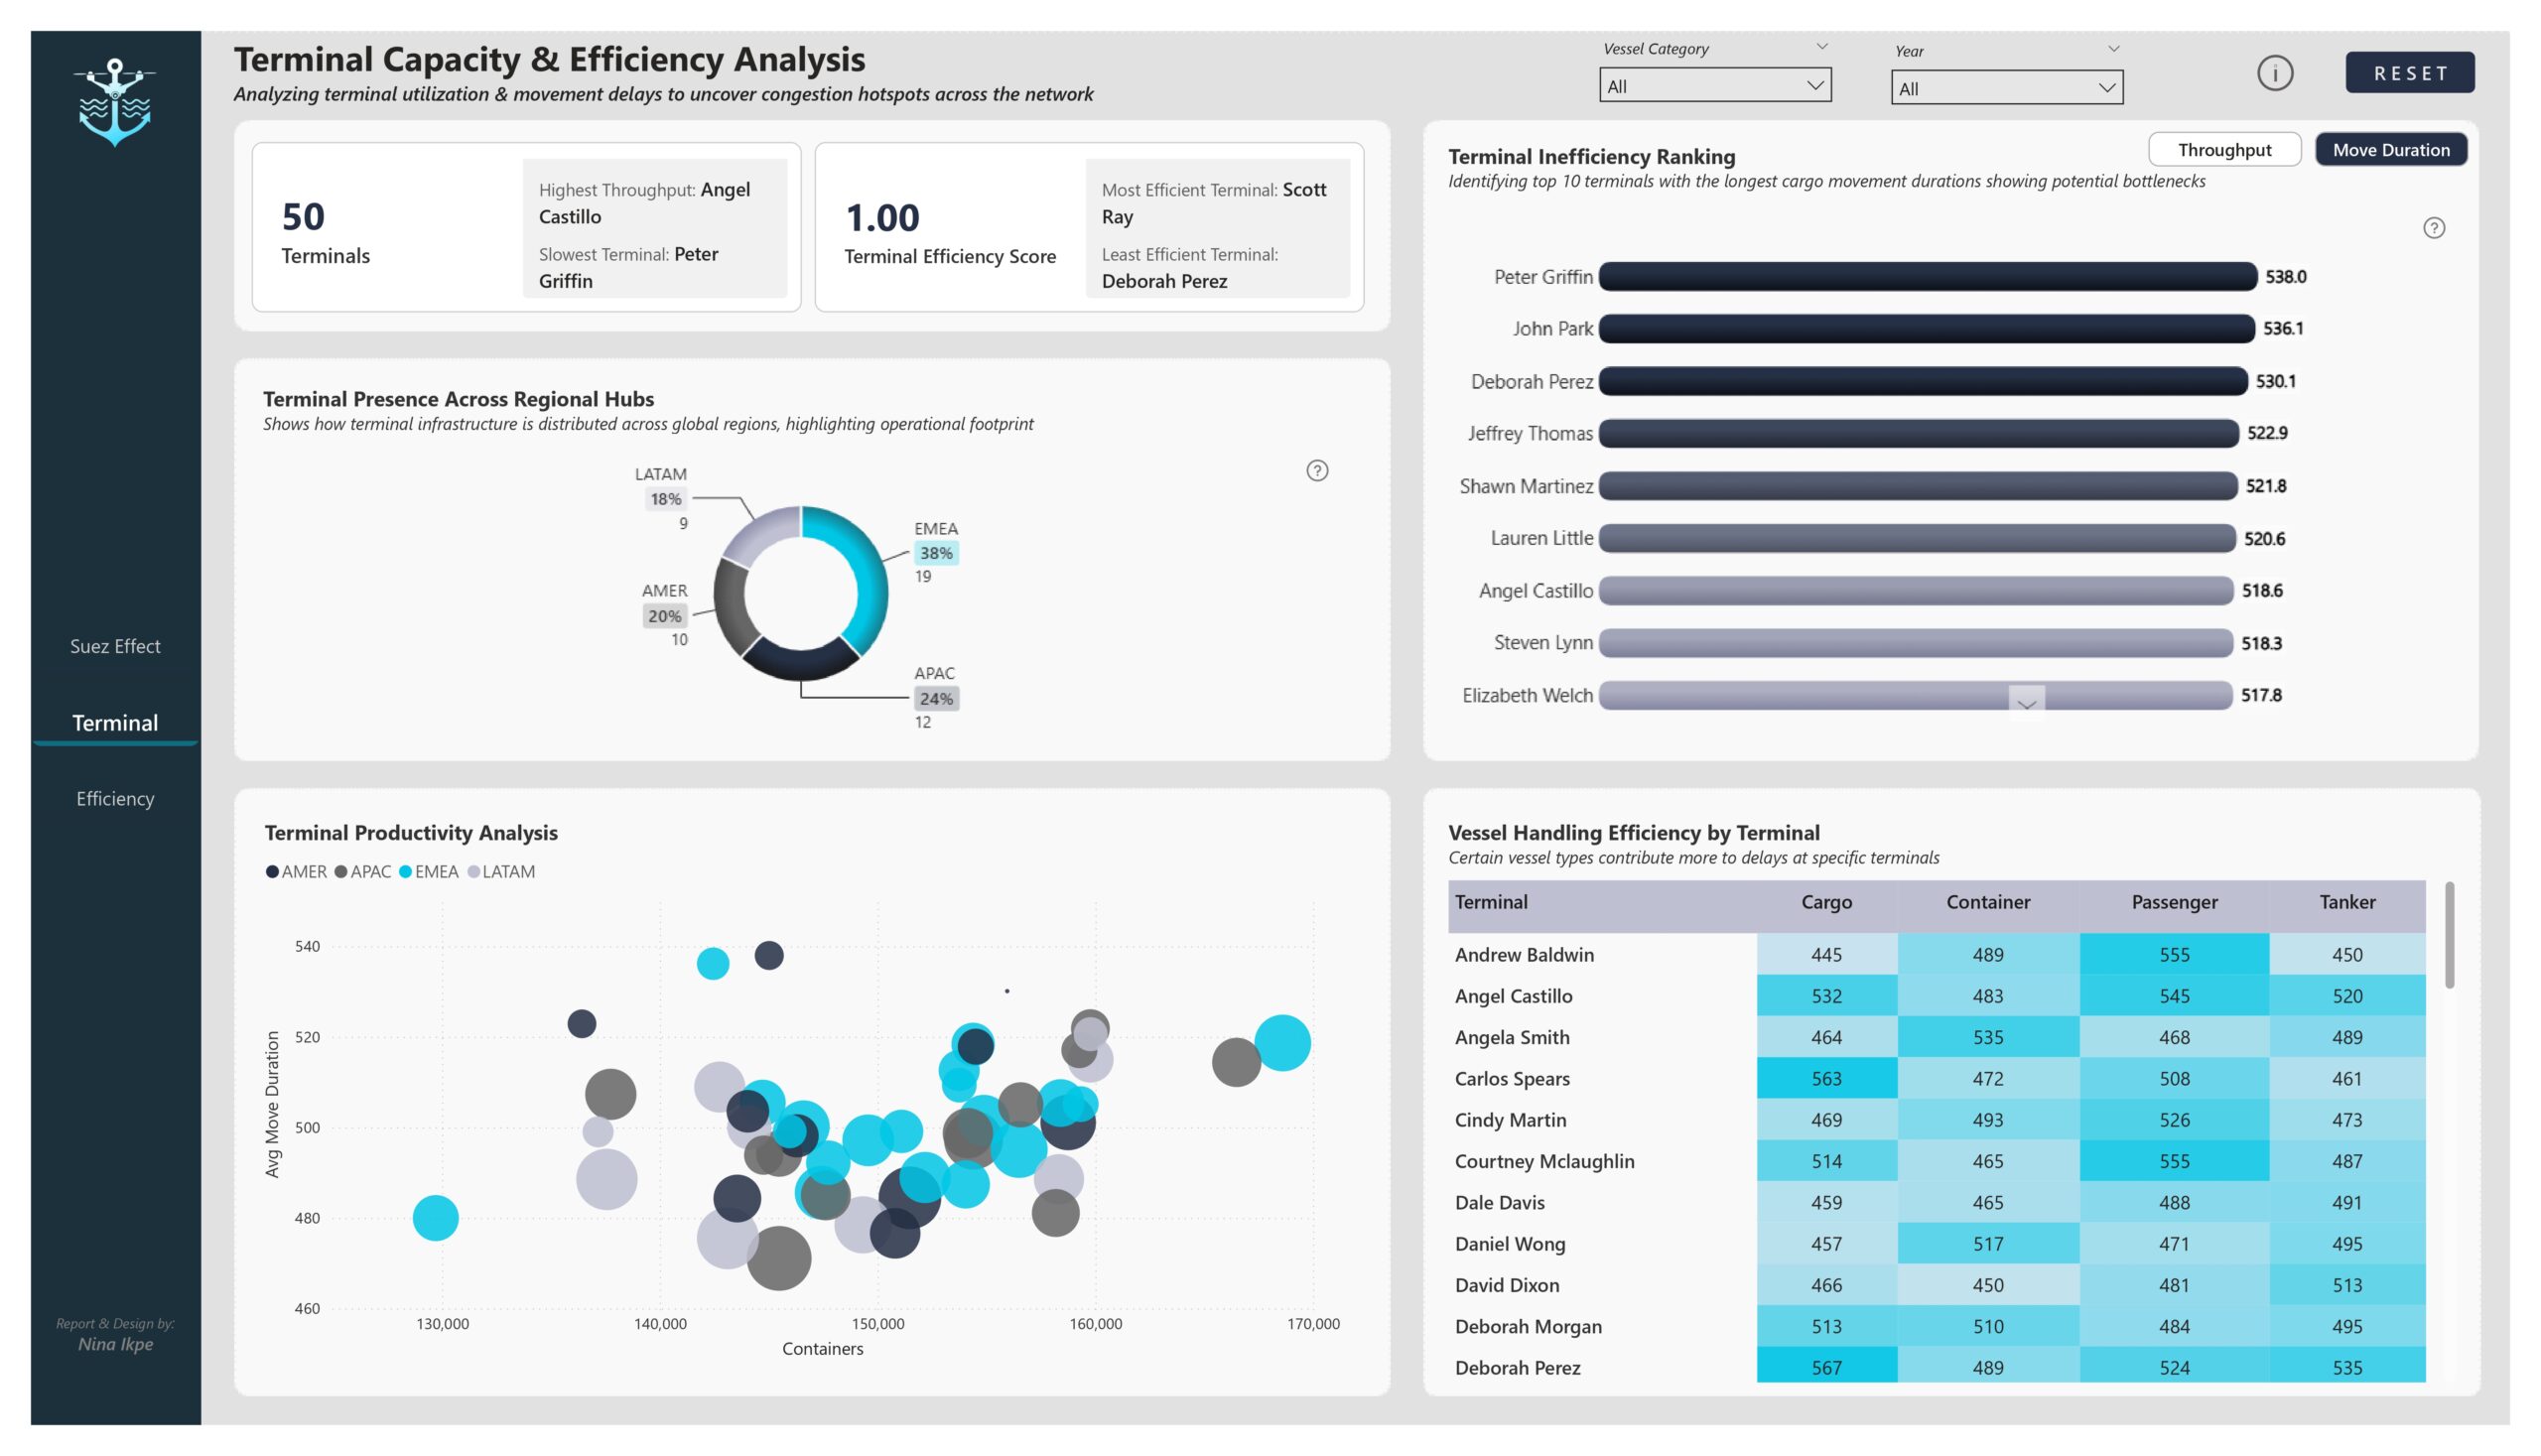
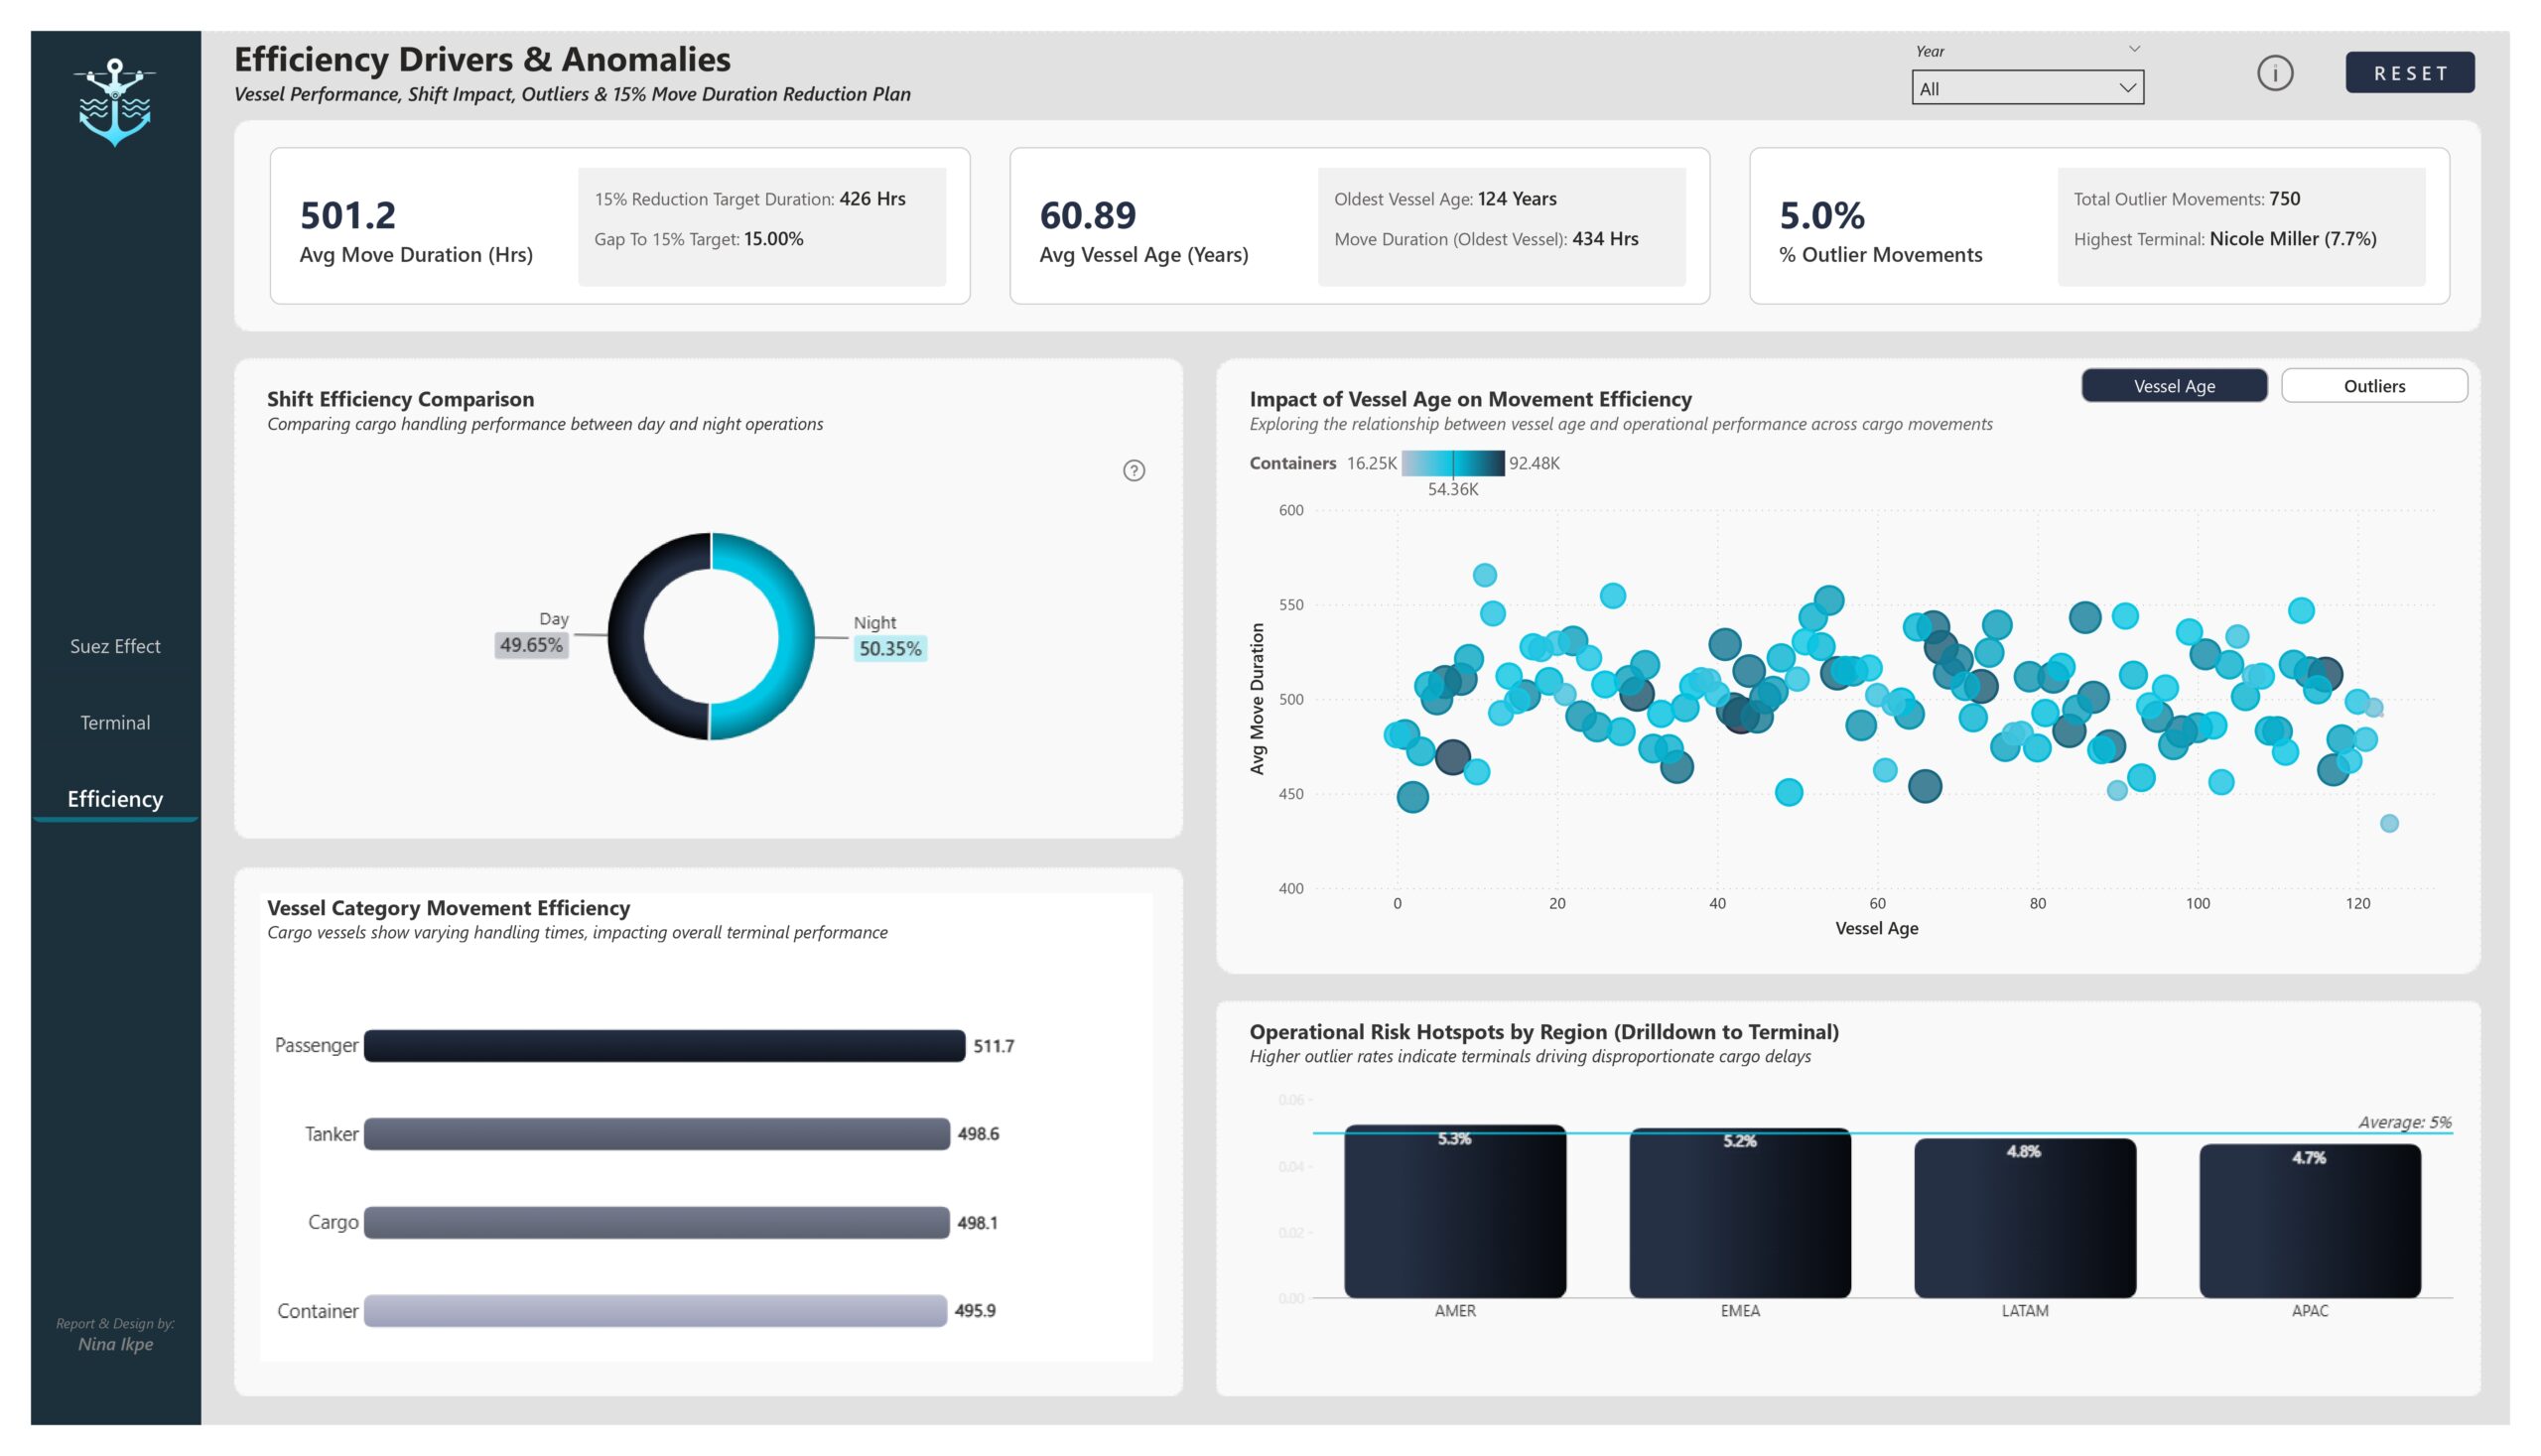
Six days in March 2021 changed everything. When the Ever Given blocked the Suez Canal, global supply chains froze and our terminal felt the shockwaves. What looked like a distant event quickly exposed hidden weaknesses in operations: sudden volume surges, stretched move durations, and terminals pushed to the brink. This 3-page interactive Power BI dashboard turns that lesson into an actionable intelligence. Report Overview Page 1: Suez Canal Disruption Impact Reveals exactly how the 6-day blockage affected cargo volumes, move durations, and regional operations, plus how long it took each region to recover. Page 2: Infrastructure Bottlenecks Spotlights which terminals are overloaded, where congestion is hurting performance, and which locations need urgent capacity expansion. Page 3: Efficiency Anomalies & Improvement Plan Uncovers the real drivers of delays from older vessels and night shifts to high utilization, and lays out a clear roadmap to achieve a 15% reduction target in cargo move duration. Takeaways • Some terminals are operating near or beyond safe capacity. • Older vessels and night operations are a sources of inefficiency. • With the right moves, smarter allocation and targeted investments, move duration can realistically be cut down by 15%. This dashboard transforms the Suez disruption from just a reminder into an opportunity for improvement.
Contact our team

16 Upper Woburn Place, London, Greater London, WC1H 0AF, United Kingdom


 Kumo Pascaline