Join a community of the most creative Business Intelligence Professionals
Join a community of the most creative Business Intelligence Professionals
Find data professionals with skills verified through real challenge performance.
Browse Talent DirectoryCreate realistic synthetic data for training, testing, and demonstrations.
Explore Dataset Generator
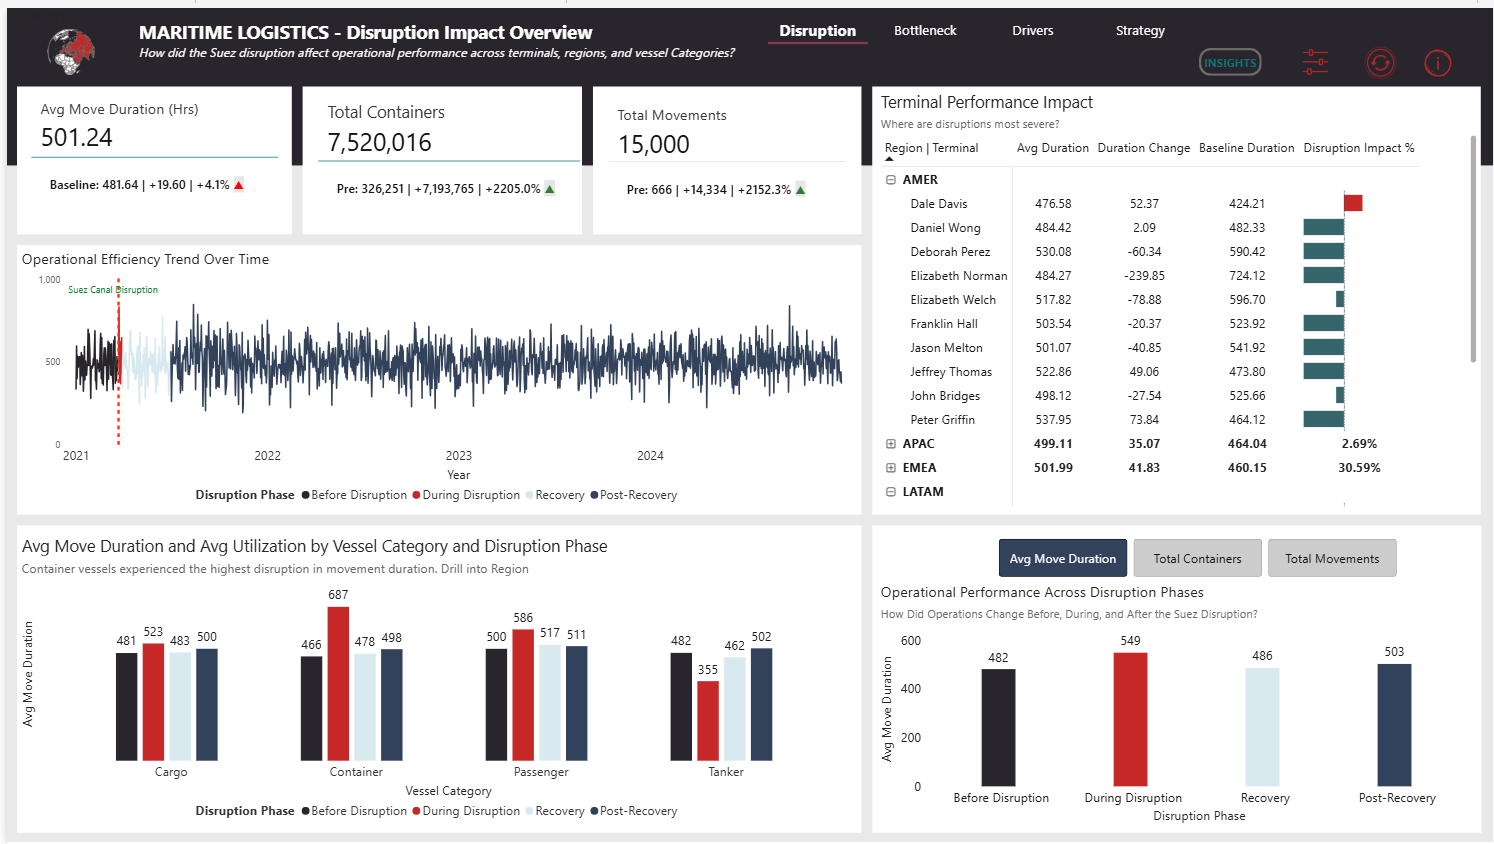
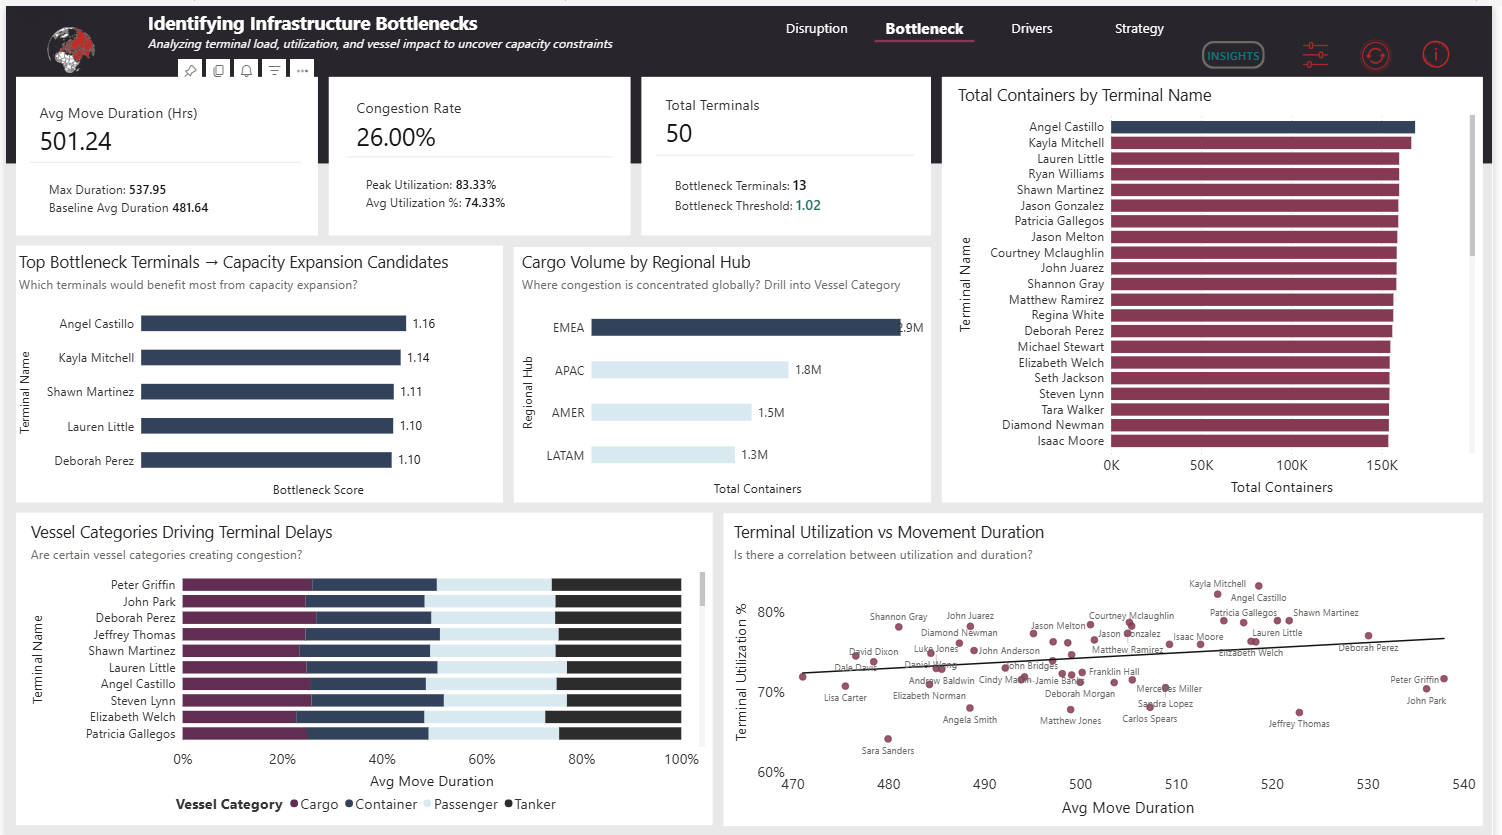
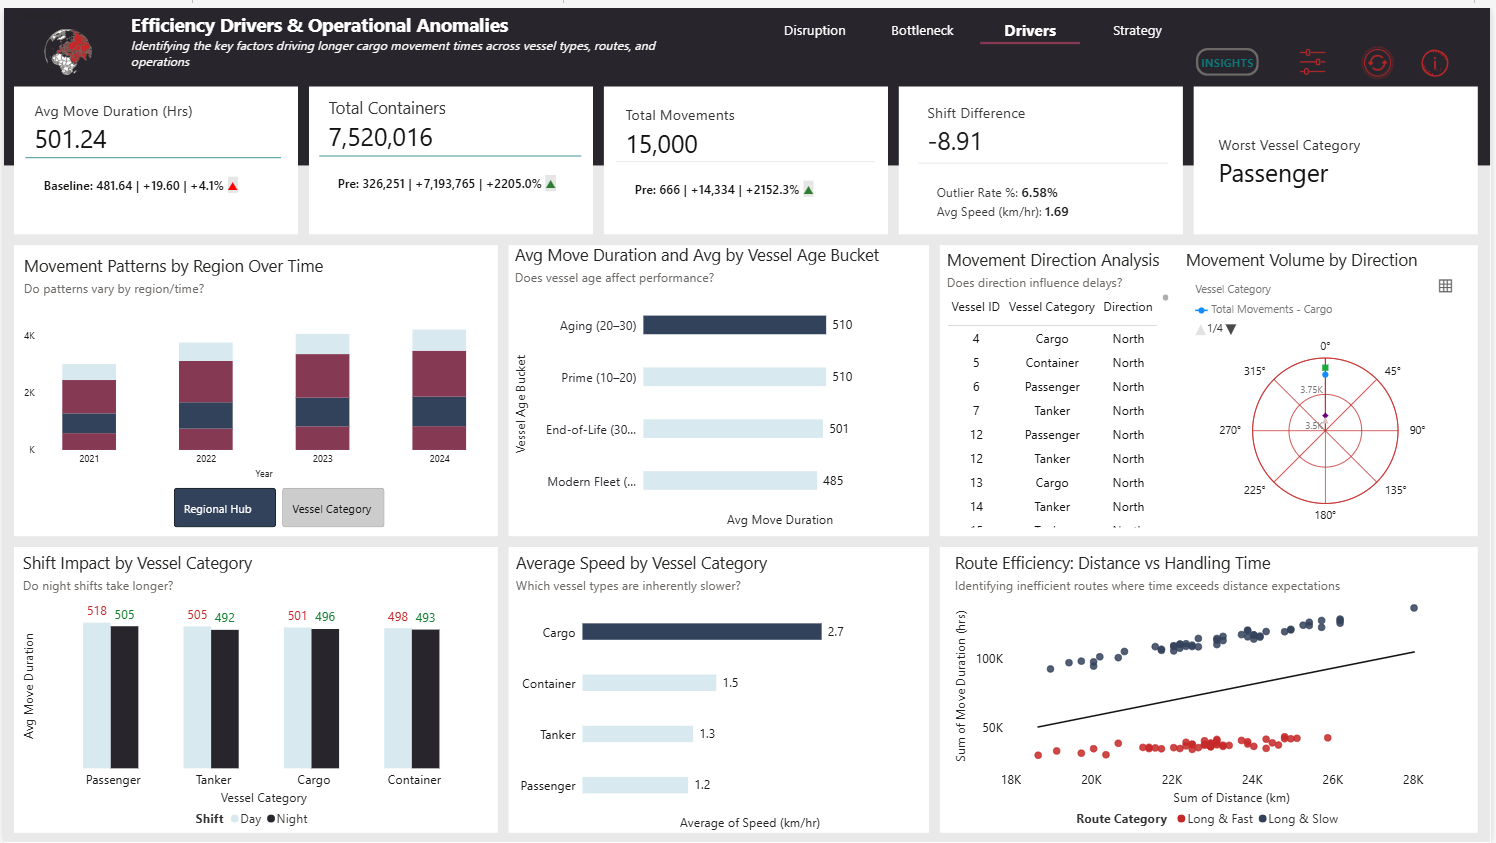
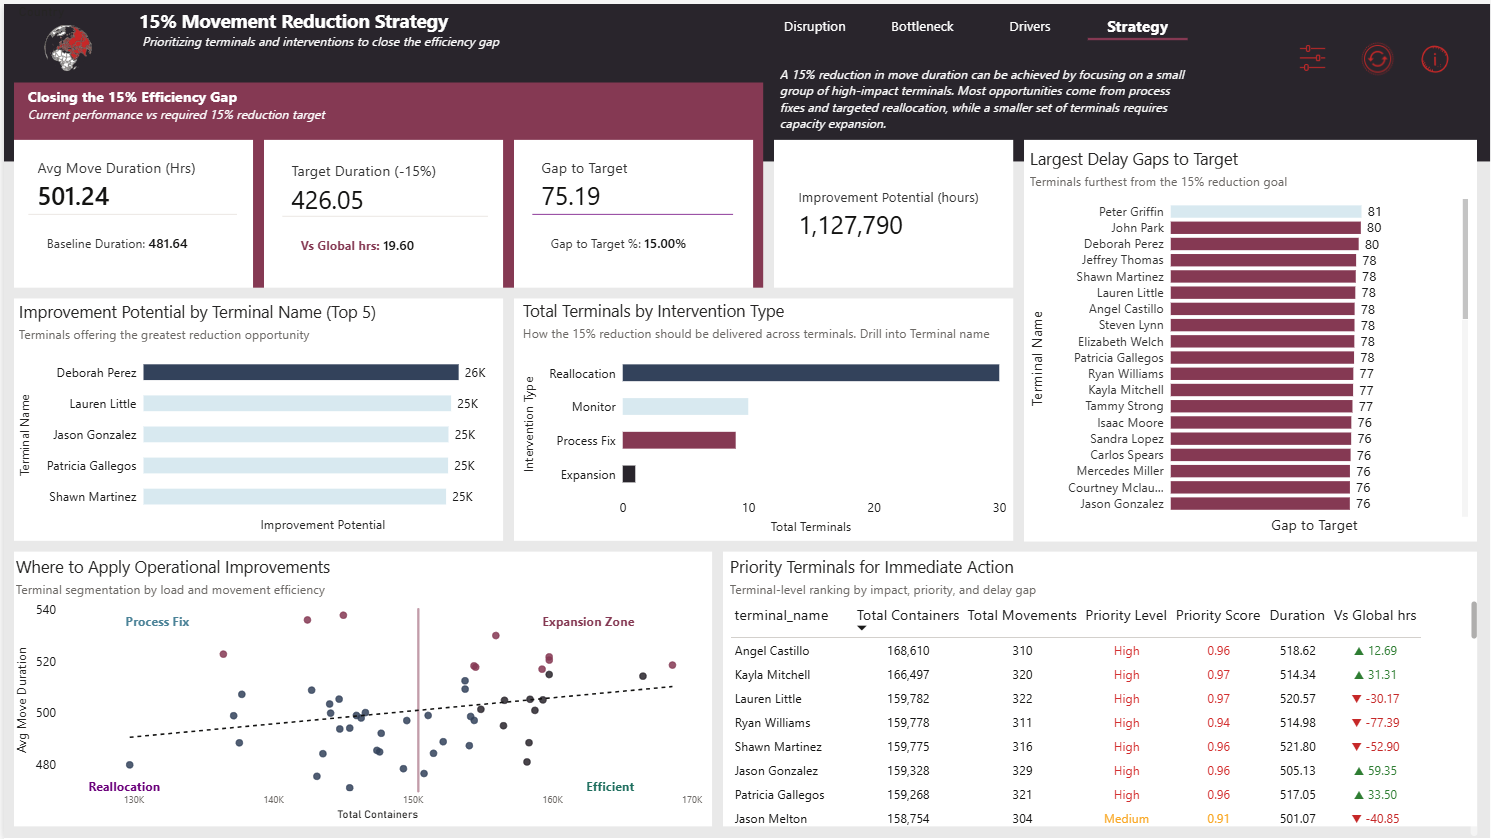
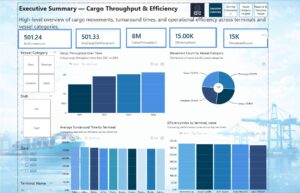
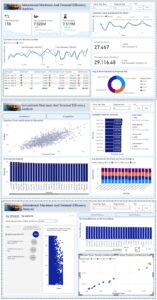
Page 1: Overview This page provides a high-level view of the impact of the disruption on cargo movement. Movement durations spiked during the disruption and gradually stabilized during recovery. By analyzing trends over time, across regions, and by vessel category, performance shifts become clear. Leveraging my mathematics background, I applied the Haversine formula to compute vessel distance and speed, enabling deeper insights into route efficiency and how physical movement patterns influenced operational delays across the network. Page 2 : Bottlenecks This page identifies infrastructure bottlenecks across terminals. High-volume terminals consistently exhibit longer movement durations, confirming capacity-driven congestion. A clear relationship between load and delay highlights operational strain. Vessel category analysis shows that cargo and container ships contribute the most to congestion. These insights pinpoint specific terminals that would benefit from expansion, enabling targeted interventions. Instead of broad infrastructure changes, this approach ensures resources are focused on the highest-impact areas to improve efficiency and reduce delays. Page 3: Drivers This page explores the key drivers behind inefficiencies. Day shifts consistently show longer movement durations than night shifts, indicating peak-hour operational pressure. Further analysis across vessel types and routing patterns reveals additional variation in performance. Using distance and speed derived from the Haversine formula, inefficient routes are identified where handling time exceeds expected travel behavior. These insights highlight that delays are influenced not only by terminal capacity but also by operational practices and routing inefficiencies. Page 4: Strategy The final page translates insights into action. A 15% reduction in movement duration is achievable by focusing on a small group of high-impact terminals. Most improvements come from process optimization and cargo reallocation, while only a few terminals require expansion. A composite priority score ranks terminals based on load, delay, and improvement potential, ensuring interventions are applied where they deliver the greatest value and operational impact.
Contact our team

16 Upper Woburn Place, London, Greater London, WC1H 0AF, United Kingdom


 Akindele Victor Omolayo
 Gyanankur

 Ayobami
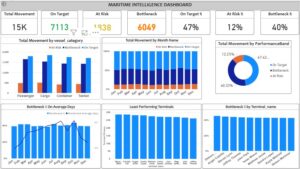
 ewoma agbanoma
 Nana Kwesi Safo
 Tejasvi Suhagiya