
Join a community of the most creative Business Intelligence Professionals
Join a community of the most creative Business Intelligence Professionals
Find data professionals with skills verified through real challenge performance.
Browse Talent DirectoryCreate realistic synthetic data for training, testing, and demonstrations.
Explore Dataset Generator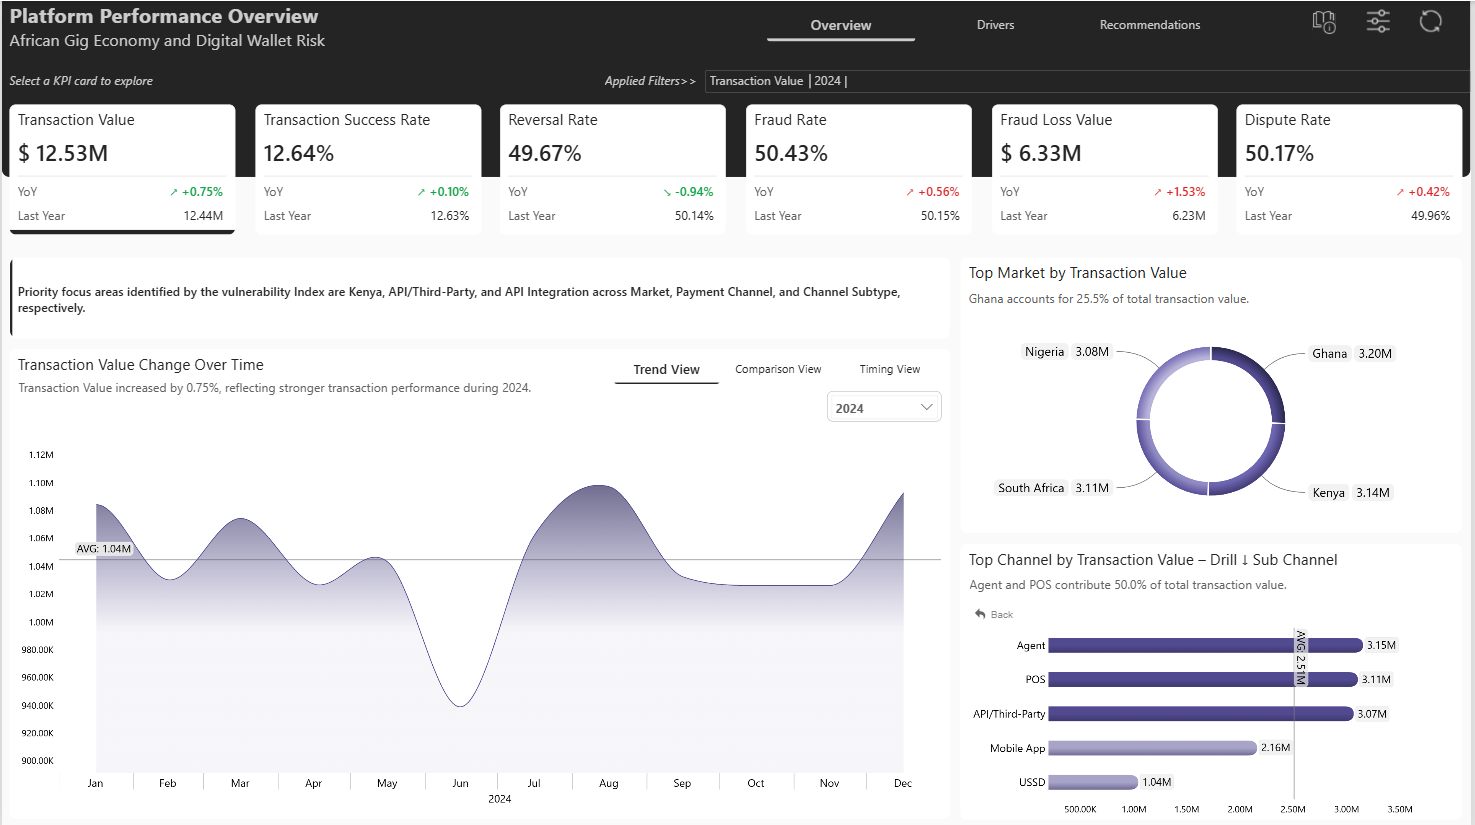
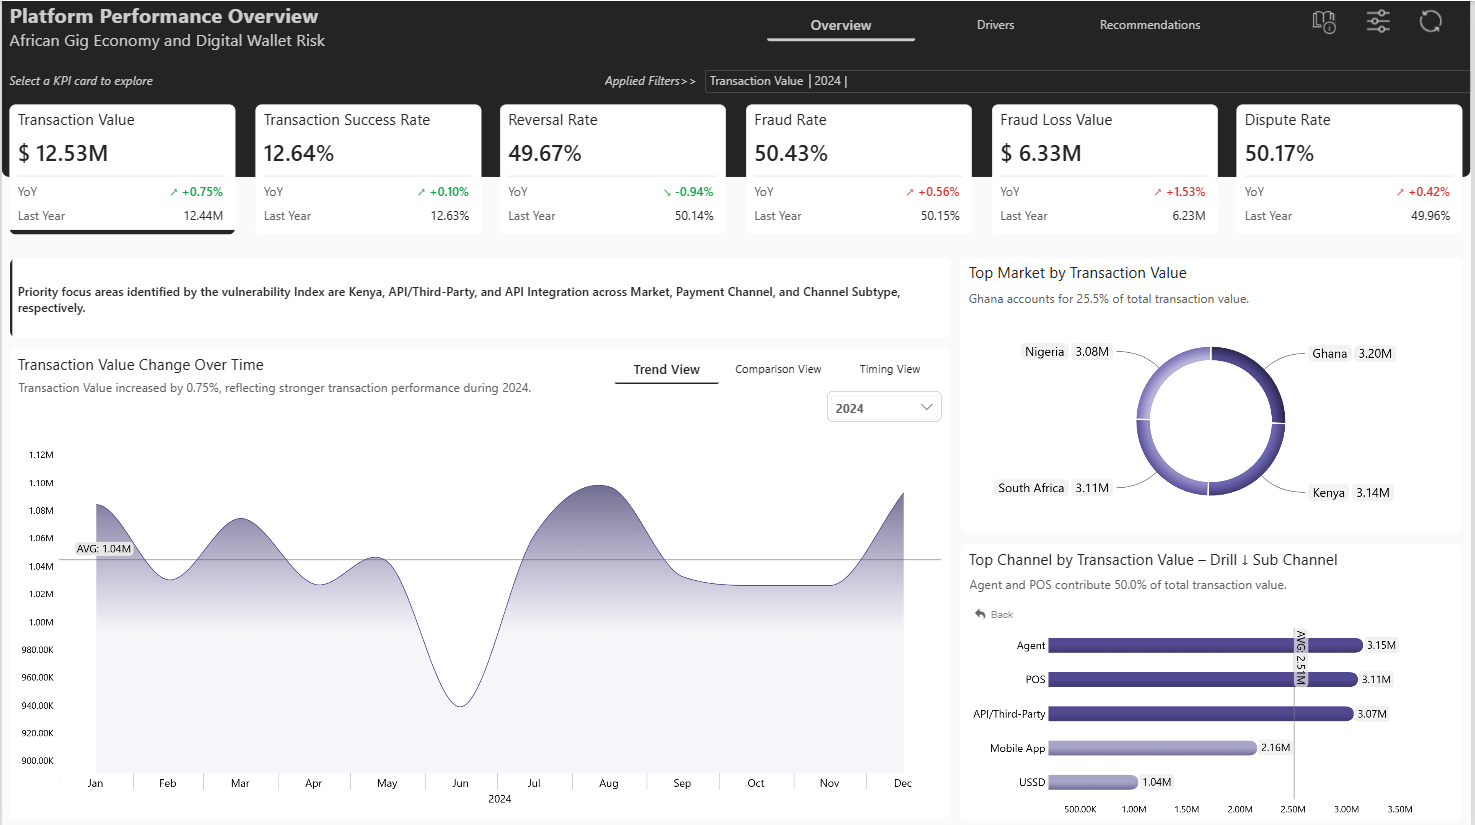
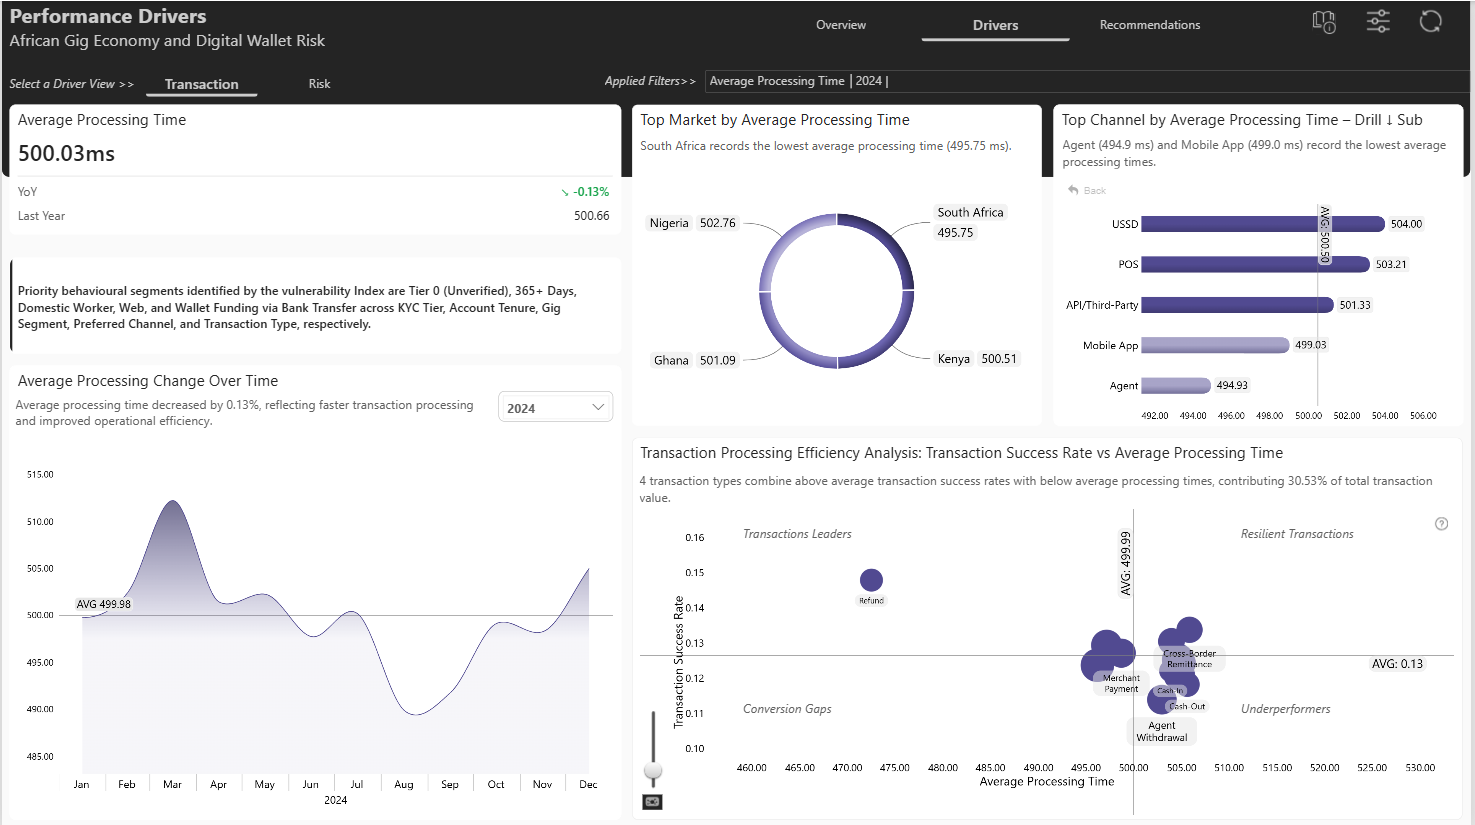
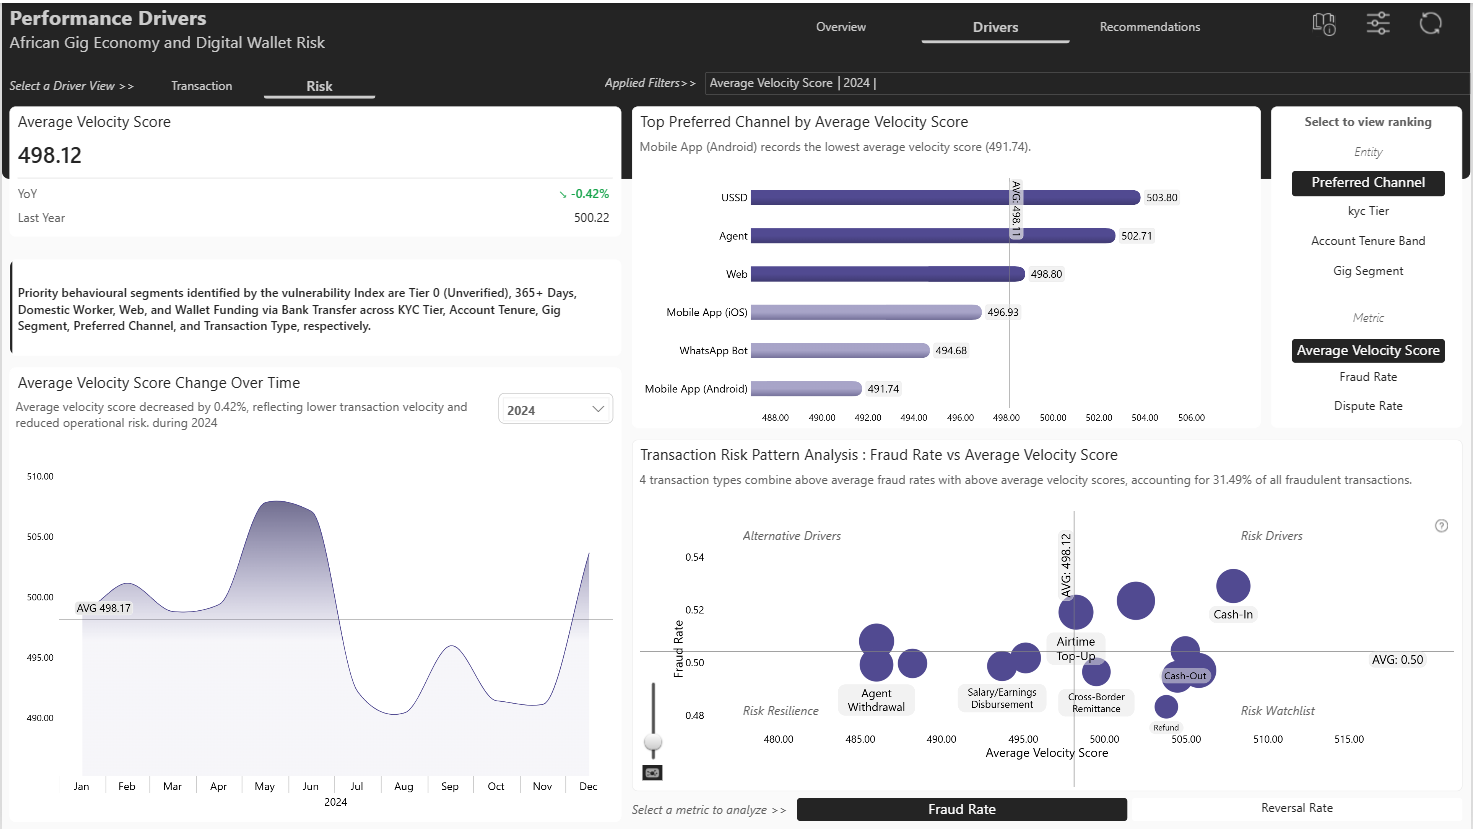
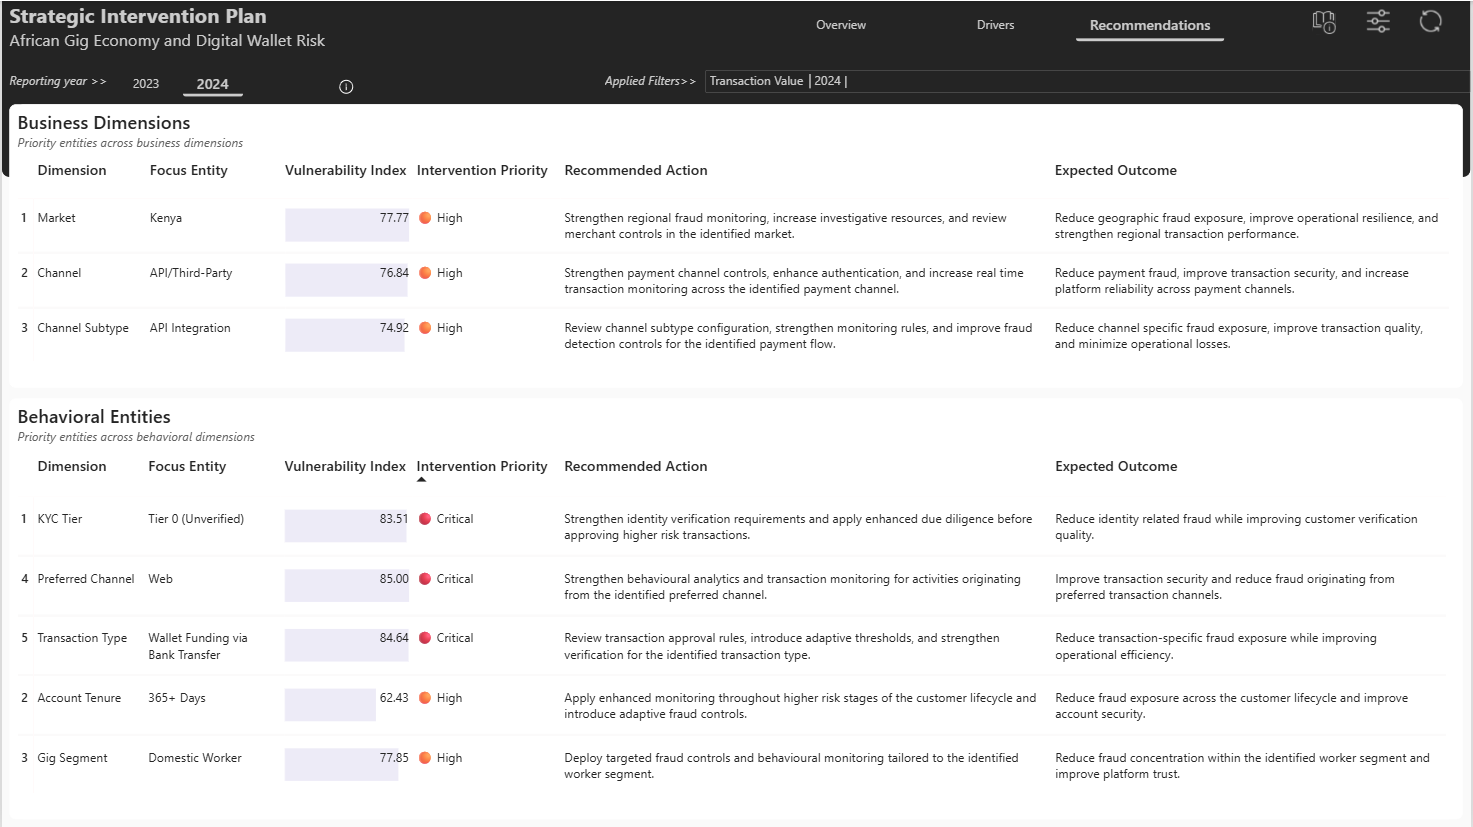
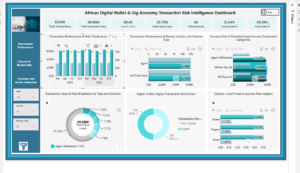
My approach was designed around the executive decision: where is risk concentrated, why is it occurring, and where should intervention be prioritised? I structured the analysis into three stages: establish performance, identify risk drivers, and prioritise intervention. 1. Platform Performance Overview The Overview establishes the current state using Transaction Value, Success Rate, Fraud Rate, Fraud Loss Value, Dispute Rate and Reversal Rate, with year over year and trend analysis to identify deterioration and timing patterns. Market and channel comparisons then reveal where performance and risk are concentrated. A weighted Vulnerability Index, based on Fraud Rate, Fraud Loss Value, Dispute Rate and Reversal Rate, provides an overall view of the highest risk entities. 2. Performance Drivers The Drivers page moves from "what is happening" to "why it may be happening". I used two complementary views. The "Transaction view" evaluates processing efficiency through Average Processing Time and its relationship with Transaction Success Rate, comparing performance across markets, channels and sub channels. The "Risk view" evaluates behavioural risk through Average Velocity Score across Preferred Channel, KYC Tier, Account Tenure and Gig Segment, while connecting velocity with Fraud Rate and Reversal Rate. Parameter driven analysis allows risk outcomes to be compared across different behavioural dimensions. This provides evidence behind the risk concentrations identified on the Overview. 3. Strategic Intervention Plan The final stage converts the evidence into "prioritised action". I brought together the highest risk markets, channels and behavioural segments identified across the Overview and Drivers pages, then linked each priority to a recommended intervention and expected outcome. The objective was to establish a clear chain from Performance → Risk Concentration → Drivers → Evidence → Prioritisation → Intervention.
 Oji Ndidiamaka Cletus
0
Oji Ndidiamaka Cletus
0
 ugo nwasuruba
0
ugo nwasuruba
0
 Owais Khan
0
Owais Khan
0
 Lakshi Weerakkodige
0
Lakshi Weerakkodige
0
 Get In Touch
Contact our team

16 Upper Woburn Place, London, Greater London, WC1H 0AF, United Kingdom




 Agbata Dickson Ukolojo
 Kate Ch
 Chinemelum Nwaeze
 Gyanankur