
Join a community of the most creative Business Intelligence Professionals
Join a community of the most creative Business Intelligence Professionals
Find data professionals with skills verified through real challenge performance.
Browse Talent DirectoryCreate realistic synthetic data for training, testing, and demonstrations.
Explore Dataset Generator
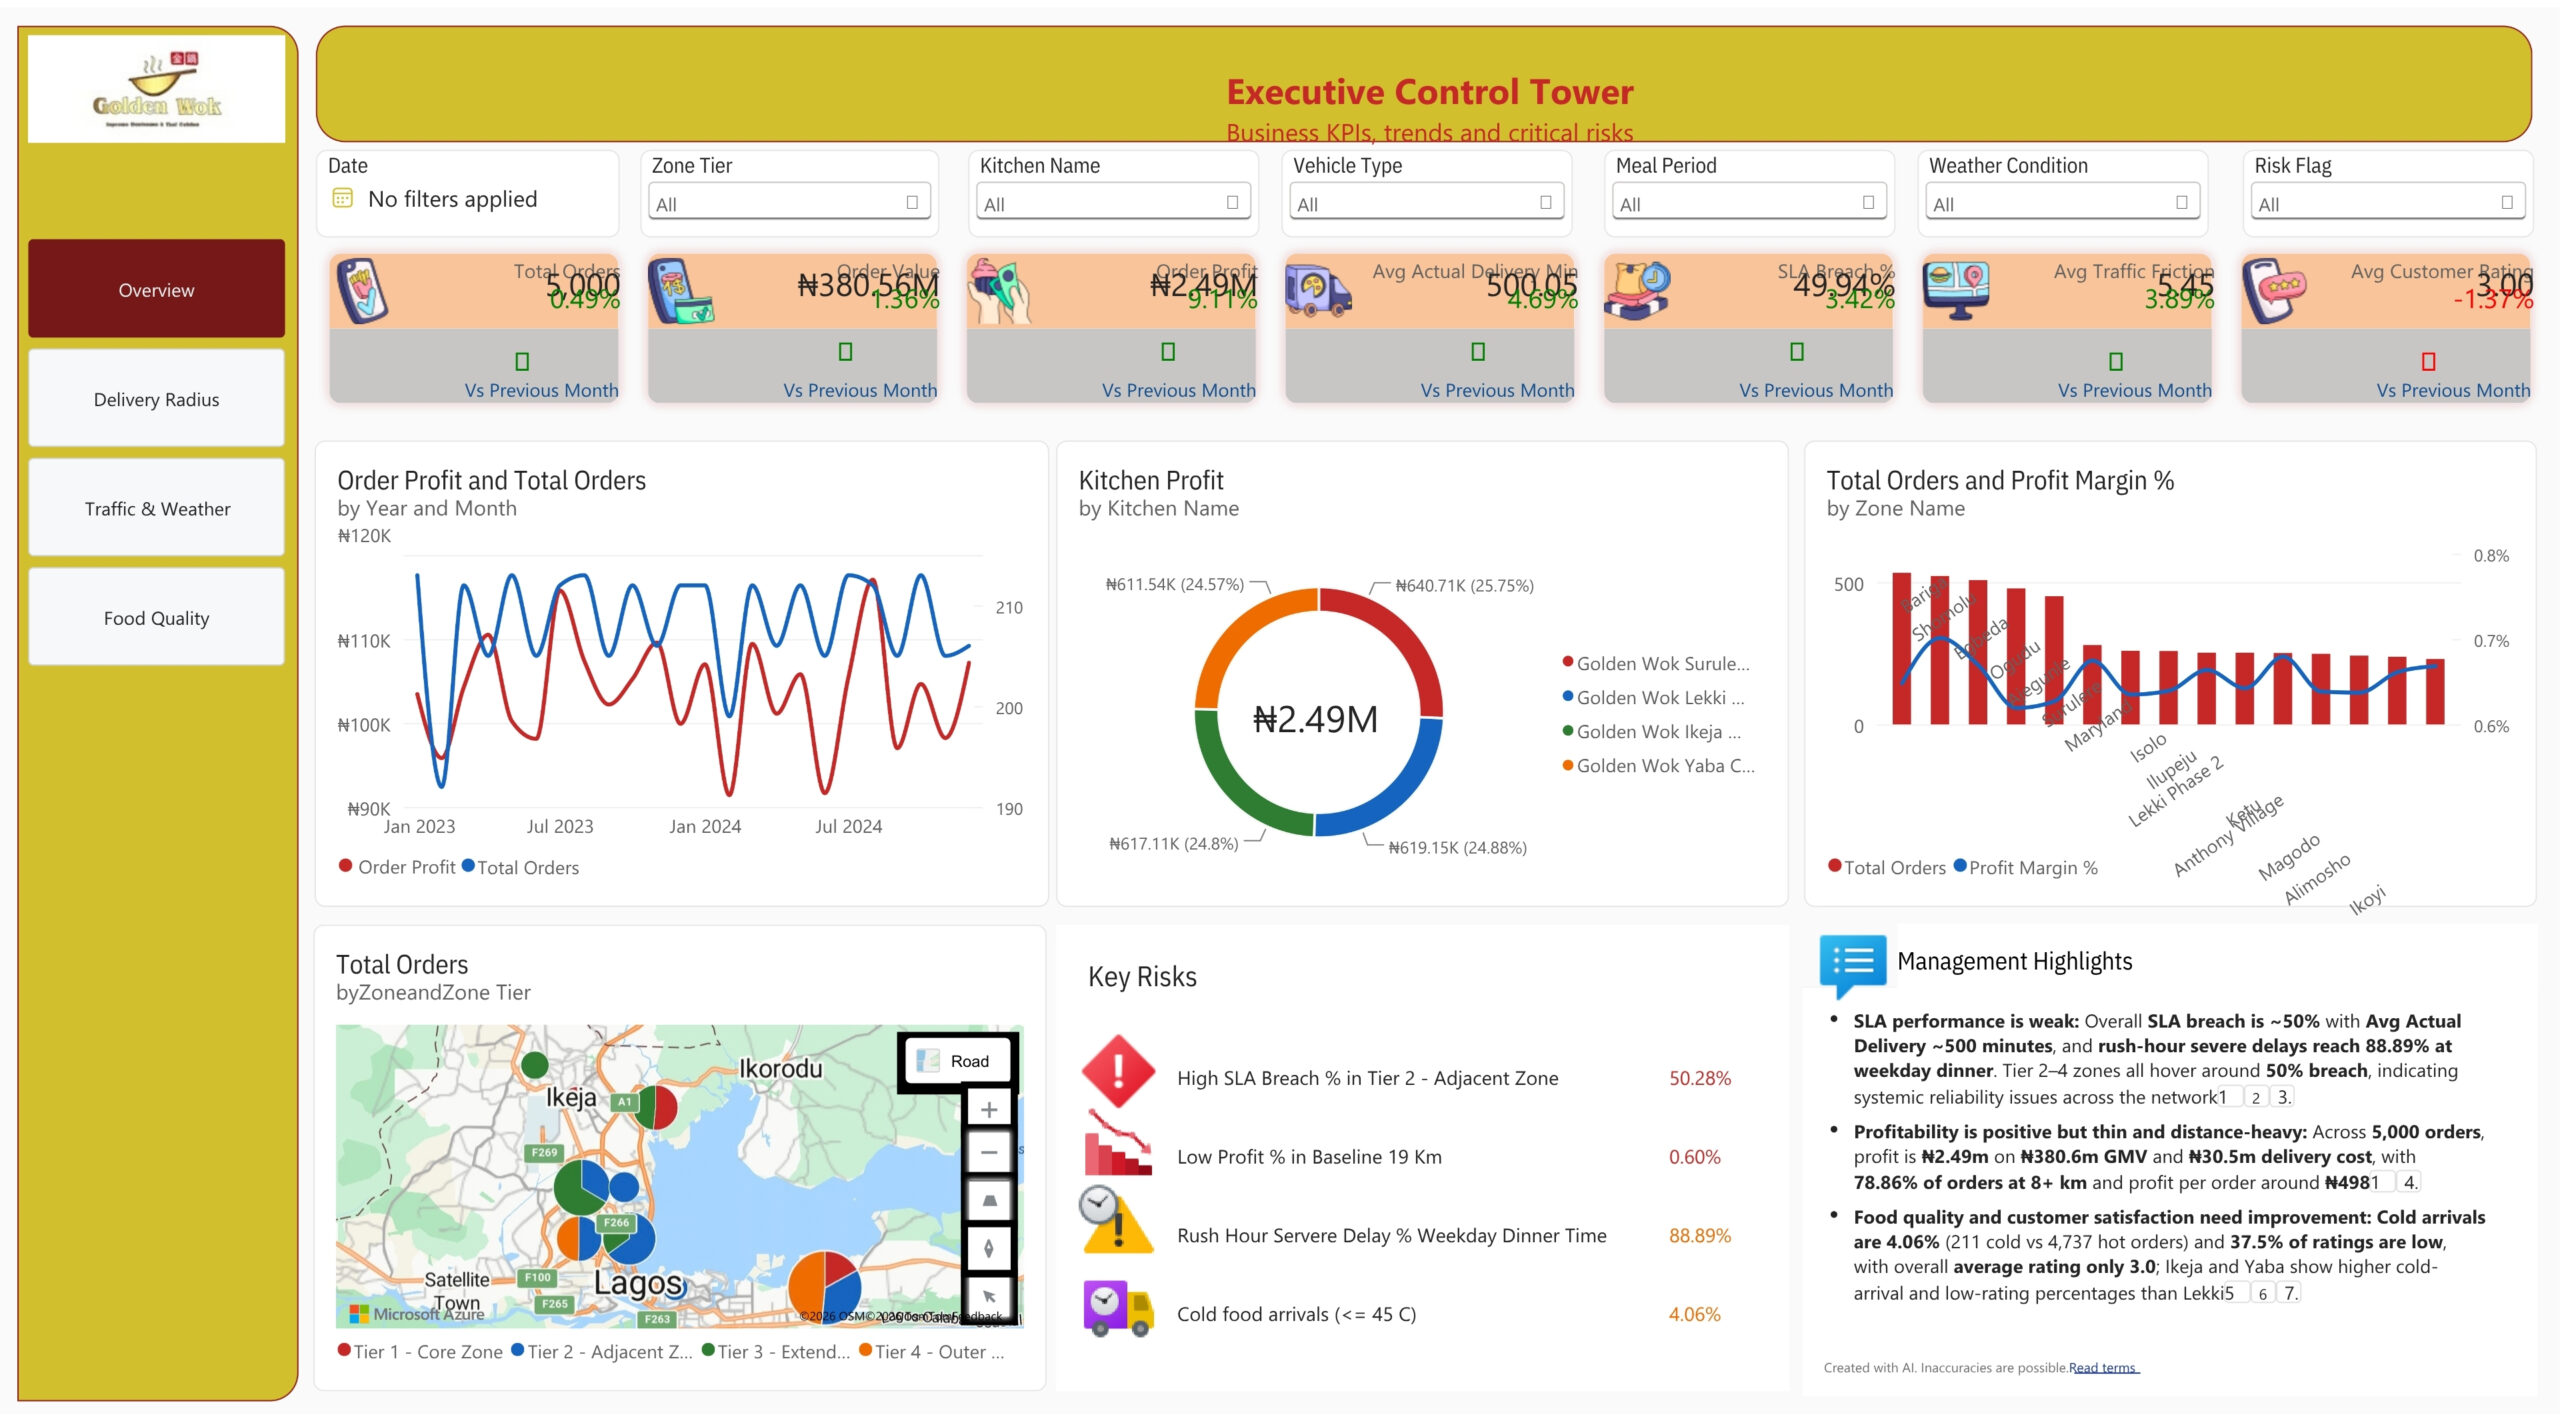
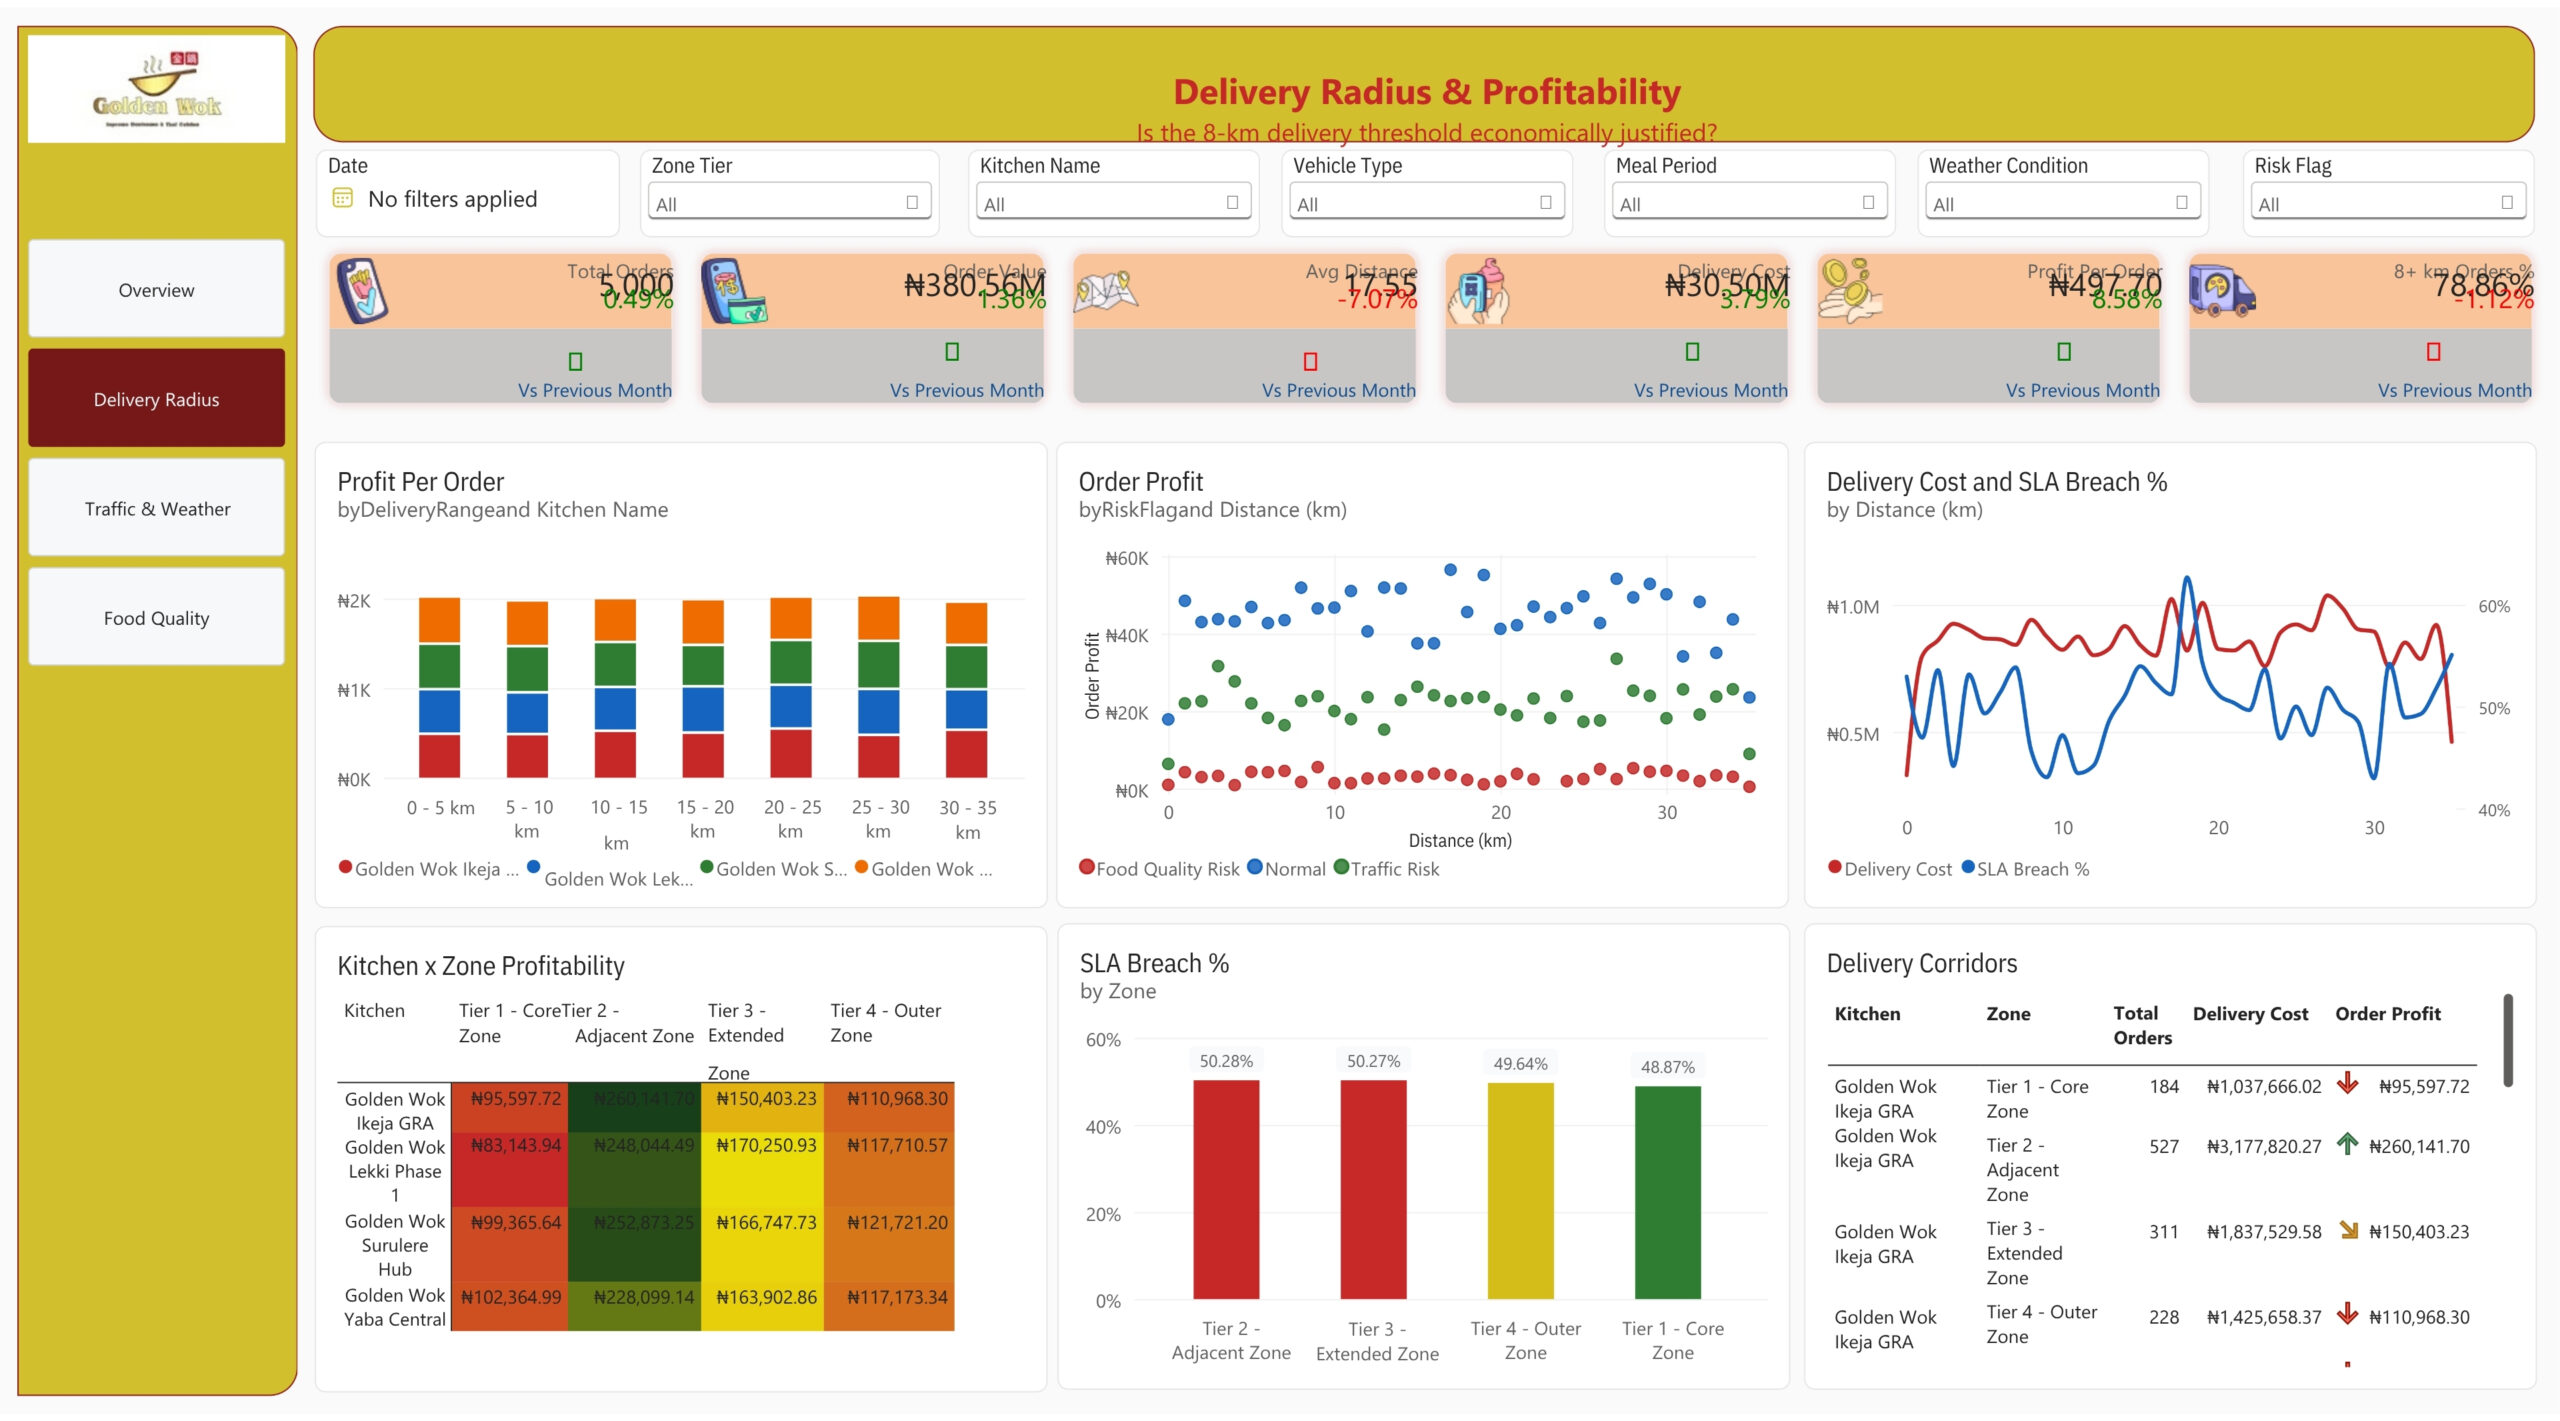
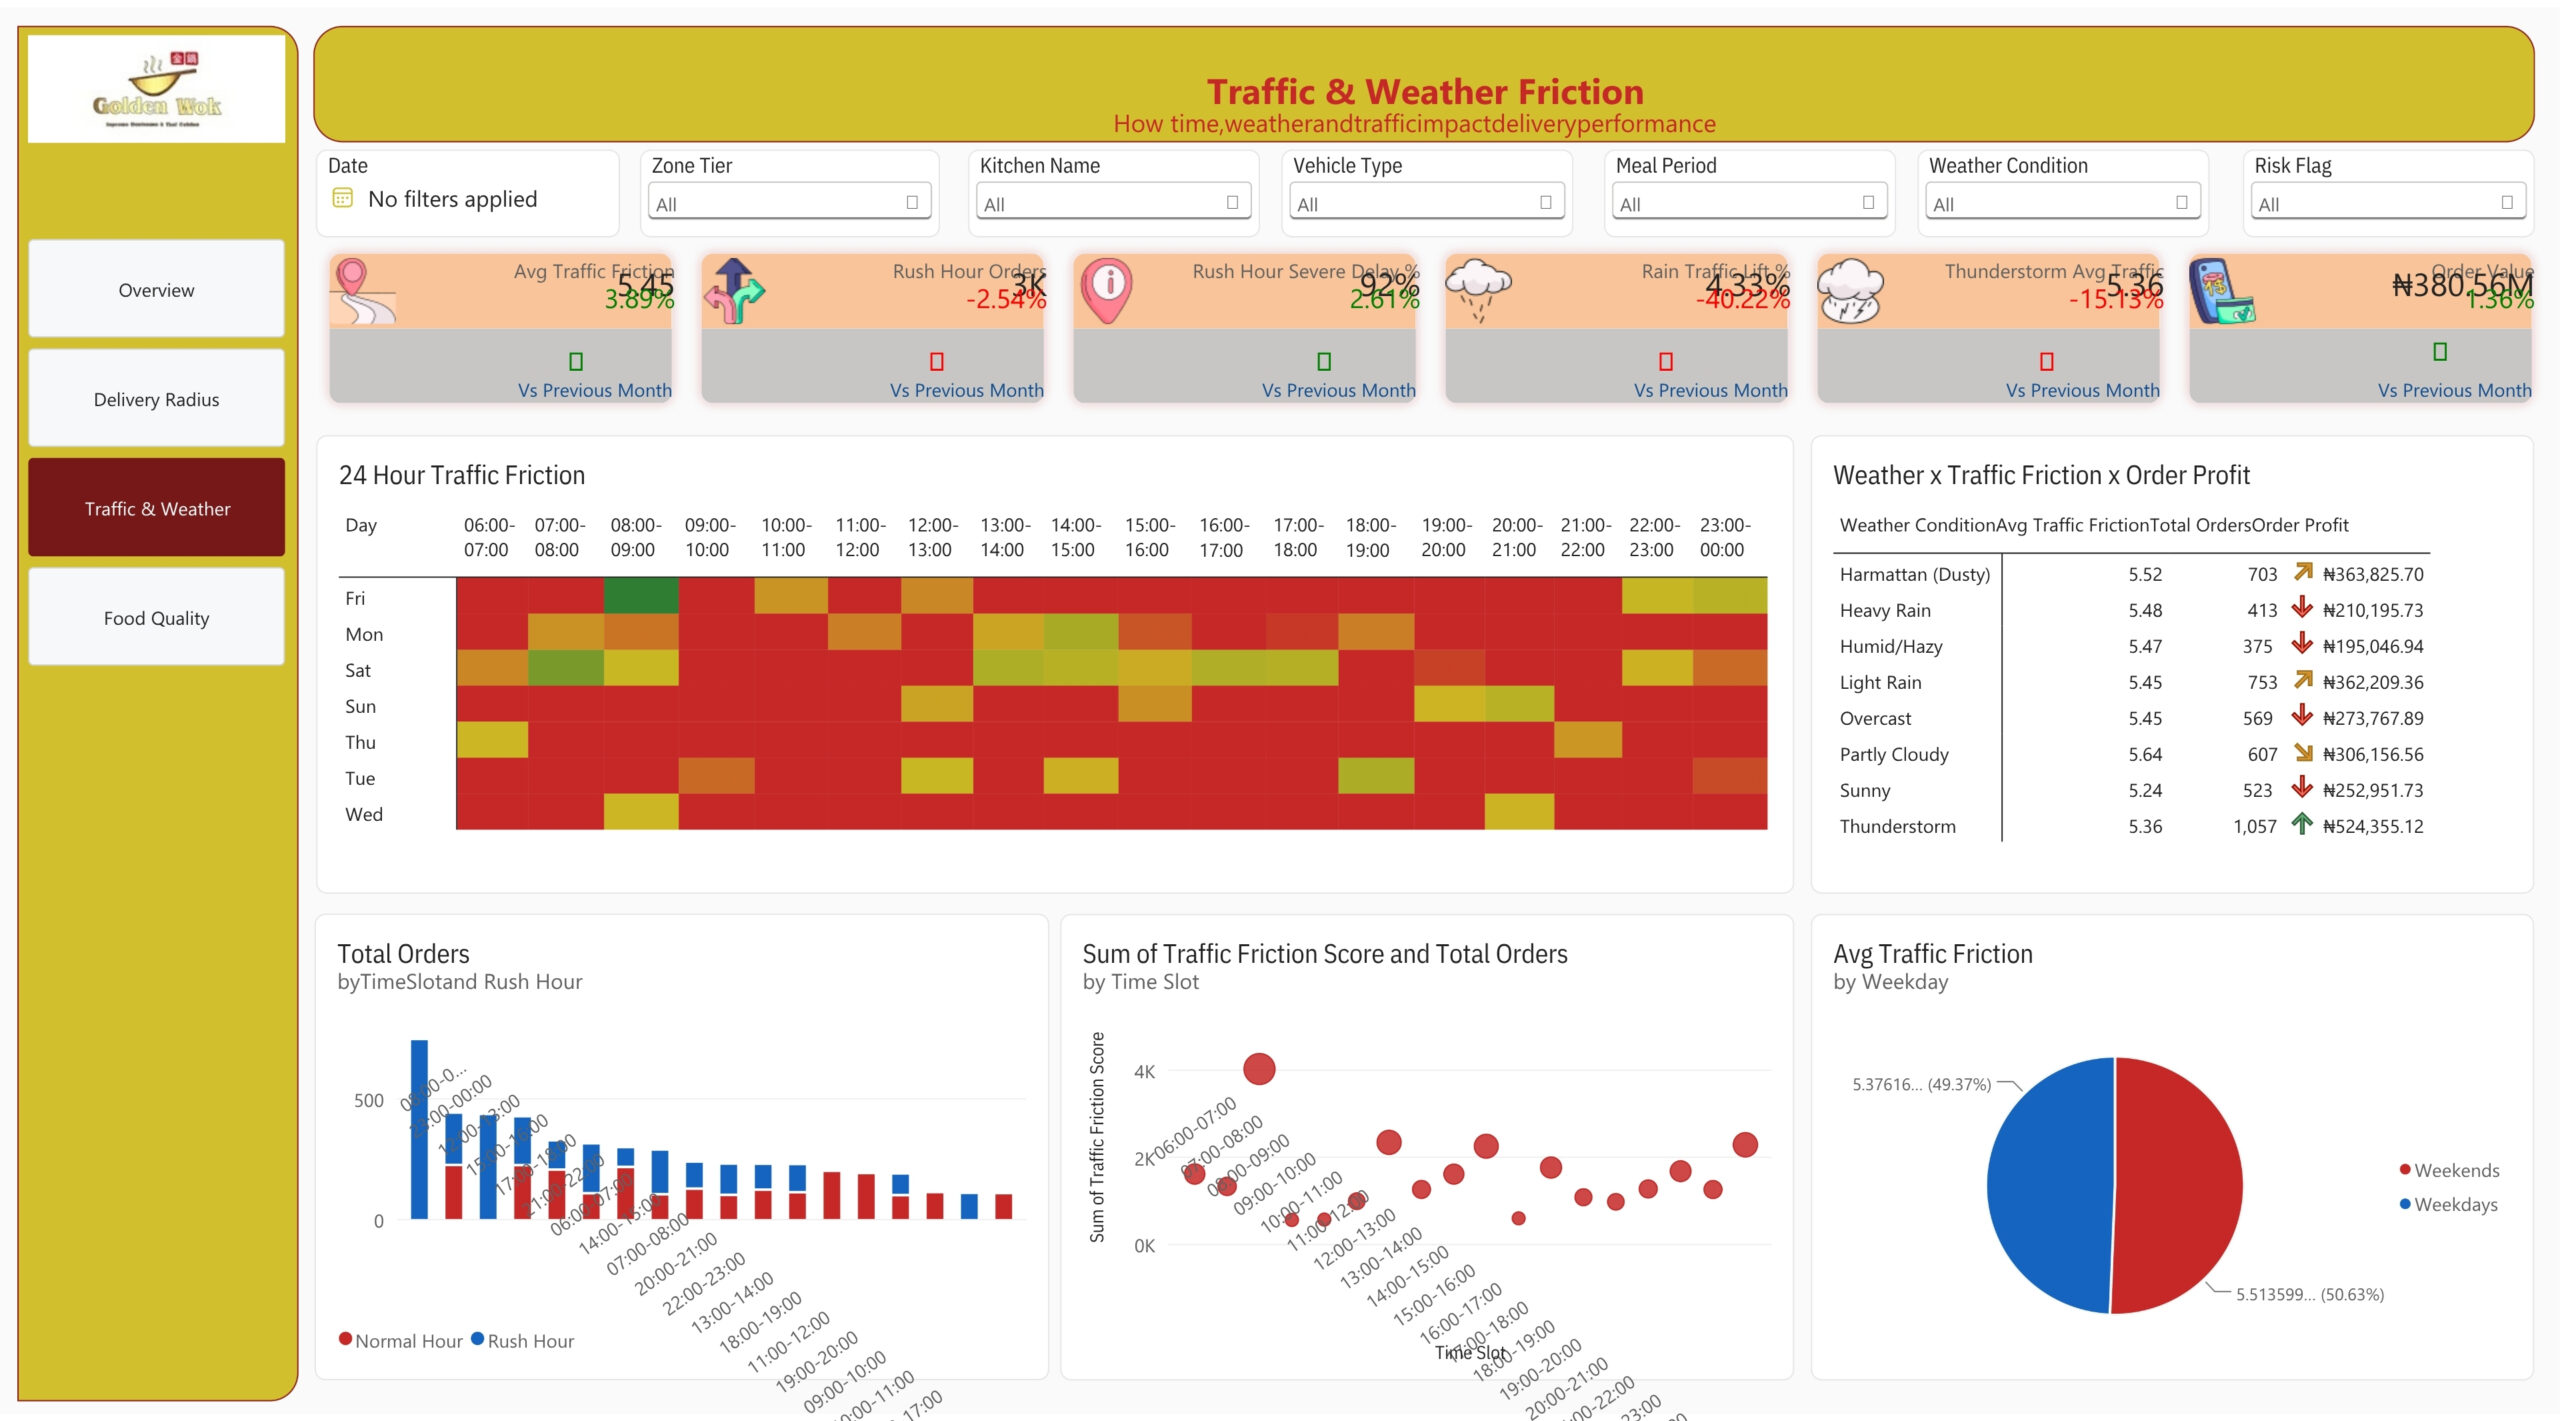
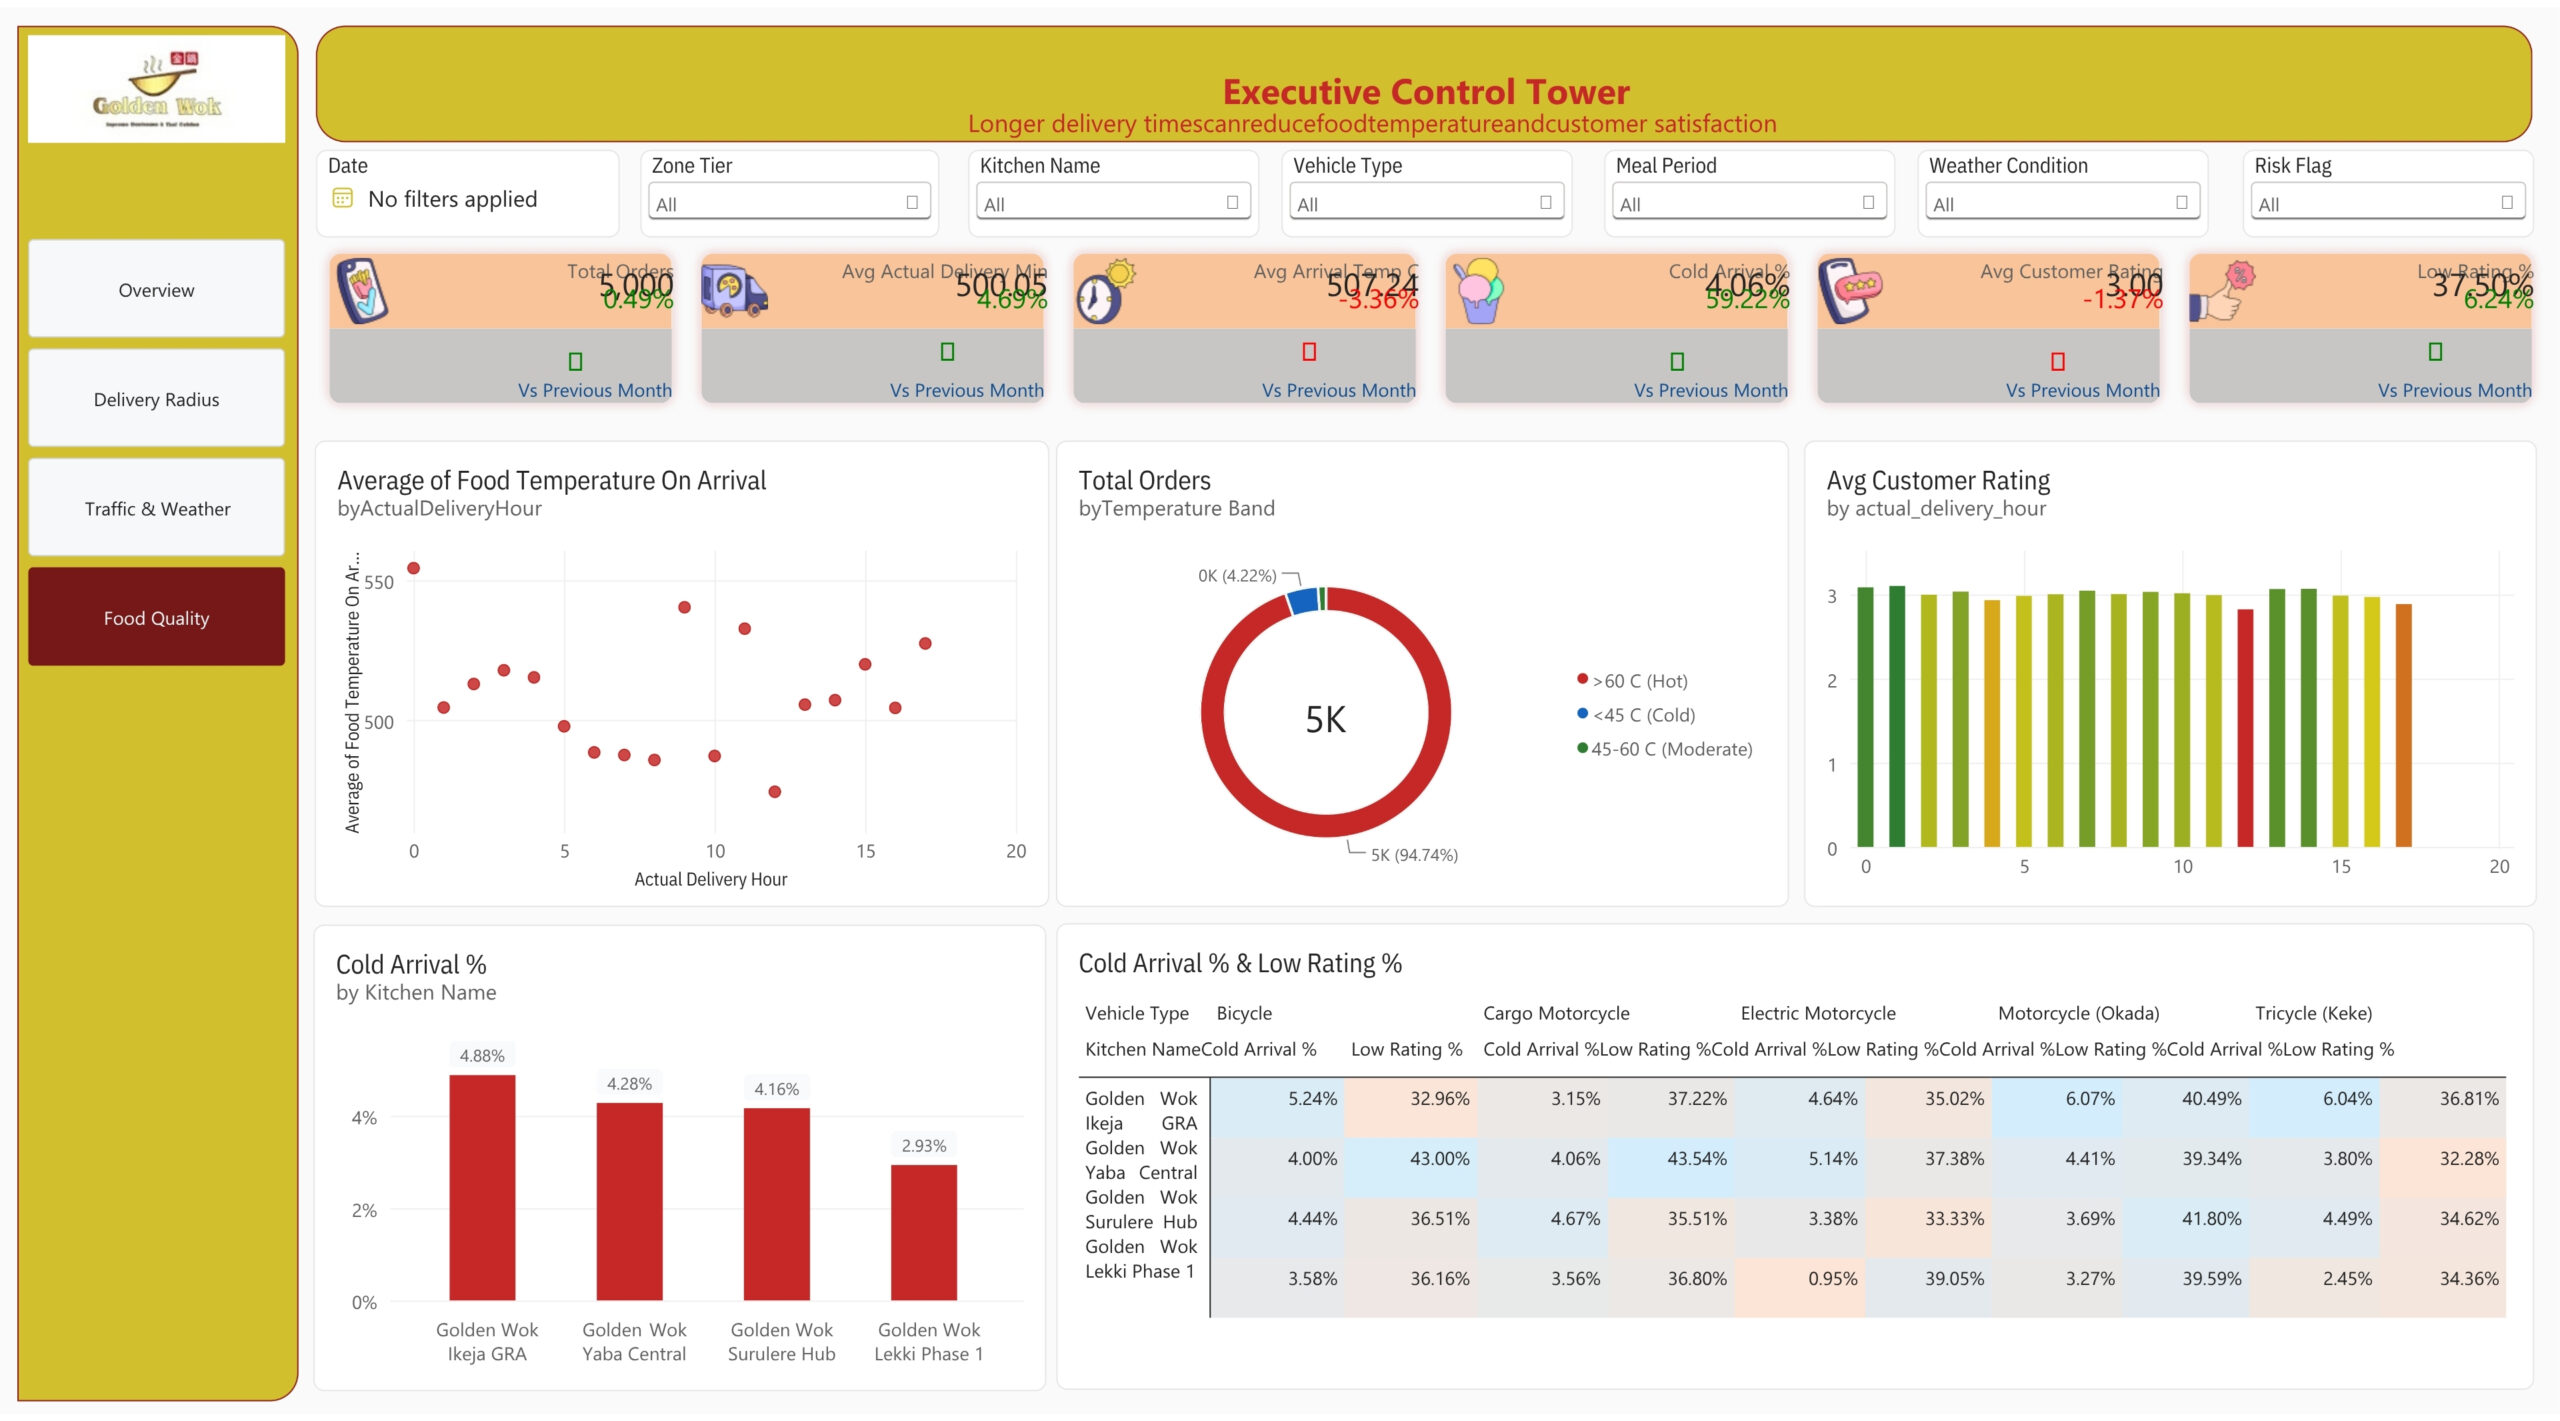
Key Findings -------------- 1. Delivery reliability is one of the most critical operational issues Nearly 50% of all orders broke SLA, and the average actual delivery time was approximately 500 minutes. In weekdays during dinner rush hours, delays exceeded 88.89%. 2. The delivery company is profitable, but margin is narrow During 5,000 orders: ₦380.56M order value ₦30.5M delivery cost ₦2.49M order profit Average profit per order is about ₦498 78.86% of orders delivered over 8+ km. One of the main questions raised by the analysis was the following: "From what point onward, does the delivery distance negatively impact profitability?" Dashboard thus focuses on delivery profitability, costs, SLA compliance, and corridors between kitchens and zones. 3. It is essential to consider the conditions related to traffic and rush hours According to the analysis, there is a significant level of operational friction in rush hours, as the dashboard pays particular attention to rush hour severe delay and analyzes the traffic friction within different time slots, weekdays, and weather. 4. Customer experience should be considered Overall customer rating score is 3.0, while 37.5% of the scores were low. 4.06% of orders were cold arrivals. This analysis provides a breakdown of the cold arrival and low rating performance depending on kitchen and vehicle type to make certain operational interventions.
 Get In Touch
Contact our team

16 Upper Woburn Place, London, Greater London, WC1H 0AF, United Kingdom




 Nina Ikpe
 Eamon McAllister
 REZGUI TEJEDDINE
 Fiza Syed