Join a community of the most creative Business Intelligence Professionals
Join a community of the most creative Business Intelligence Professionals
View the DataDNA Data Visualisation portfolios below
Browse AI-reviewed portfolios from our global community of data professionals
Analyzed using SQL and used Powerbi for visualization. This project is clear and aim is to reduce the maritime logistics...
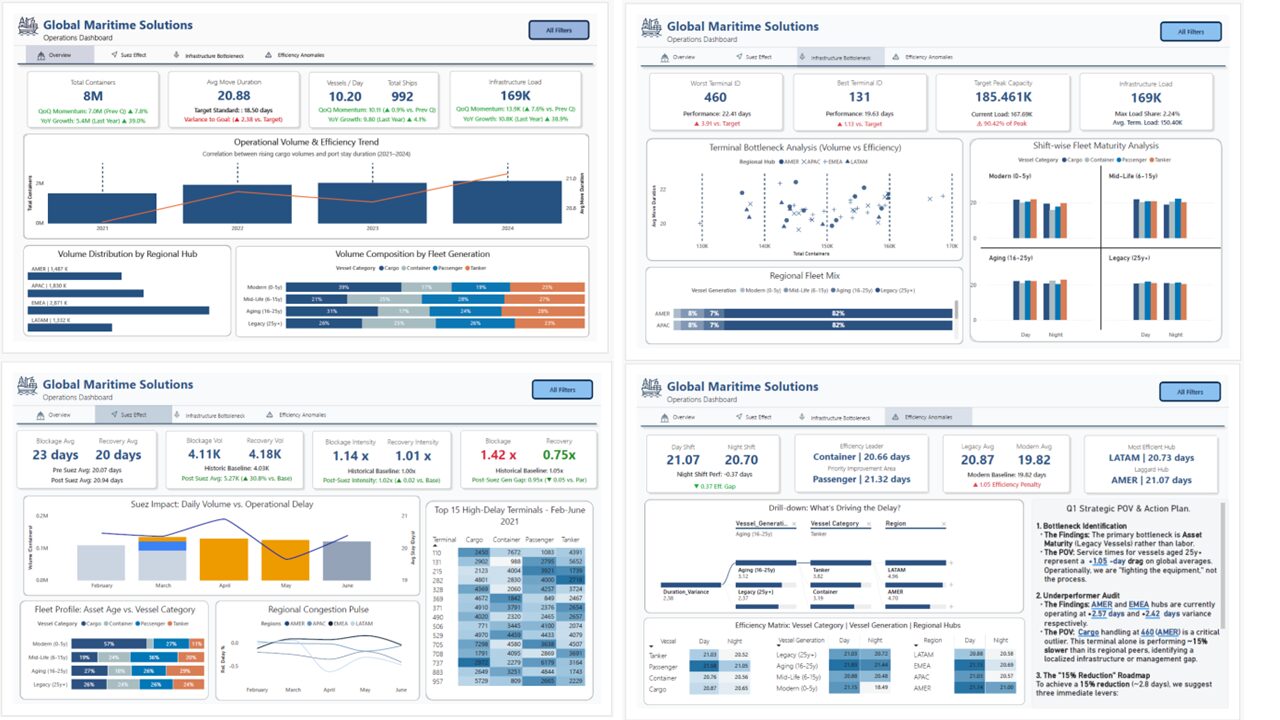
I used Power BI to find ways to make shipping 15% faster. Discovered that older ships cause a 1.05 –...

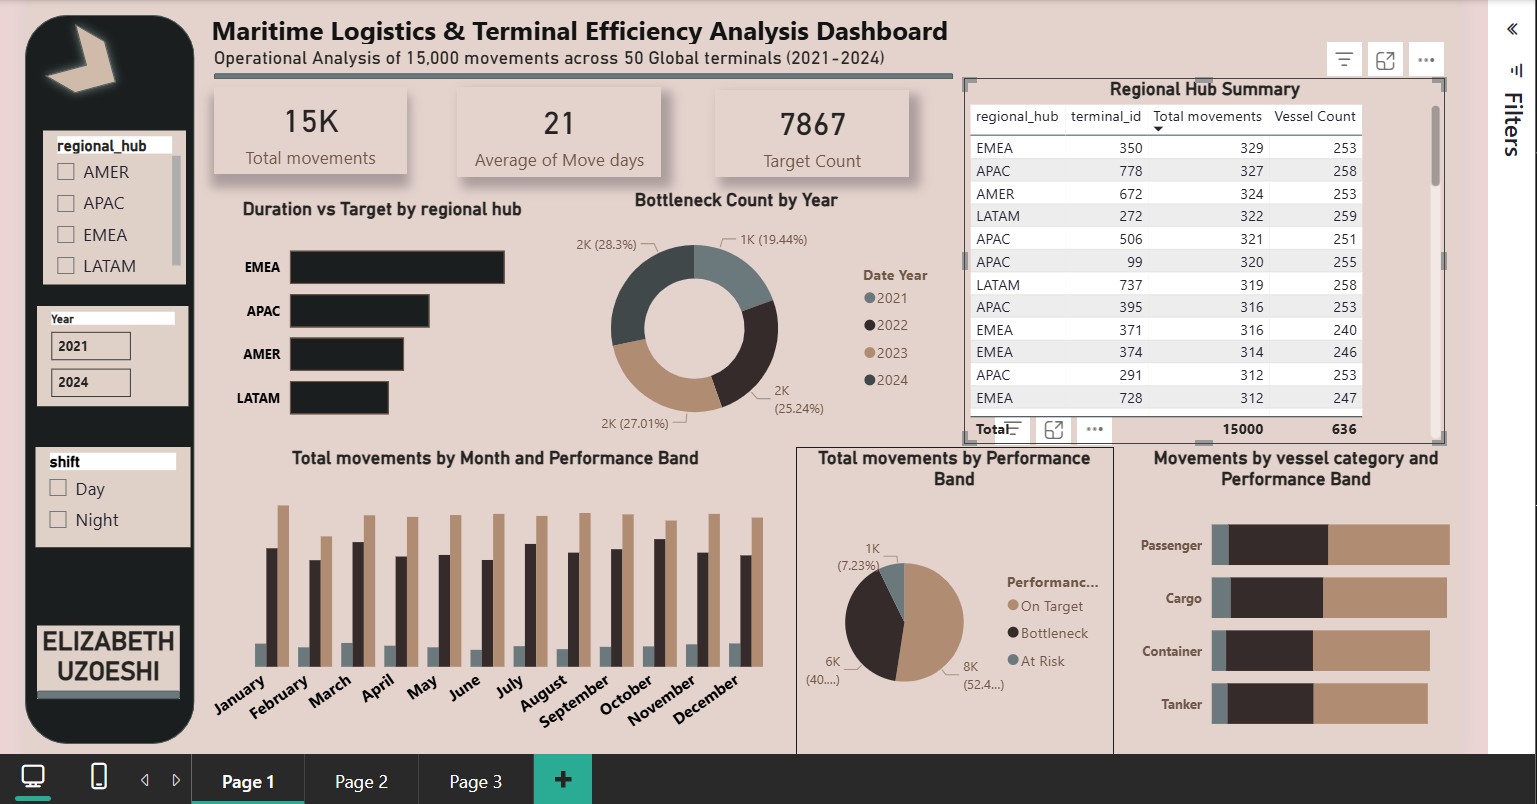
This report analyzes the operational inefficiencies and cargo handling inconsistencies across Global Maritime Solutions’ terminals in the aftermath of the...
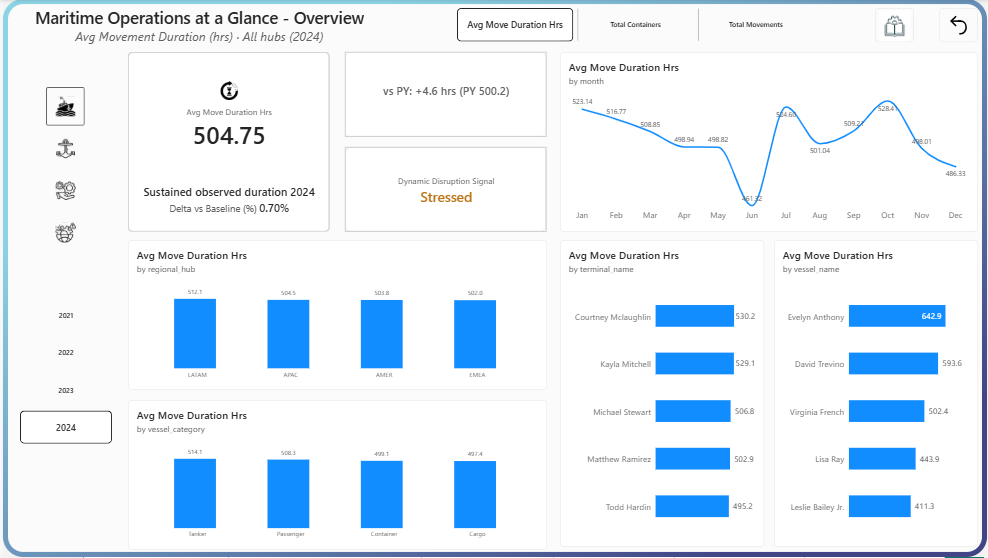
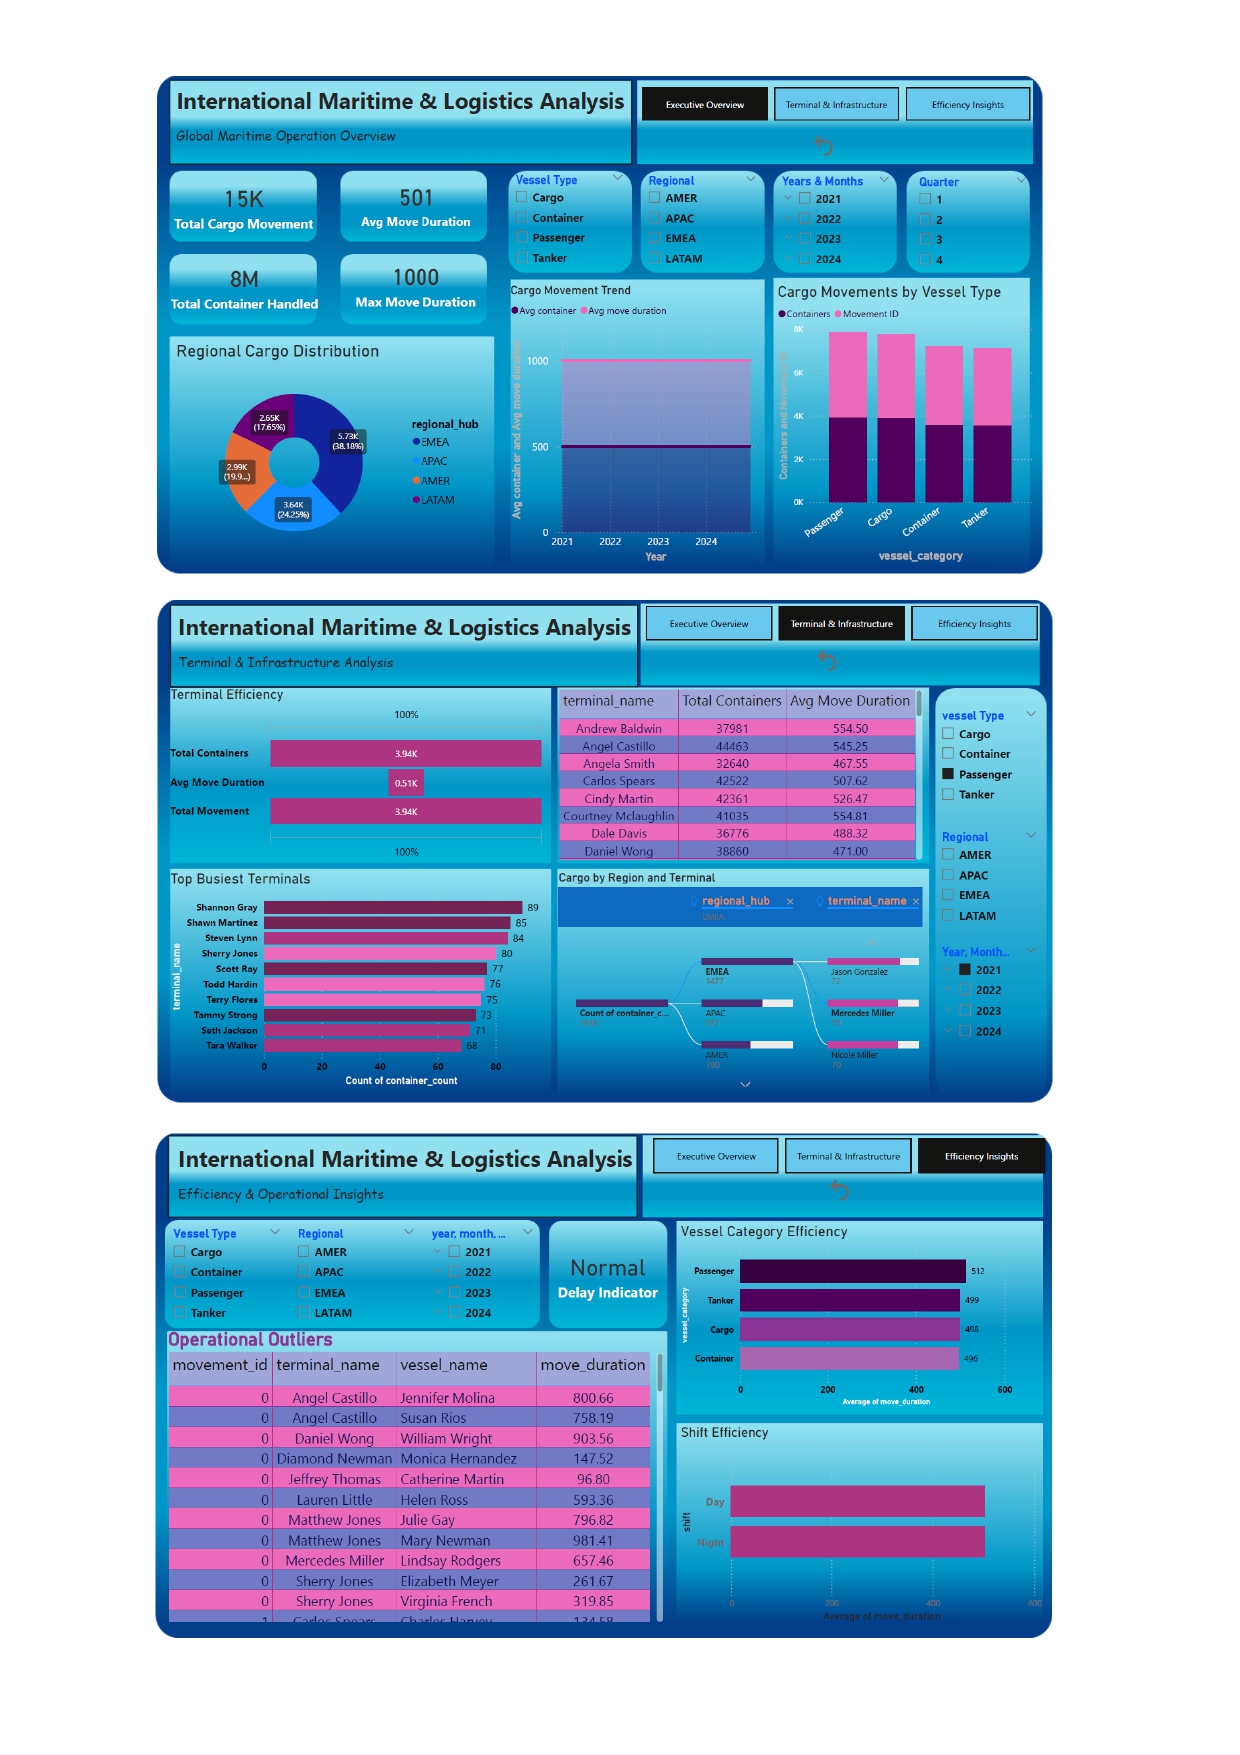
This report explores international maritime logistics efficiency across 4 pages — from network-wide operations and infrastructure bottlenecks to service reliability...
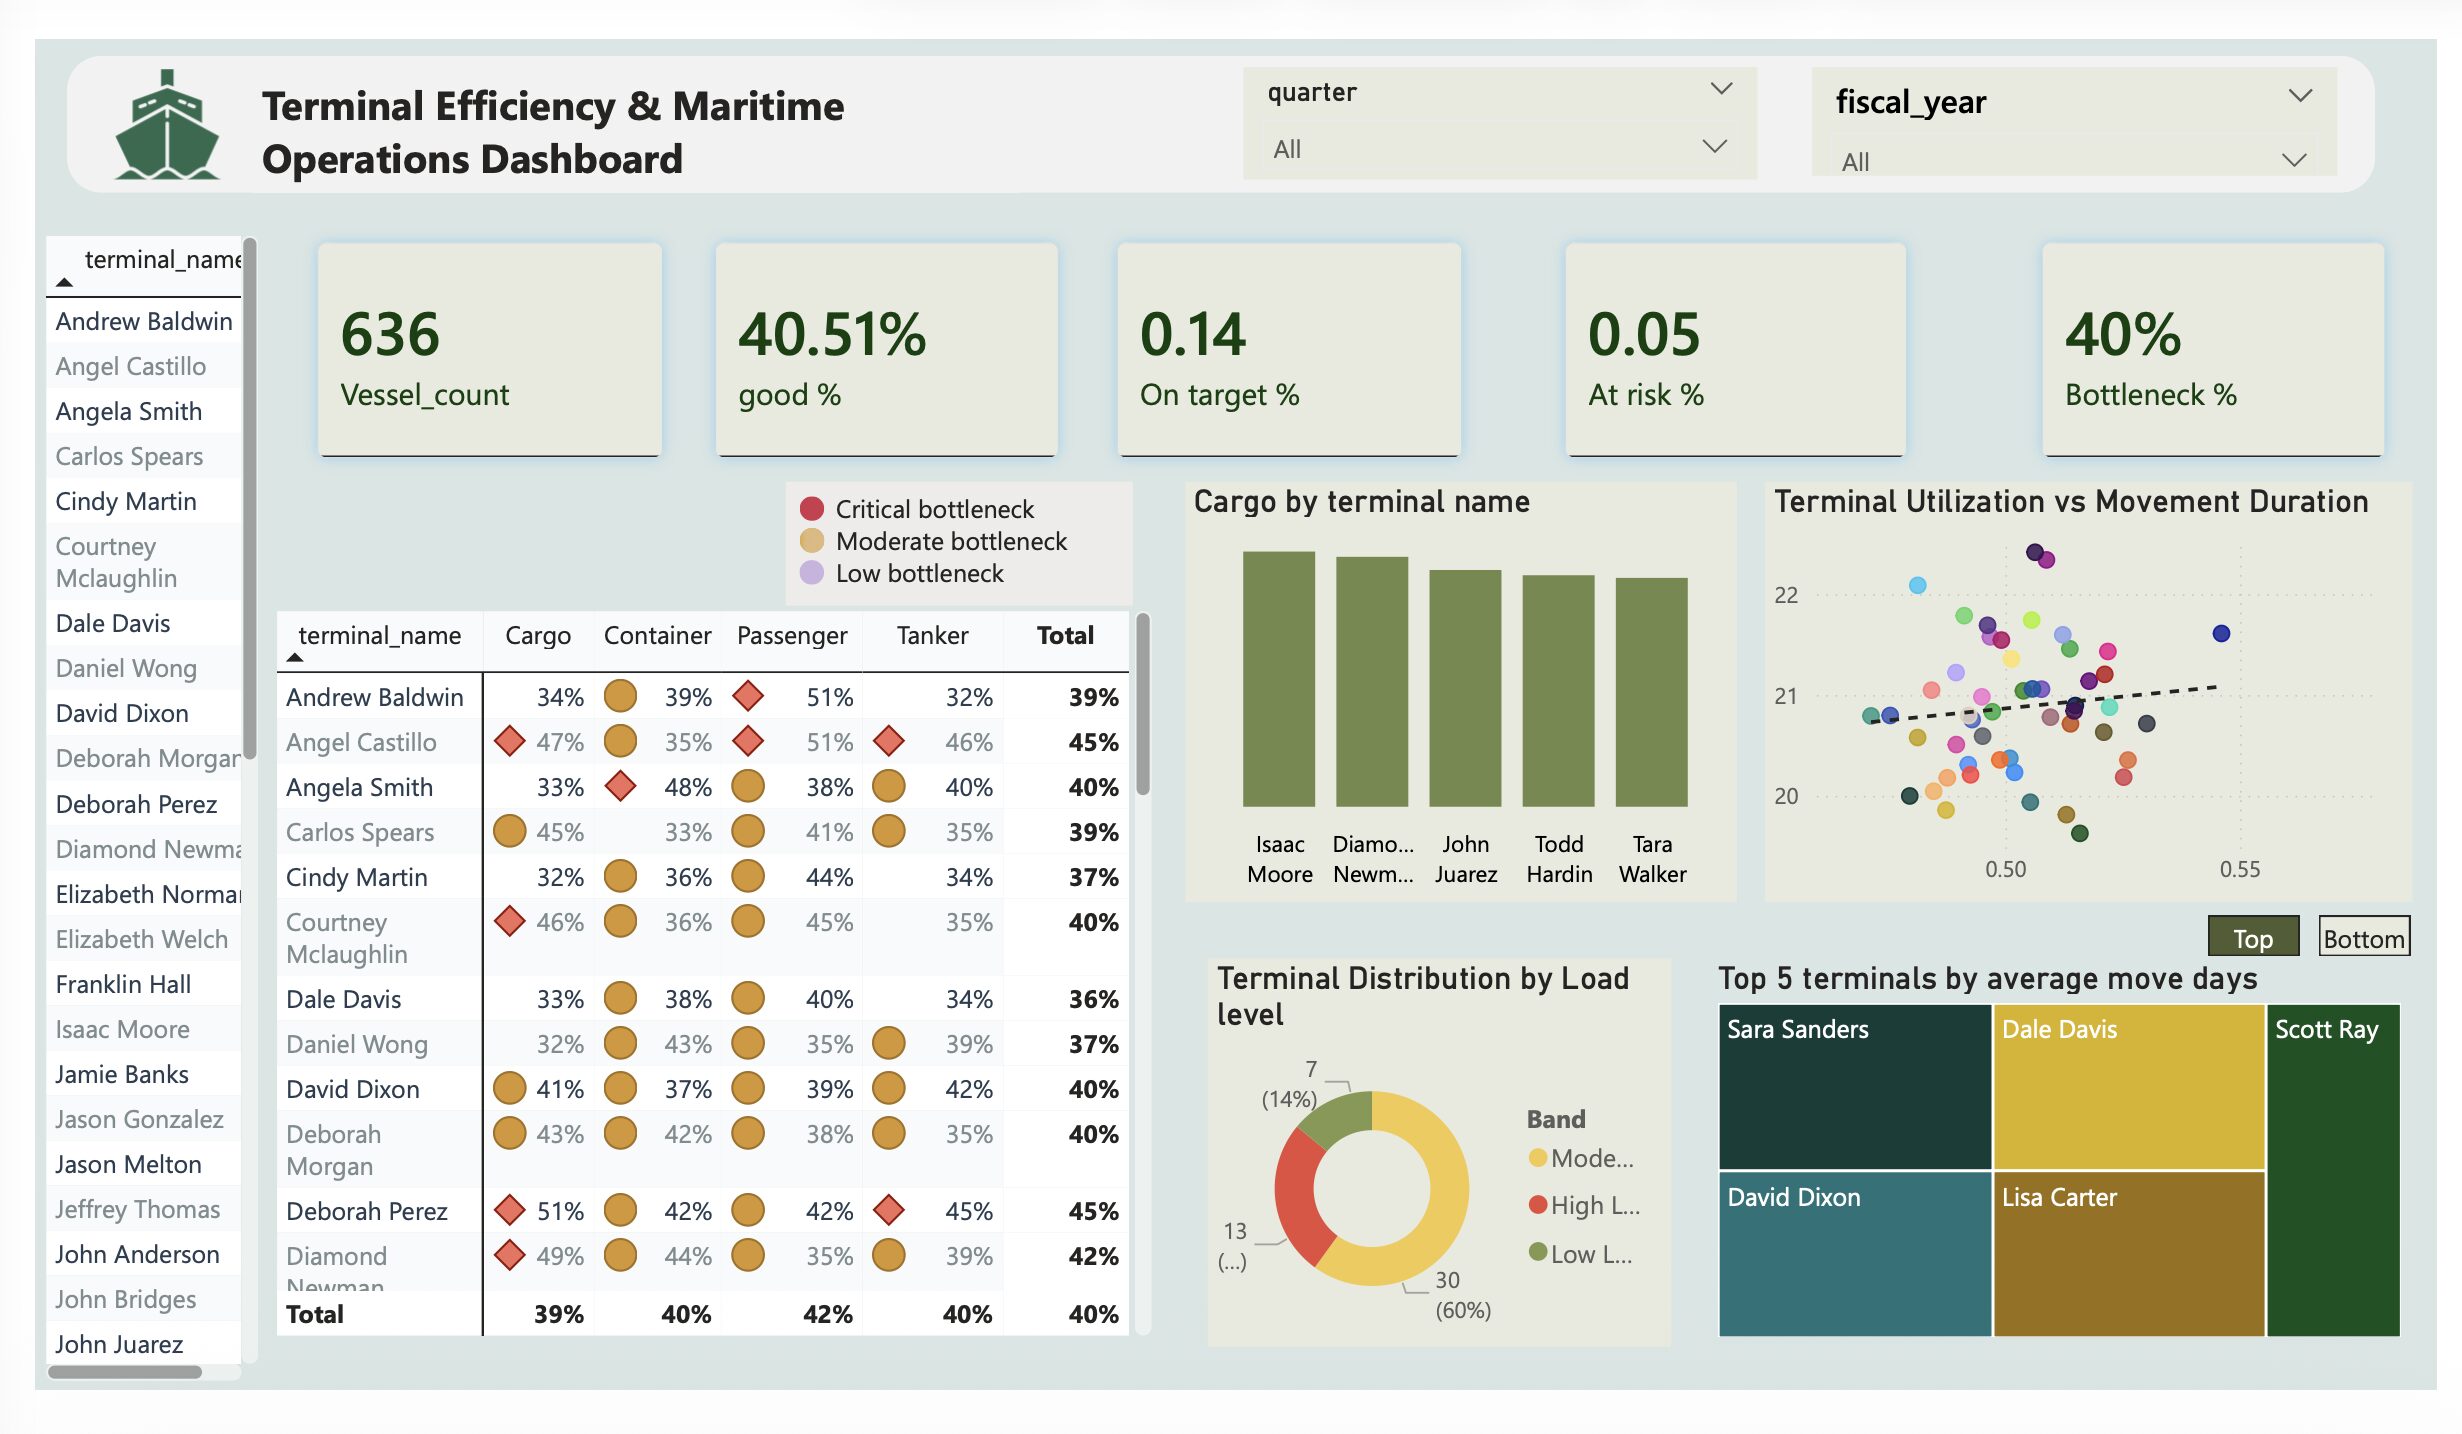
I conducted a structured analysis of maritime operations data to evaluate vessel movement efficiency and identify bottlenecks across terminals. The...
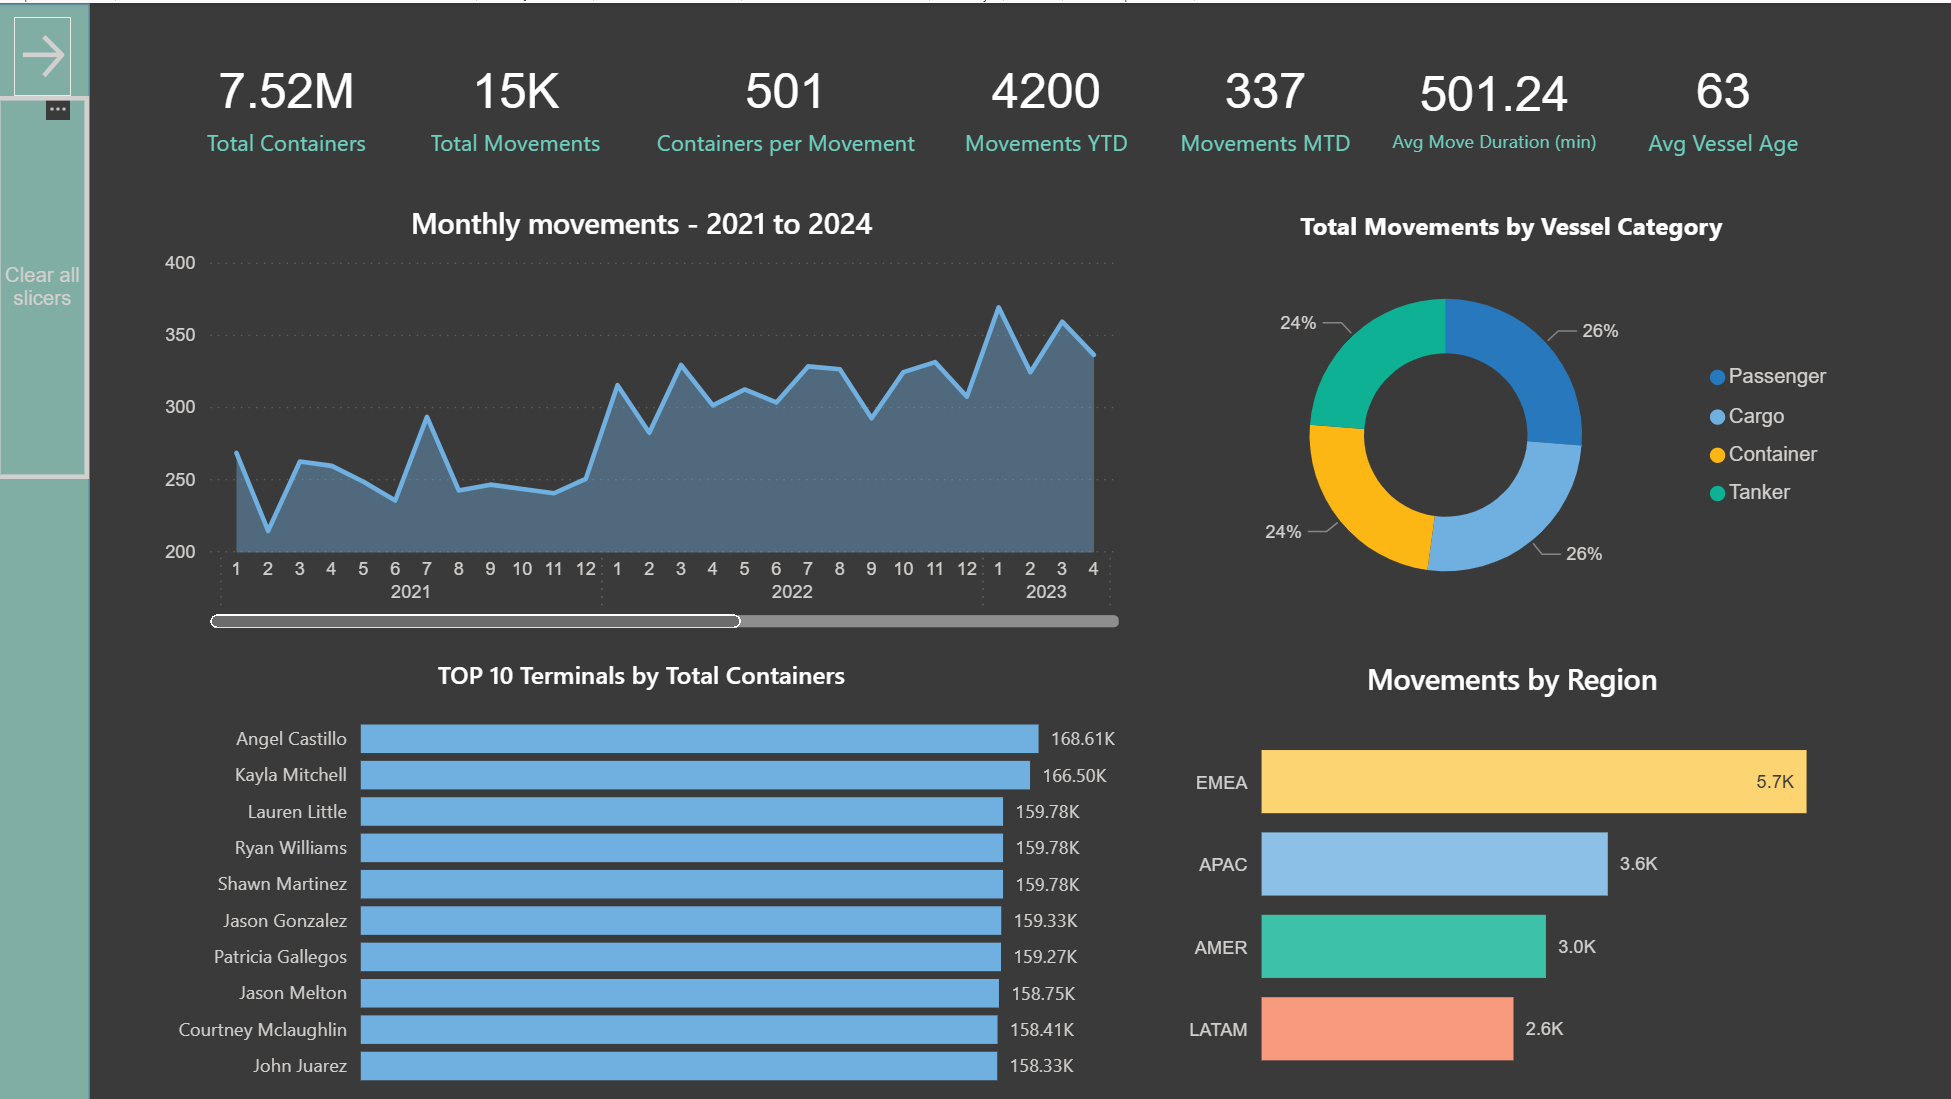
This portfolio showcases hands-on projects built with Power BI, DAX, Power Query and Python – covering everything from data modelling...
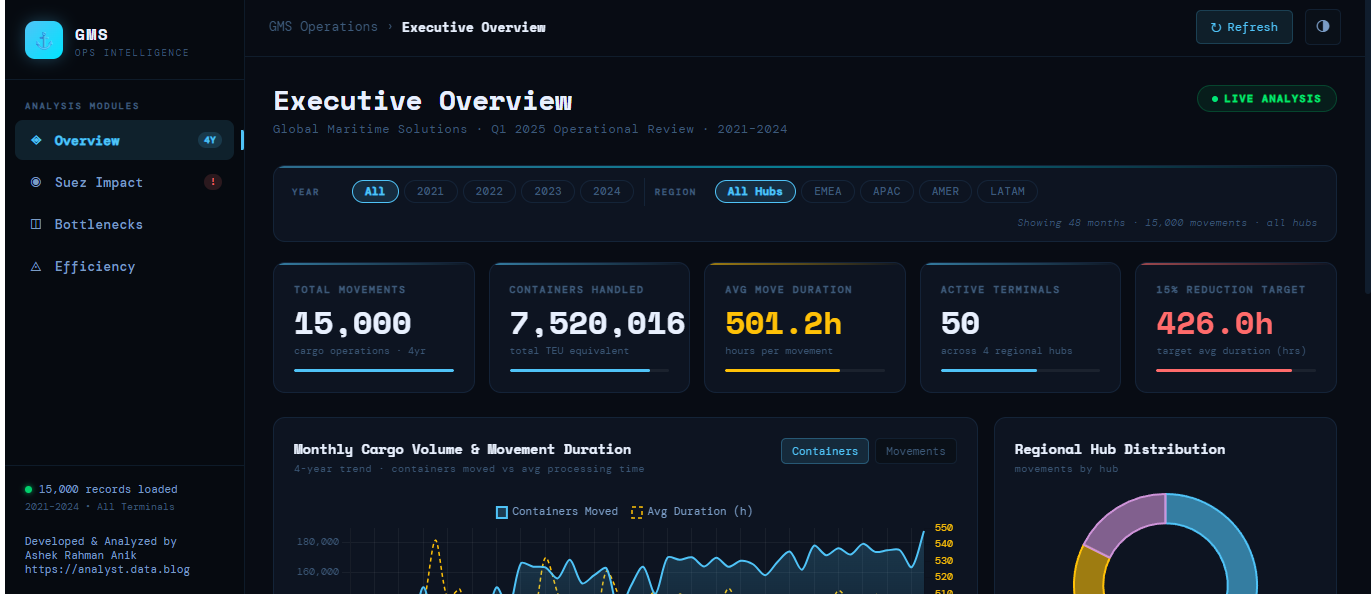
This is a custom web-based maritime intelligence dashboard built using HTML, CSS, and JavaScript instead of Power BI.
Discover the latest AI & Data challenges




 Get In Touch
Contact our team

16 Upper Woburn Place, London, Greater London, WC1H 0AF, United Kingdom