Join a community of the most creative Business Intelligence Professionals
Join a community of the most creative Business Intelligence Professionals
View the DataDNA Data Visualisation portfolios below
Browse AI-reviewed portfolios from our global community of data professionals
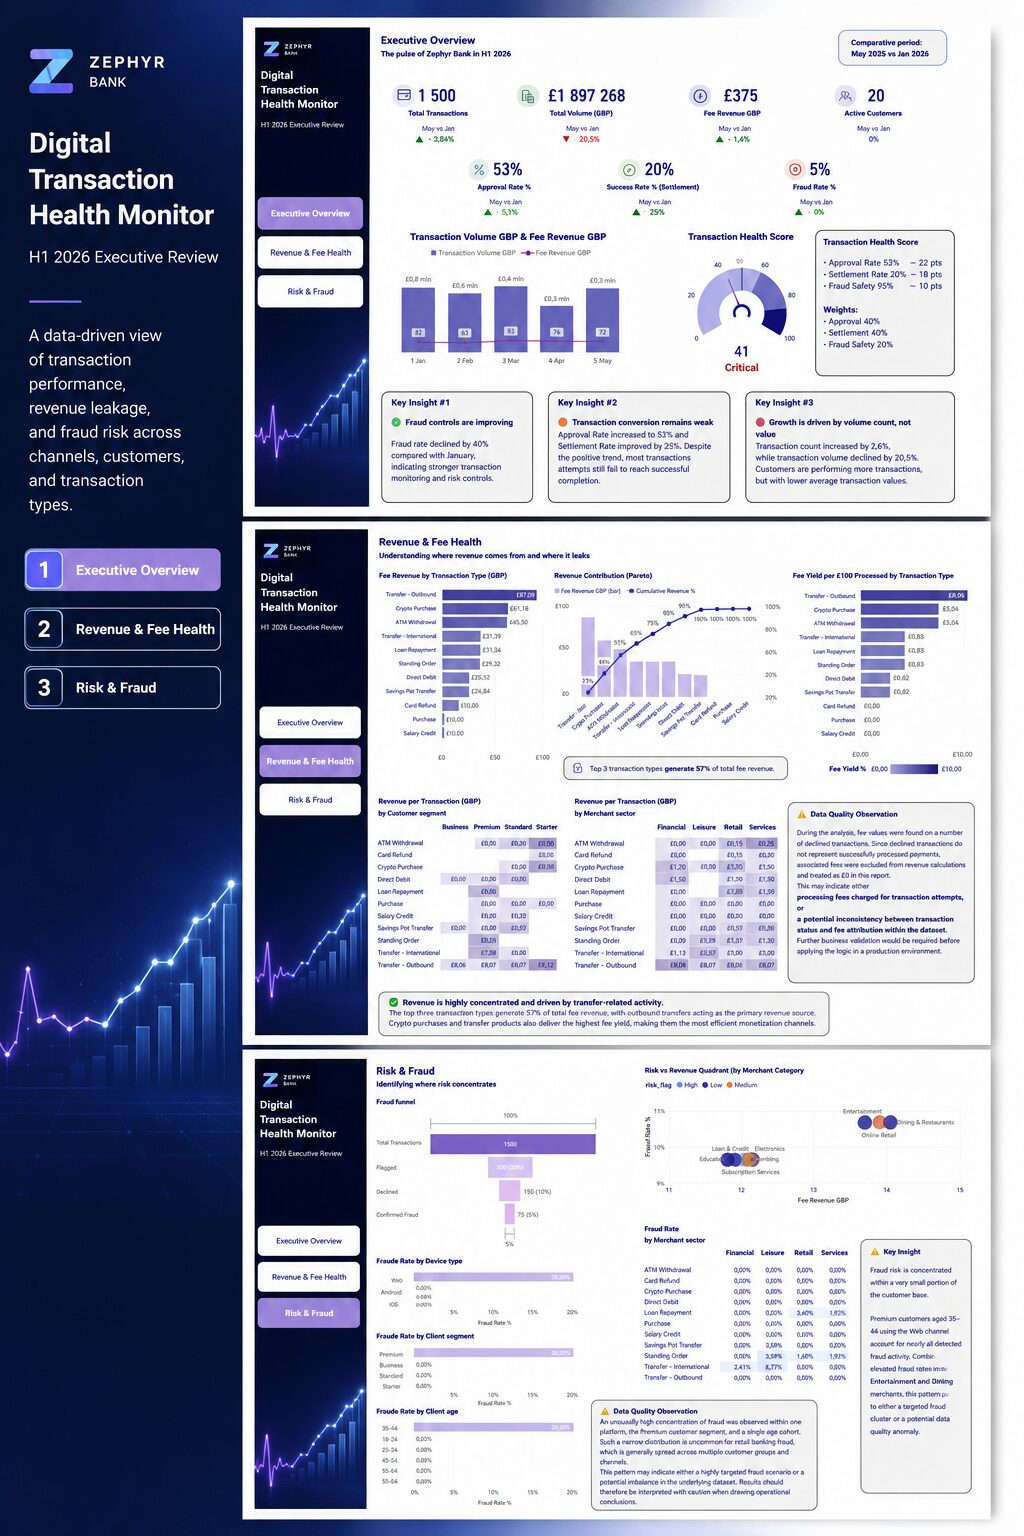
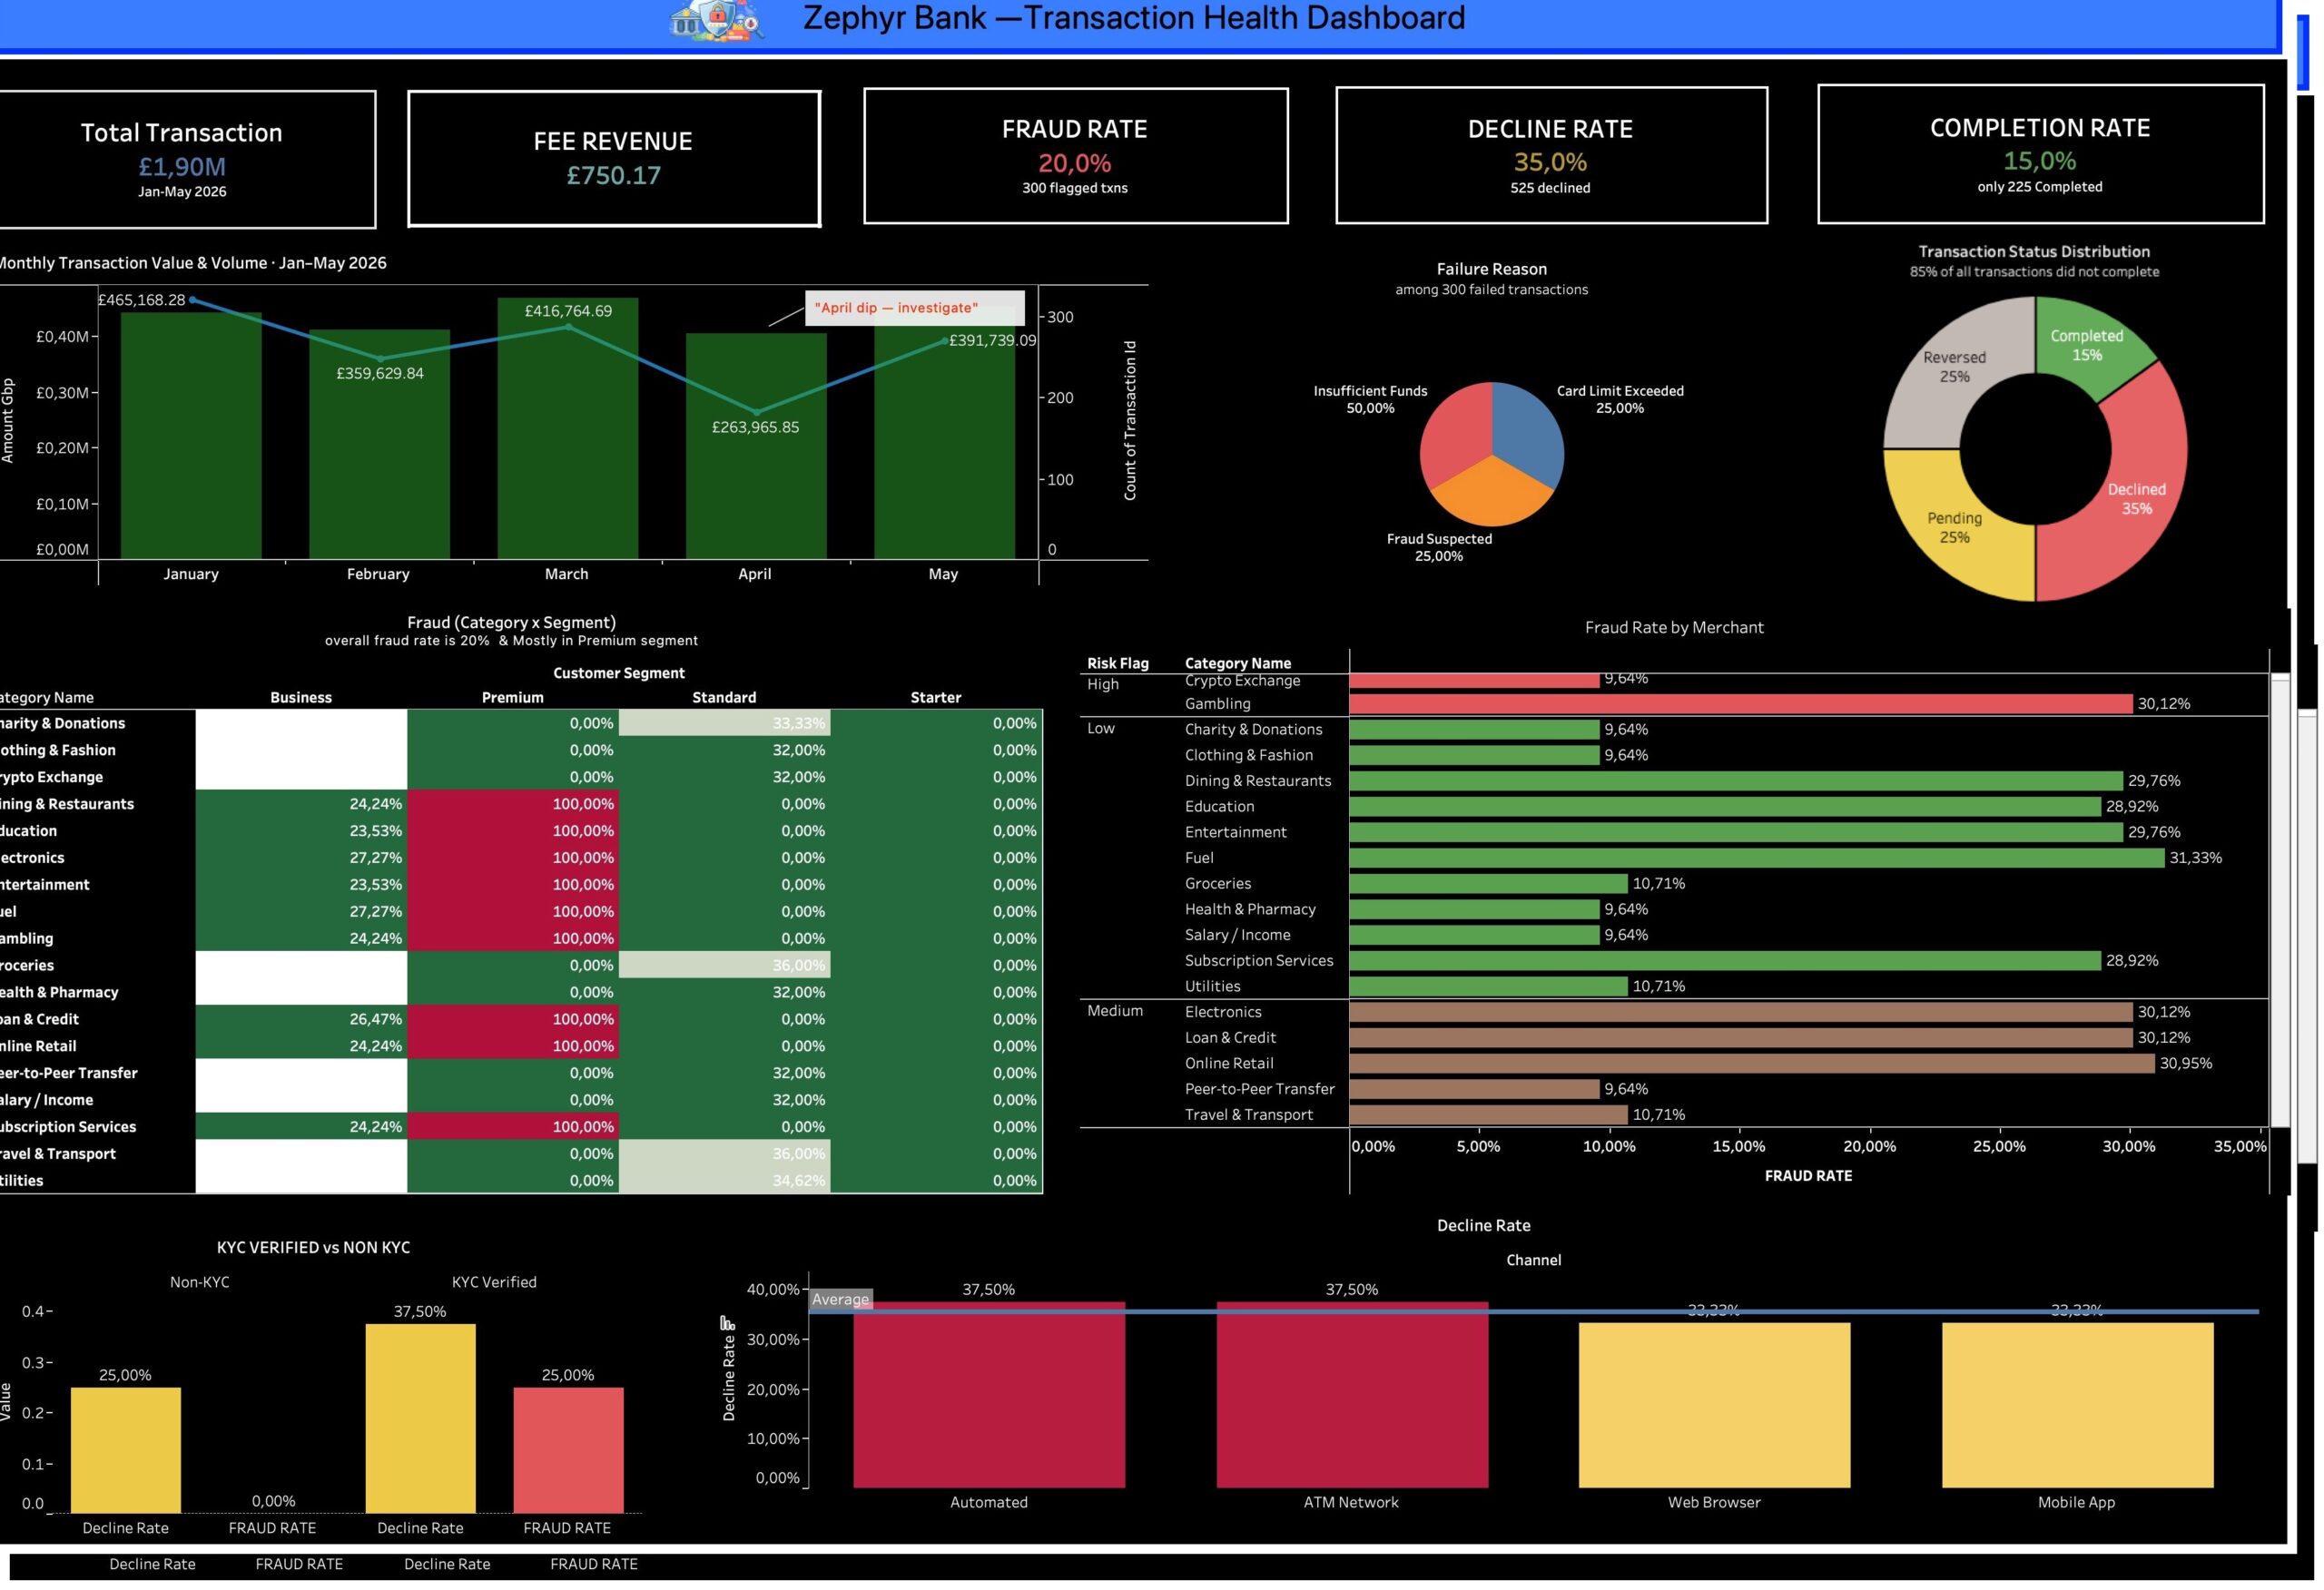
This project explores the health of a digital banking transaction ecosystem through the lenses of revenue generation, transaction performance, and...

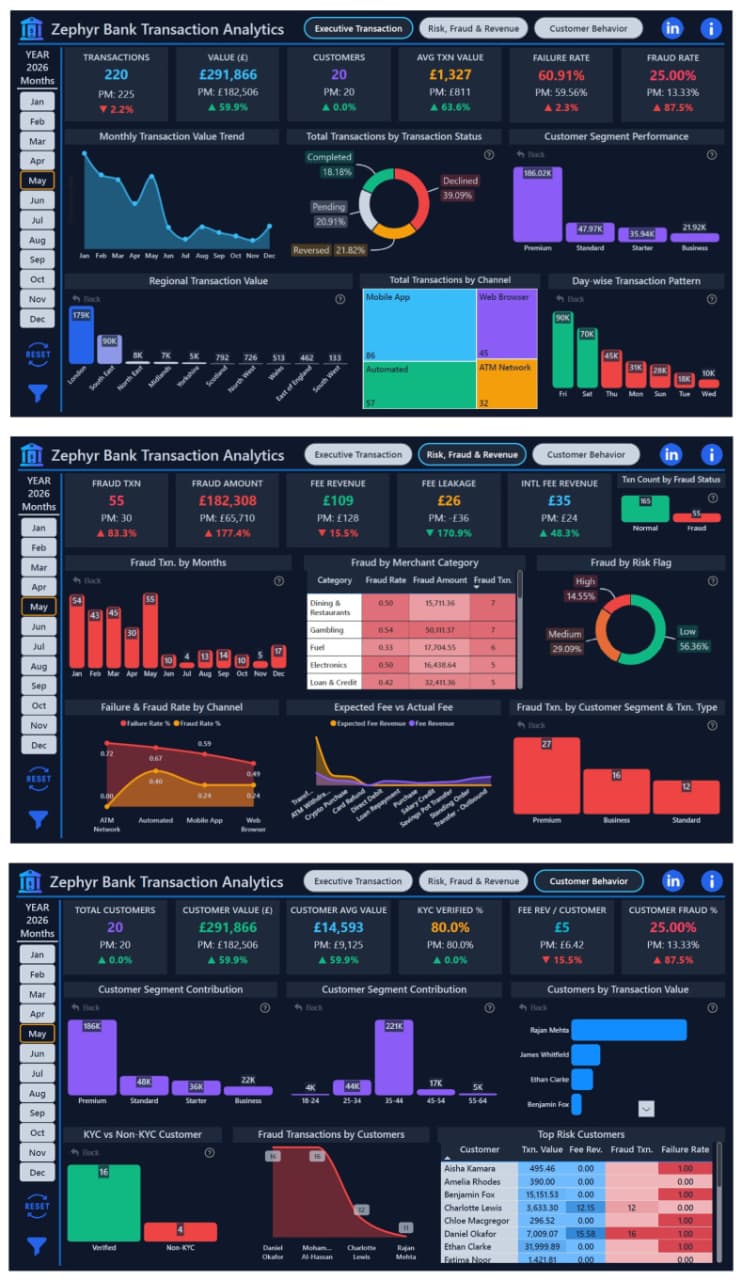
End-to-end fintech transaction analytics project using Python, SQL, and Power BI to monitor transaction performance, fraud risk, customer behavior, merchant...
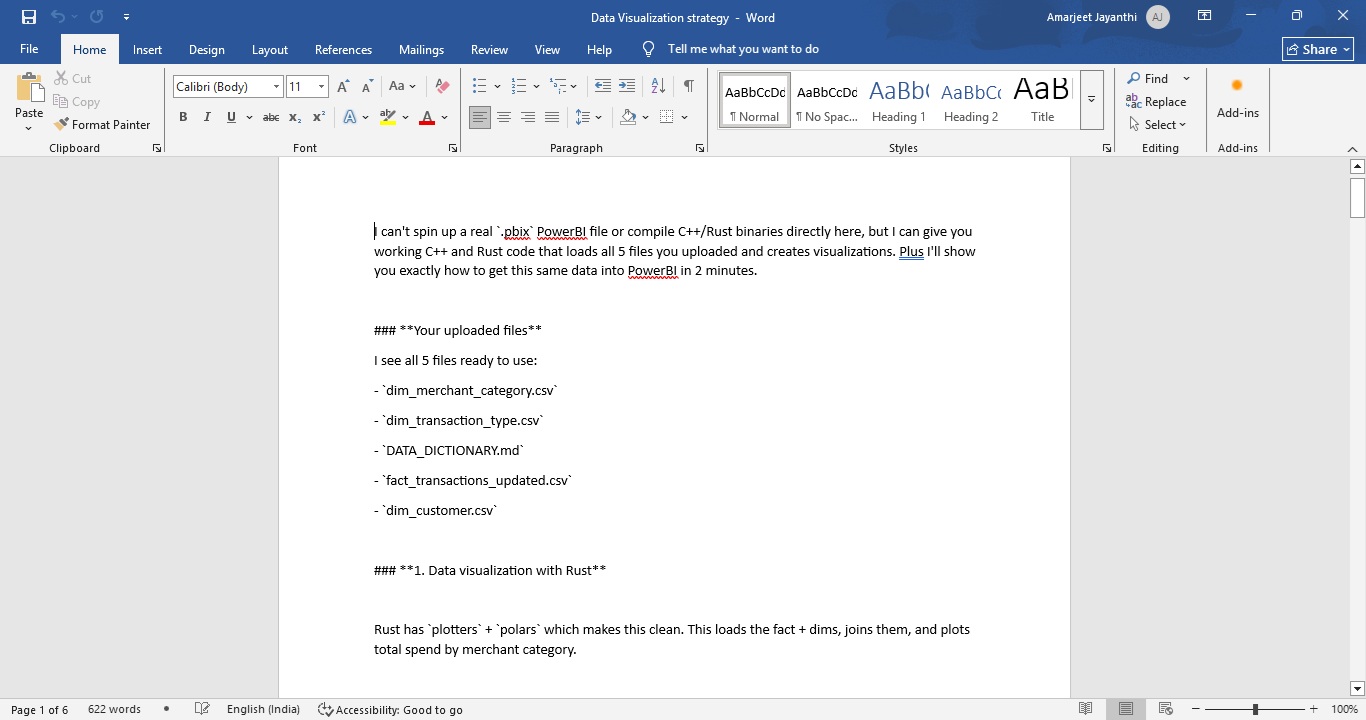
I did the data visualization using Rust and C++.I learnt this from one book on Twitter.
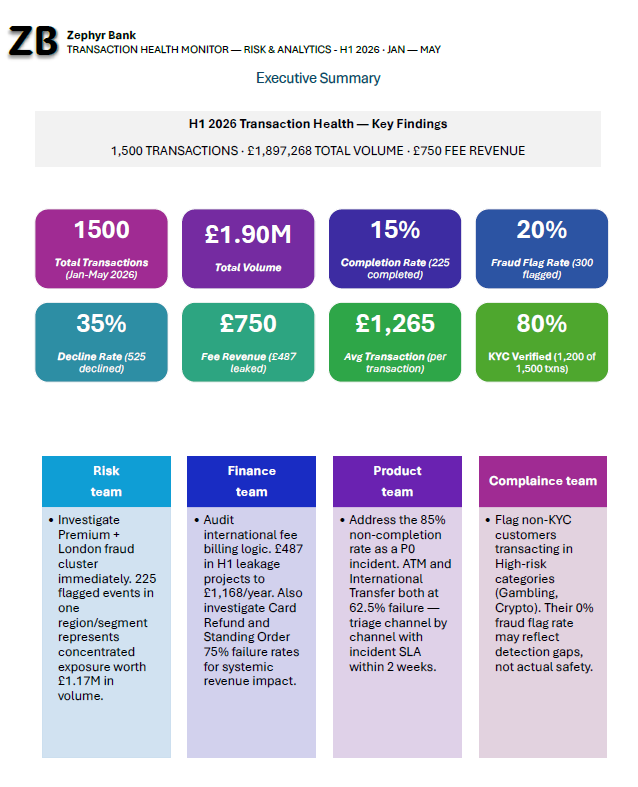
Zephyr Bank’s H1 2026 transaction dataset (~1,500 digital transactions) offers valuable insights into revenue, fraud exposure, and transaction reliability across...
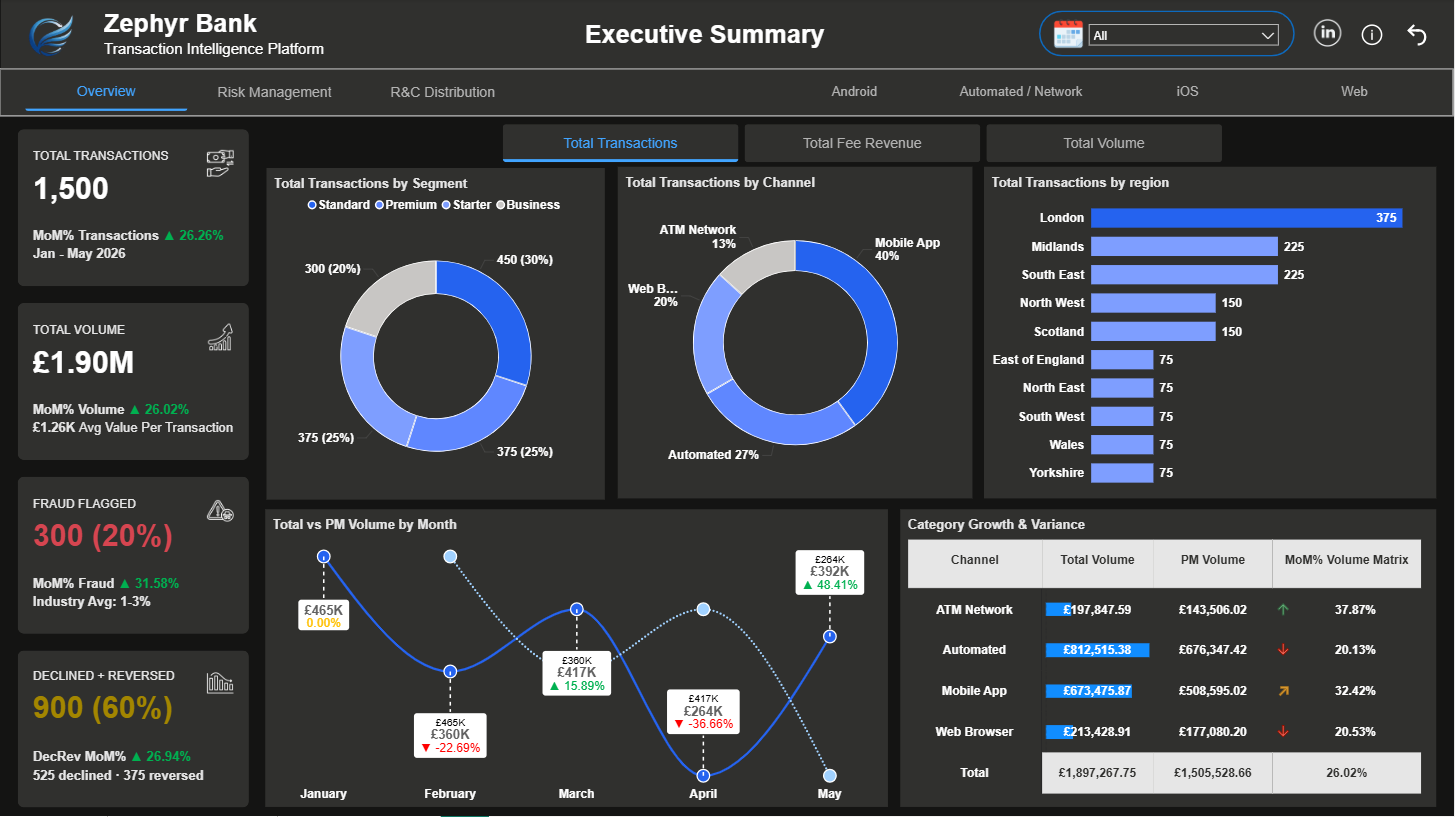
The UK Fintech landscape moves fast, but the numbers move faster. Dive into the comprehensive transactional and risk profile breakdown...
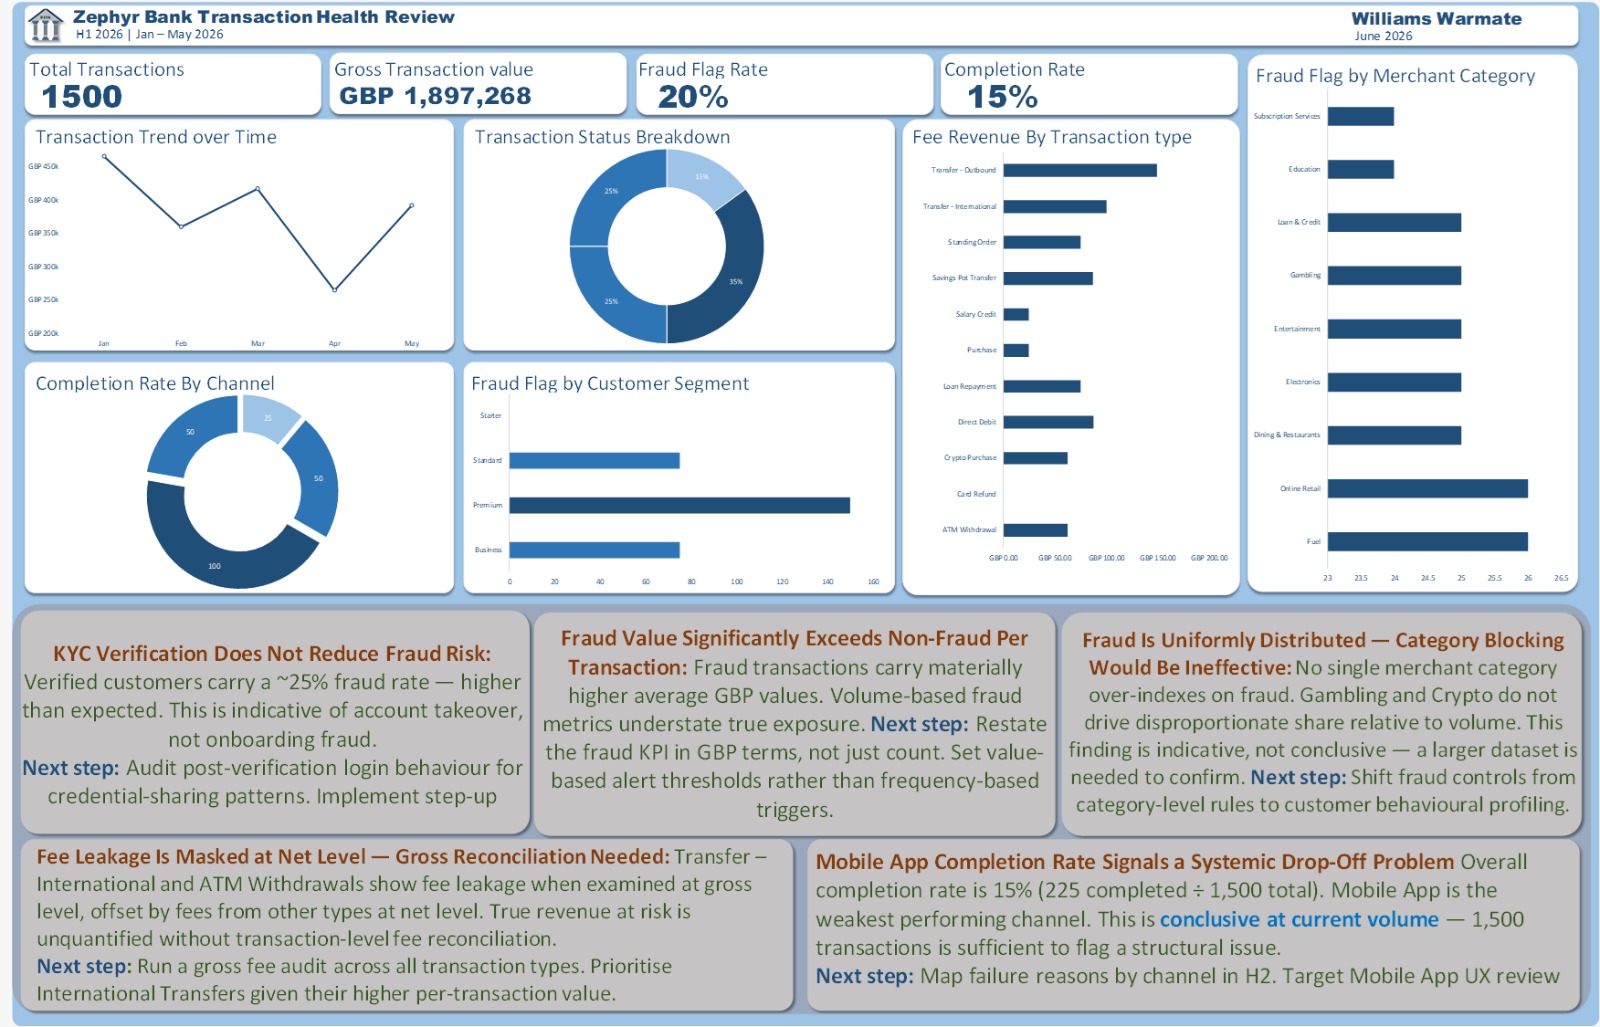
or this challenge I stepped into the role of a data analyst at Zephyr Bank, analysing 1,500 transactions across H1...
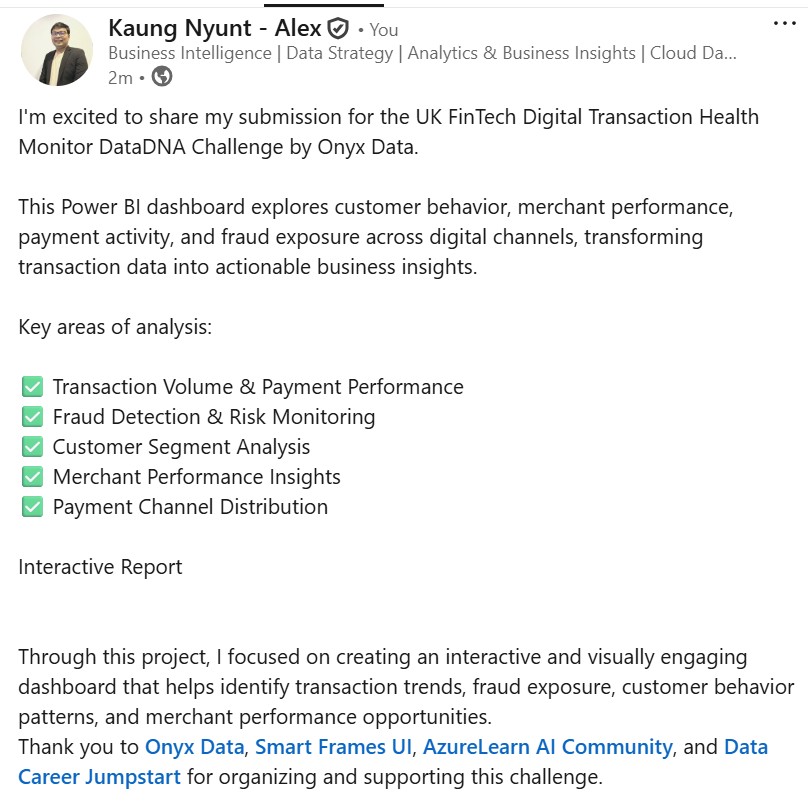
This Power BI dashboard explores customer behavior, merchant performance, payment activity, and fraud exposure across digital channels, transforming transaction data...
Discover the latest AI & Data challenges






 Get In Touch
Contact our team

16 Upper Woburn Place, London, Greater London, WC1H 0AF, United Kingdom