Join a community of the most creative Business Intelligence Professionals
Join a community of the most creative Business Intelligence Professionals
View the DataDNA Data Visualisation portfolios below
Browse AI-reviewed portfolios from our global community of data professionals

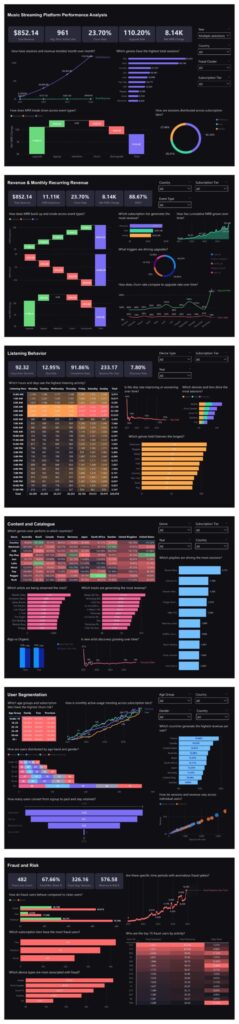
For this challenge I stepped into the role of a data analyst investigating a music streaming platform. This time I...

🔍 Key Insights: • Premium users generated the majority of platform revenue despite lower user volume • Algorithmic recommendations significantly...
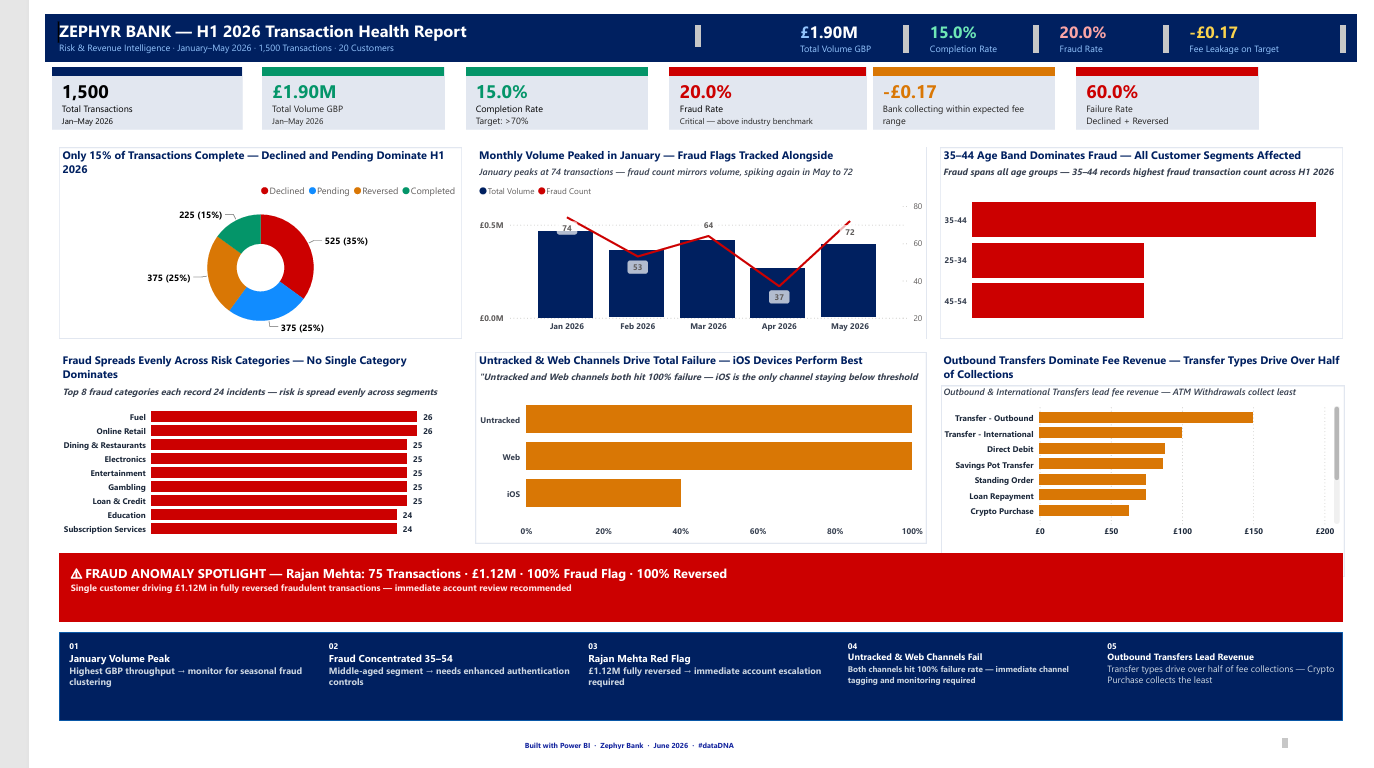
Power BI Desktop was my primary tool throughout, from data modelling all the way to the final layout. I wrote...
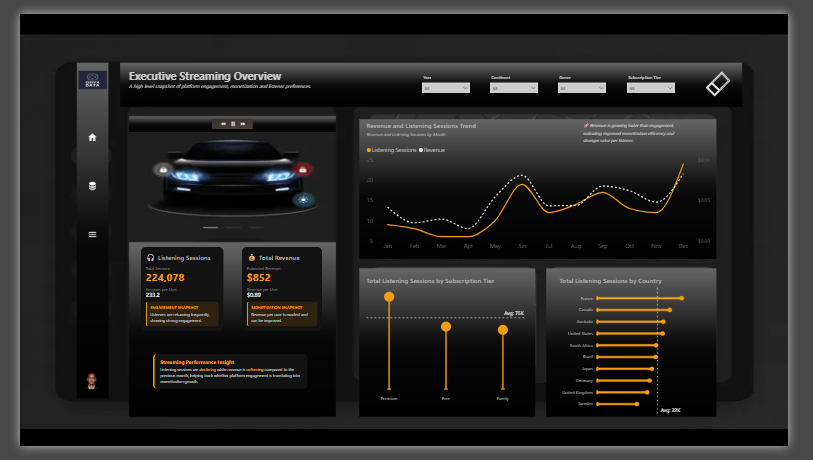
My submission for the ONYX Data Challenge: Music Streaming Analytics in Power BI. 📊 Page 1: Executive Streaming Overview 🎤...
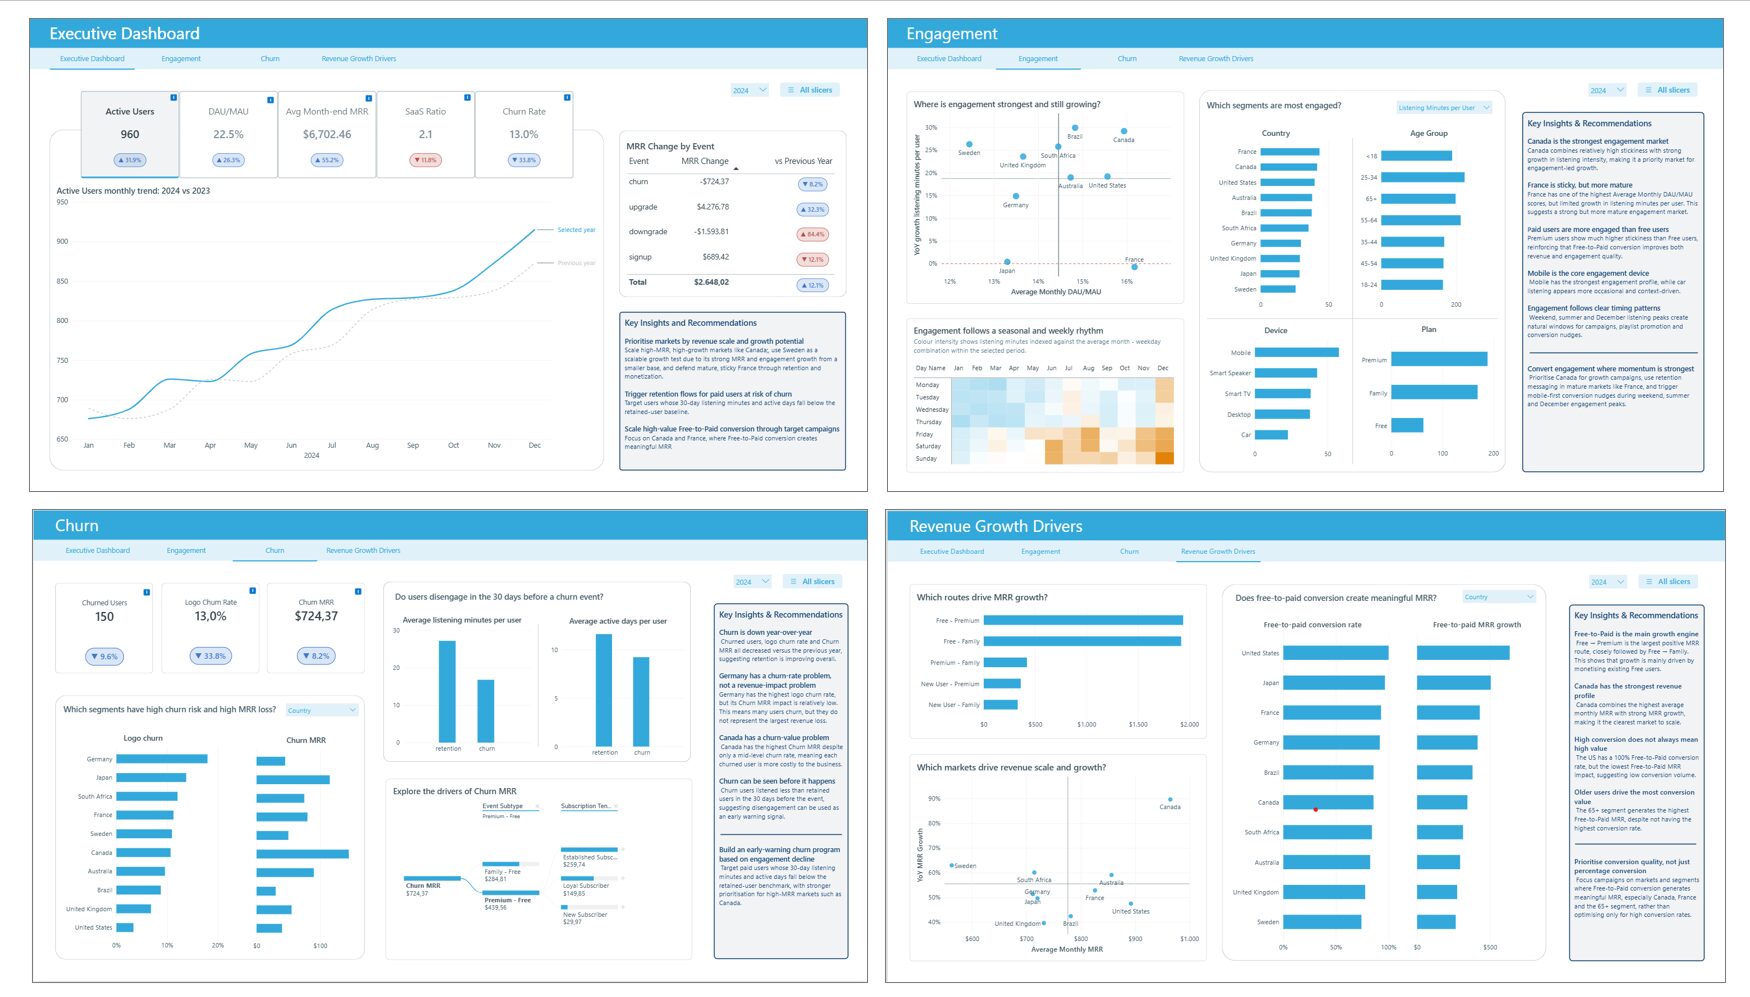
Data visualization challenges like these are a great way to experiment with new visual concepts, storytelling techniques, color palettes, and...

🚨 1. Unmasking the High-Frequency Outliers On the Content & Fraud page, I engineered a Streaming Frequency Scatter Plot. By...
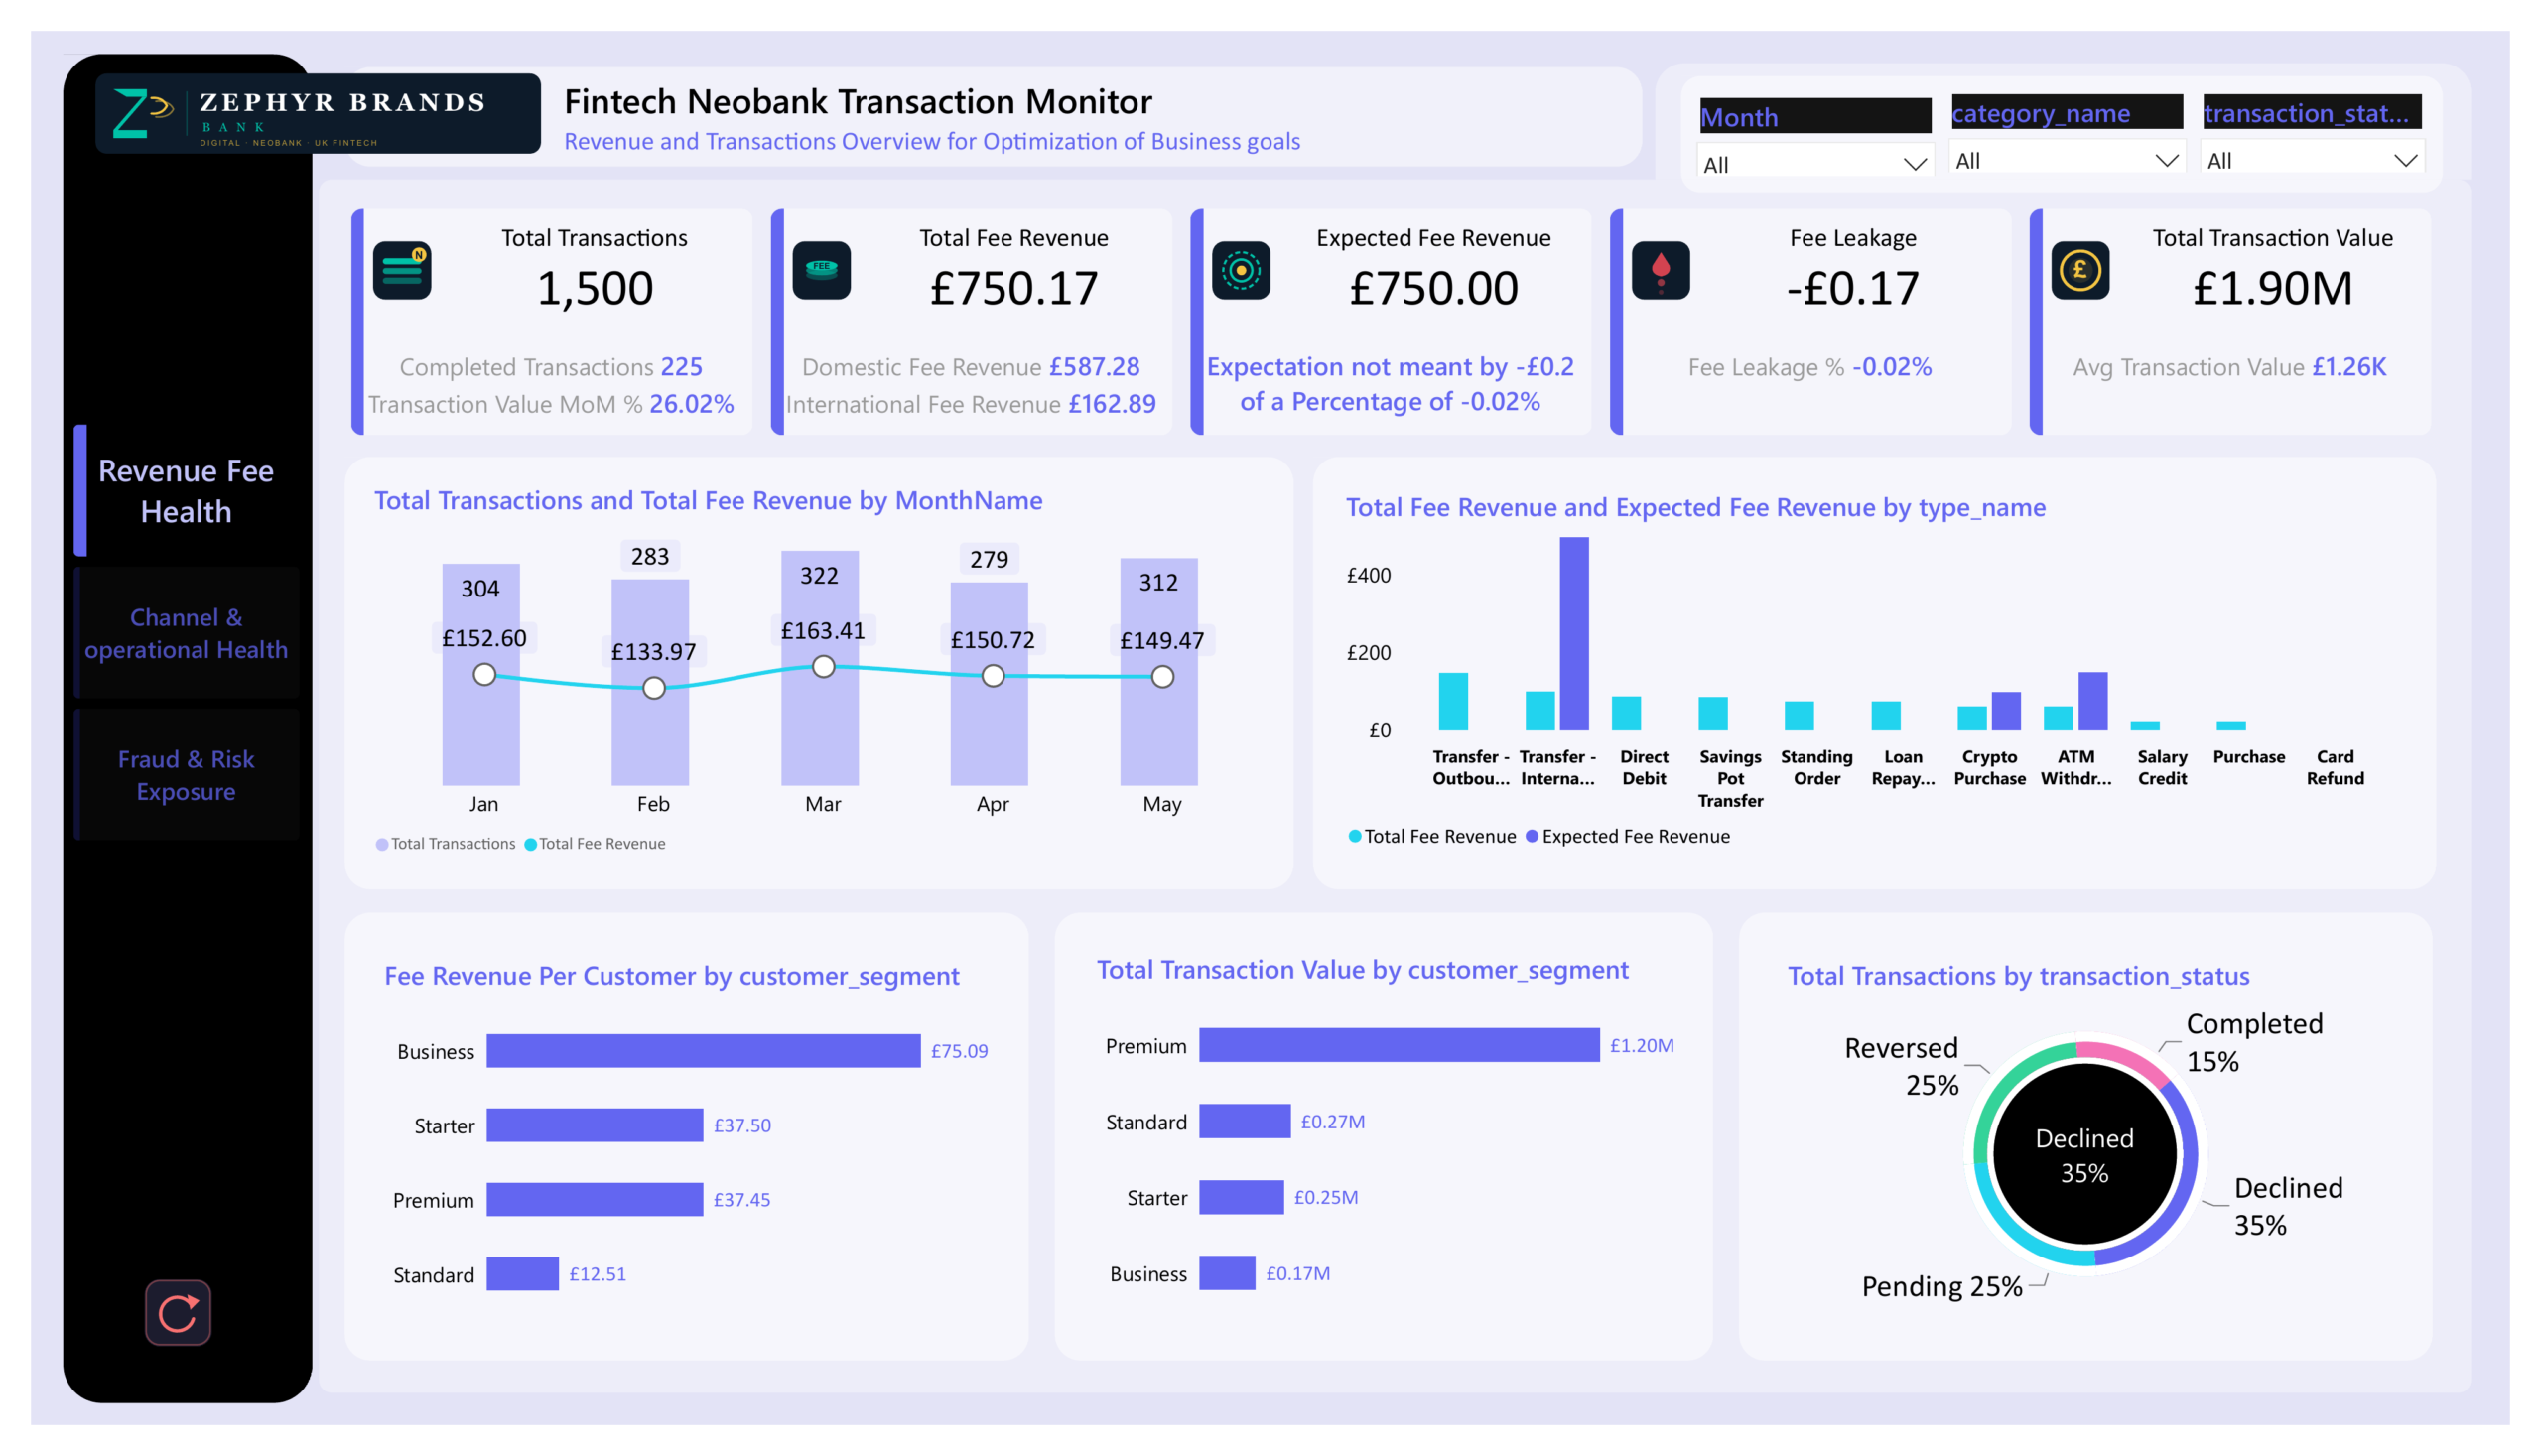
I took a layered, narrative-first approach to this report — moving from the big picture down to the details that...
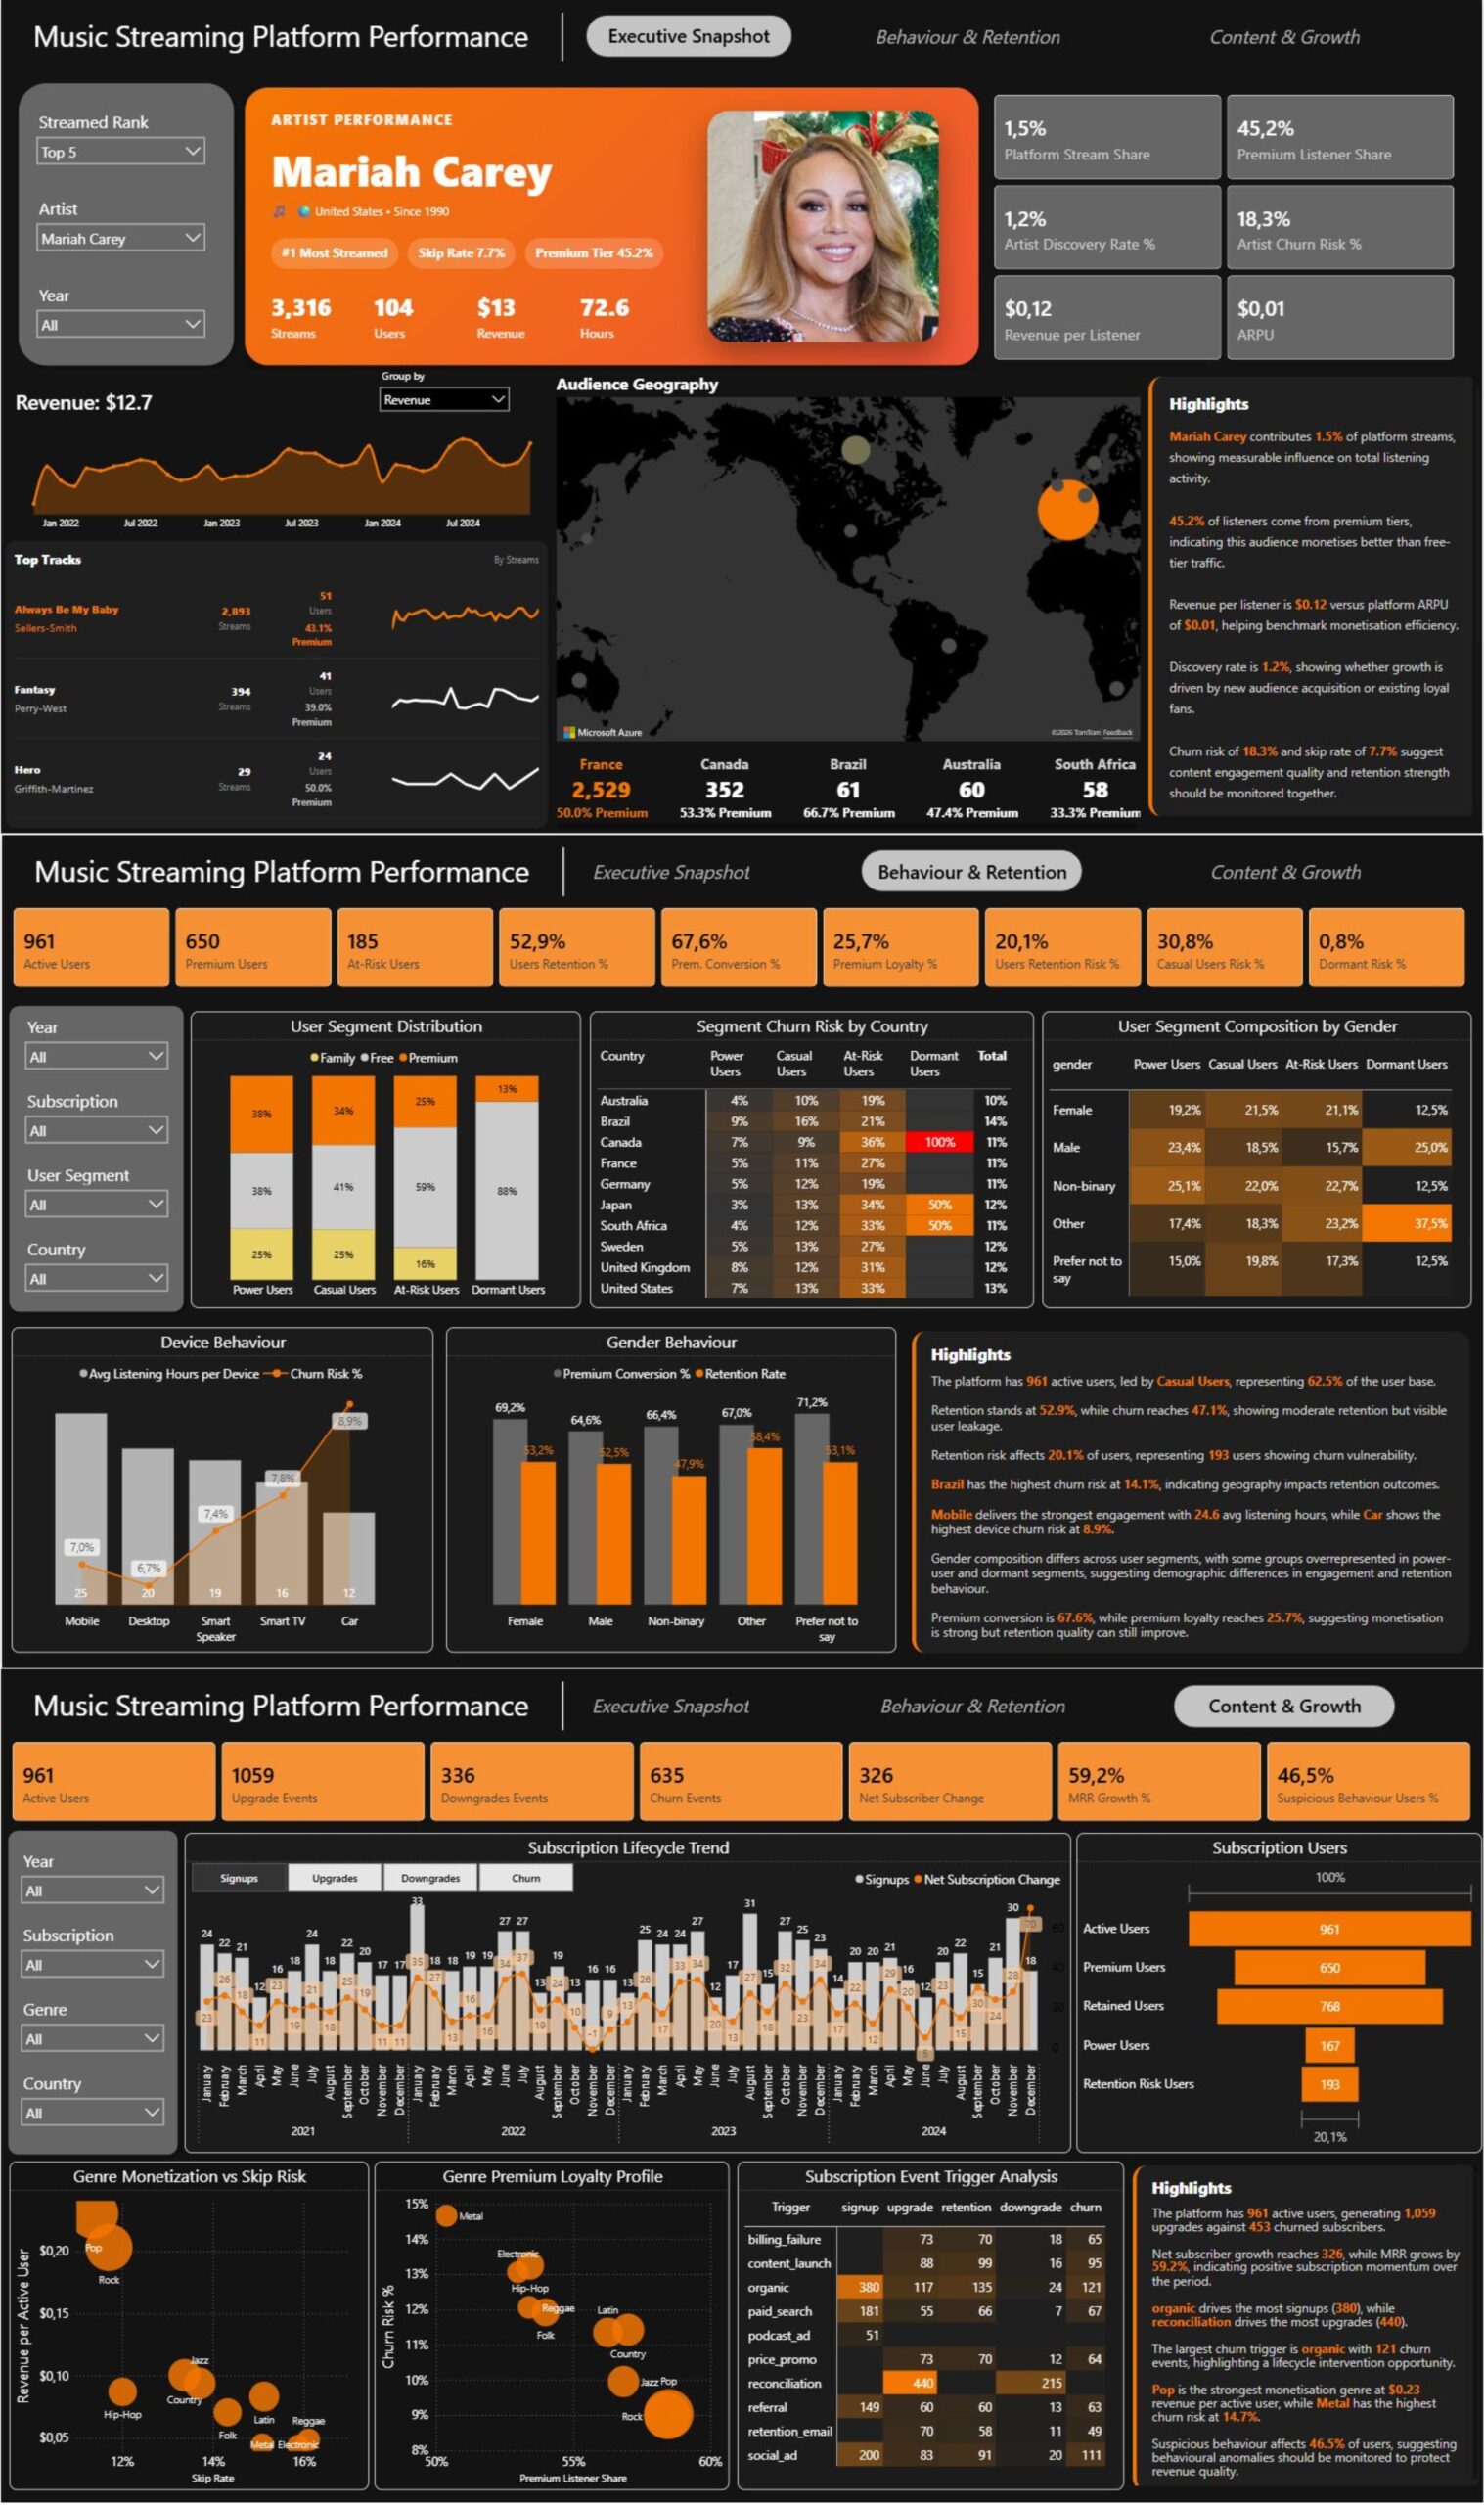
I’ve just completed my submission for the May 2026 #DataDNA Challenge by Onyx Data, where the goal was to analyse...
Discover the latest AI & Data challenges
 Get In Touch
Contact our team

16 Upper Woburn Place, London, Greater London, WC1H 0AF, United Kingdom