Join a community of the most creative Business Intelligence Professionals
Join a community of the most creative Business Intelligence Professionals
View the DataDNA Data Visualisation portfolios below
Browse AI-reviewed portfolios from our global community of data professionals
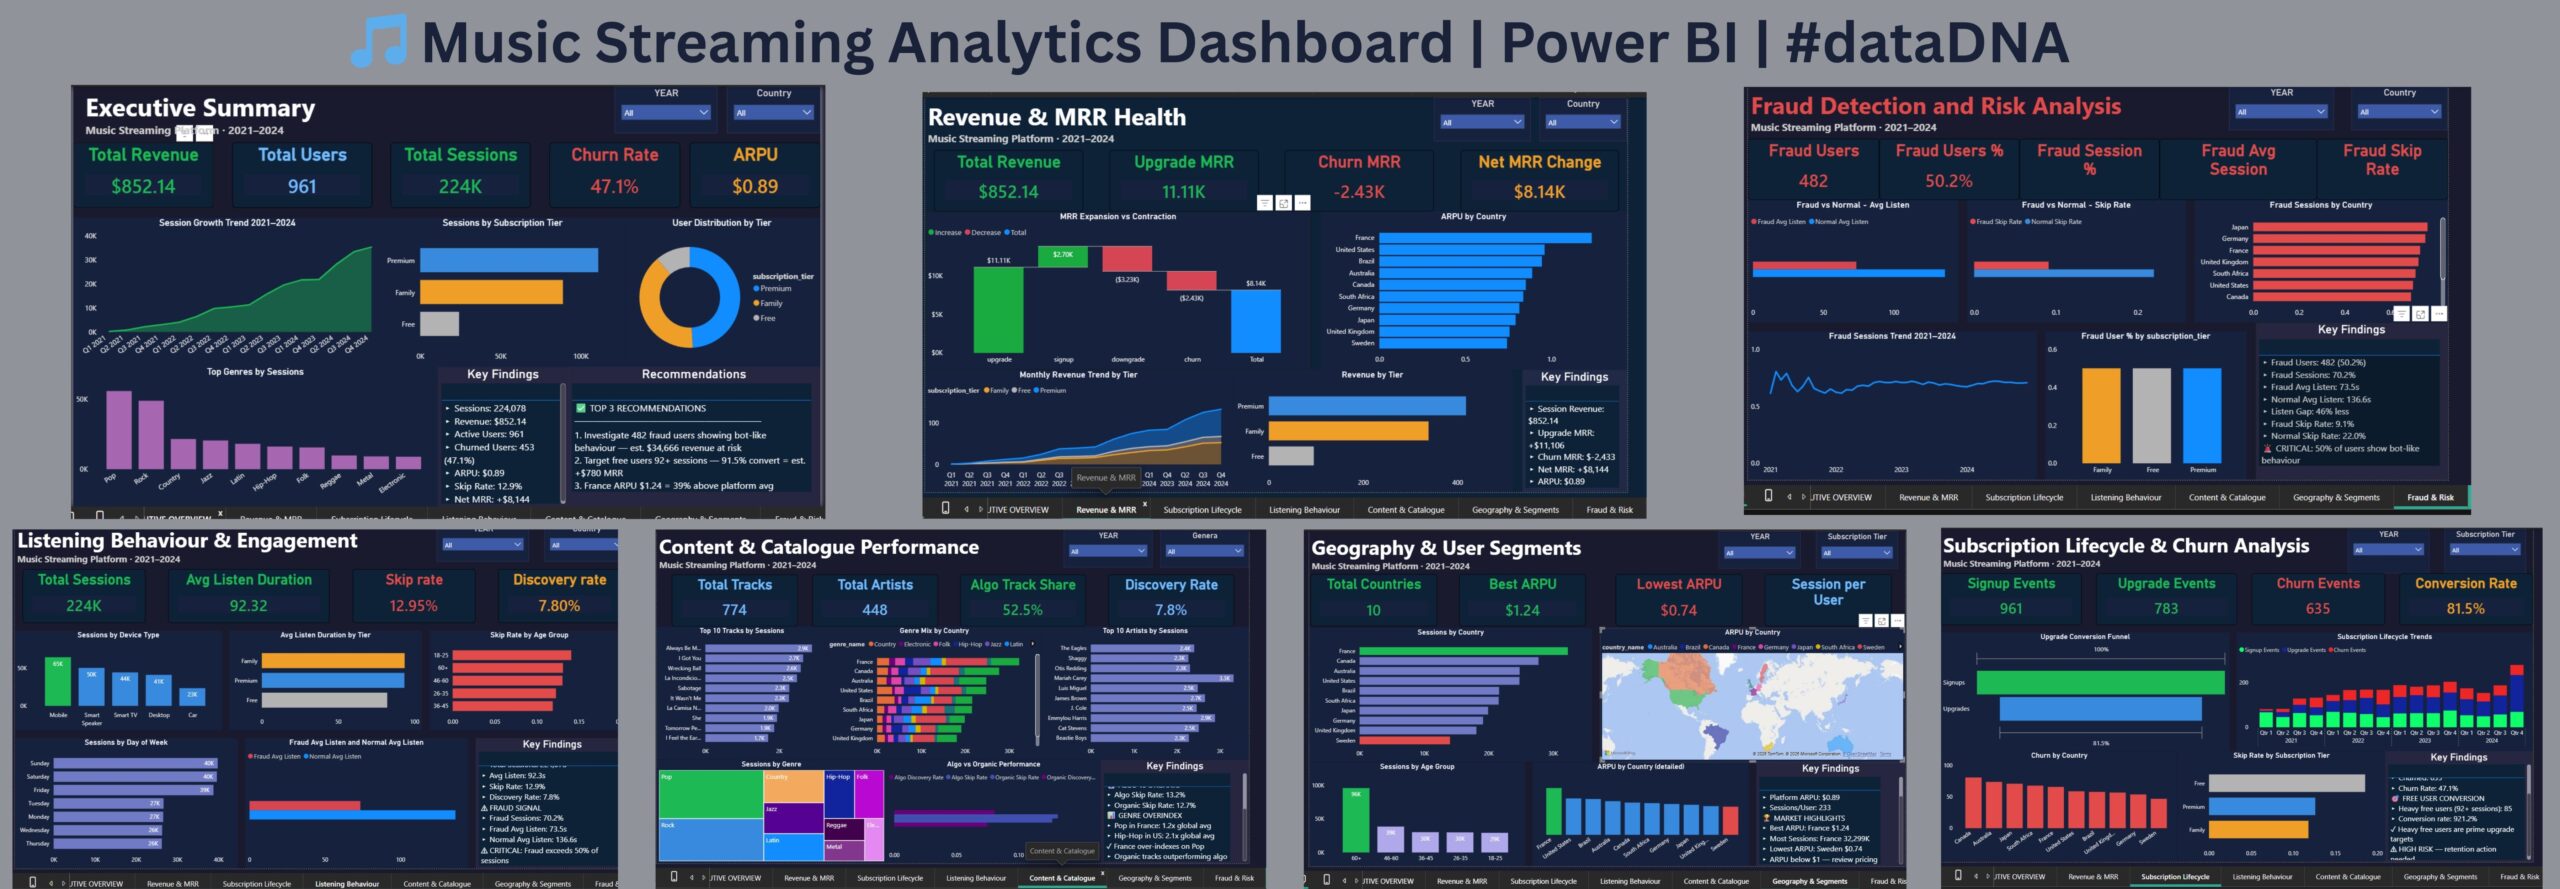
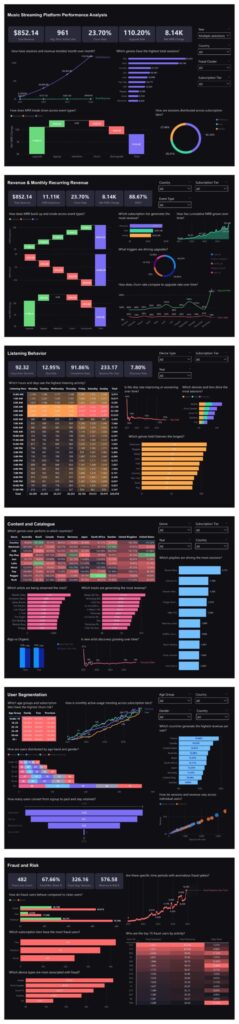
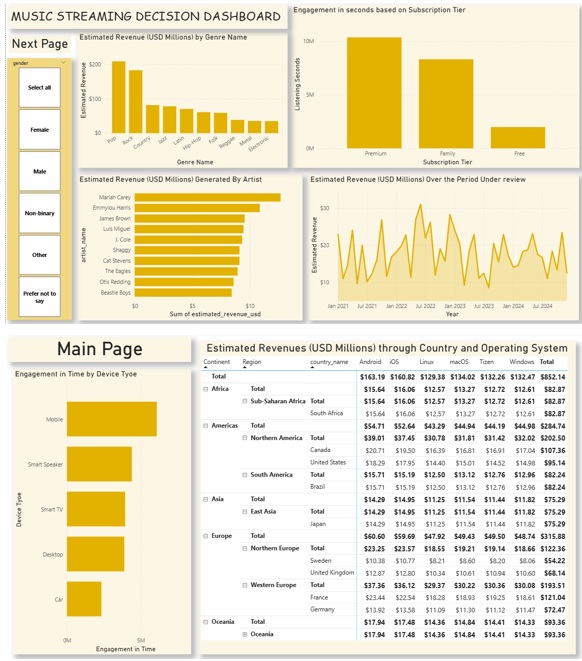
Analysed 4 years of music streaming data across 224,000 sessions, 961 users and 10 markets using Power BI and DAX....
🎵 Music Streaming Platform Performance Analytics Dashboard | May 2026 DataDNA Challenge 📊 Excited to share my submission for the...
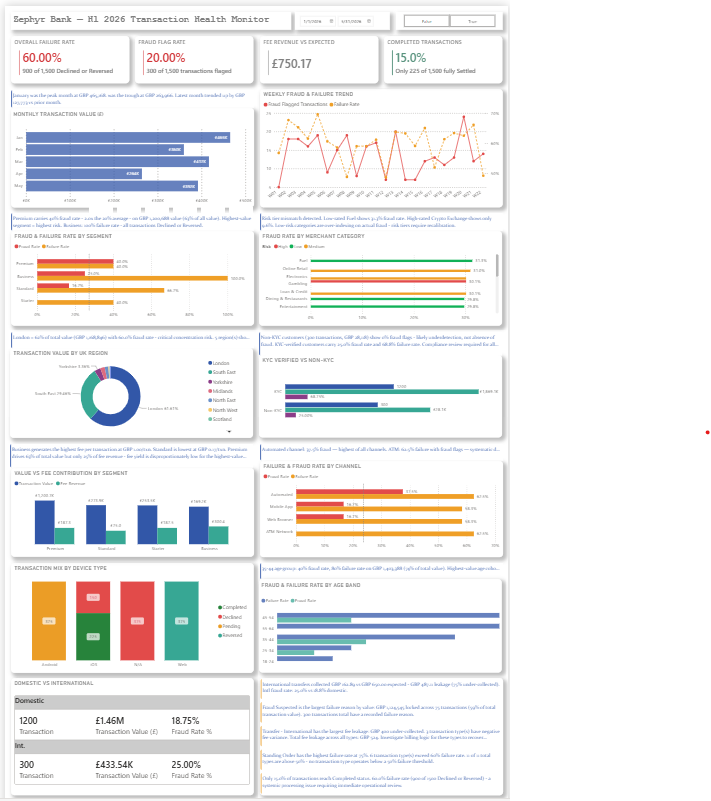
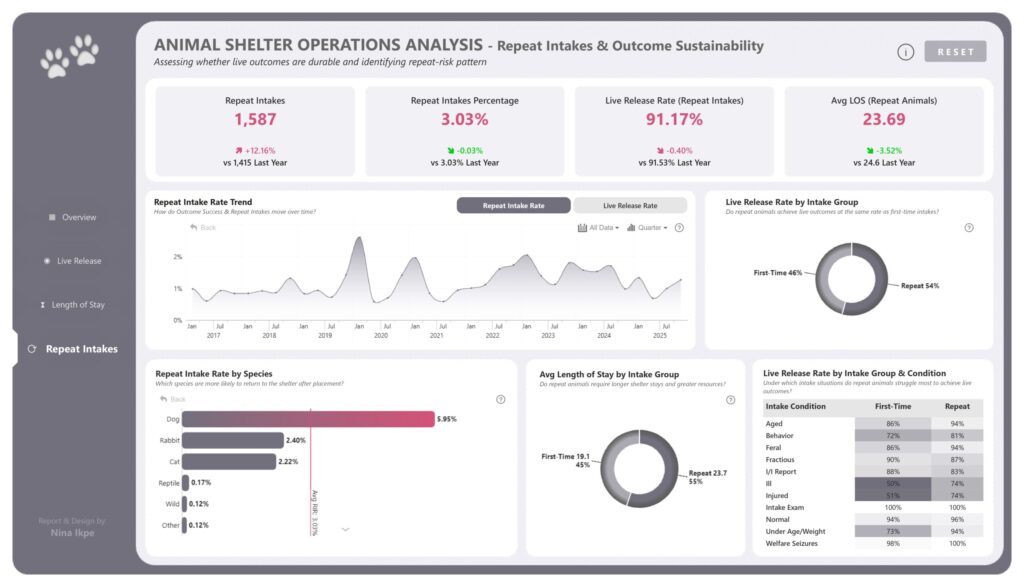
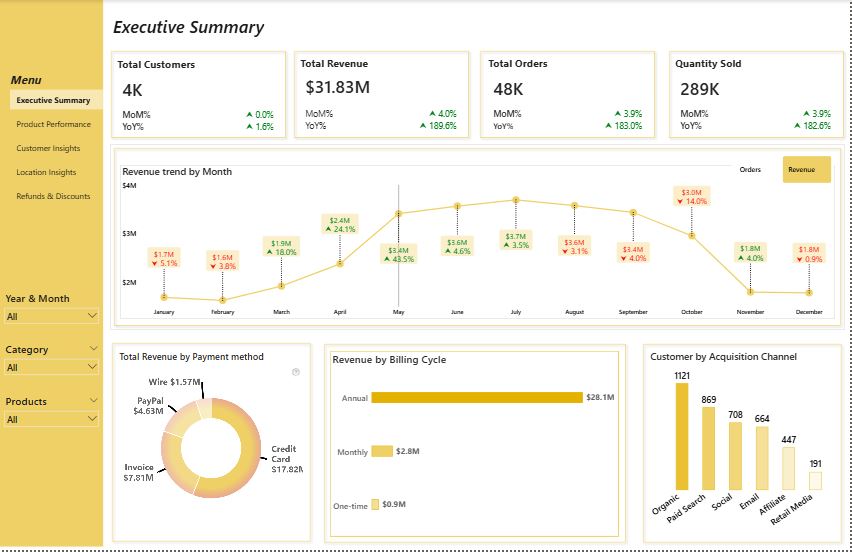
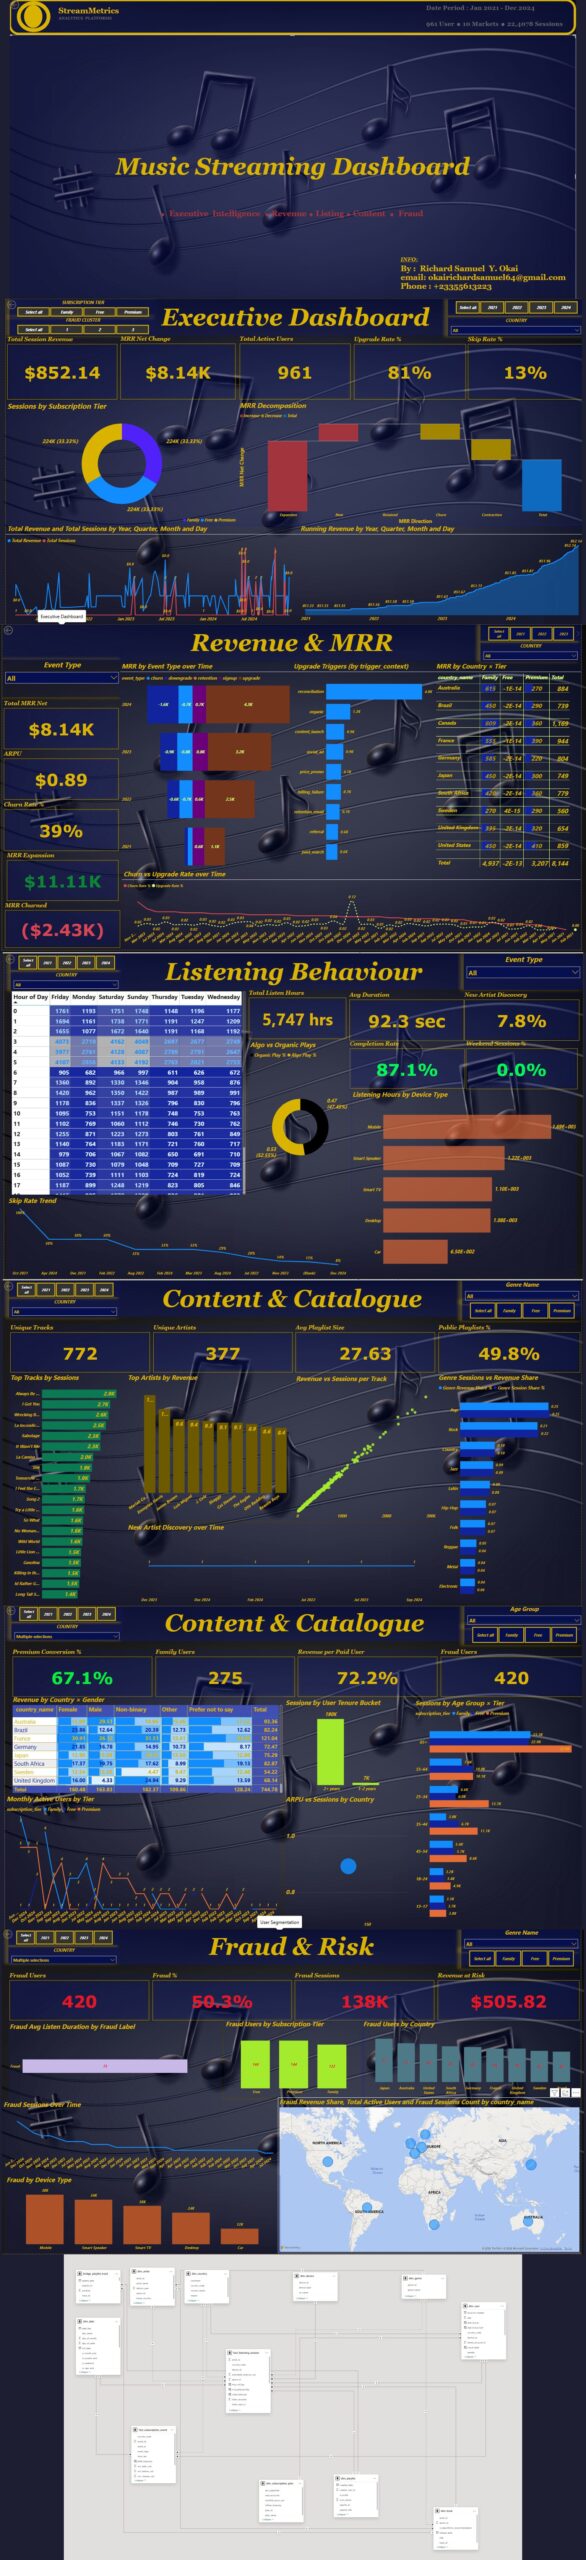
Tool Used – | Excel | Power Query | Power Pivot | DAX | 2021–2024 PROJECT OVERVIEW This project analyses...
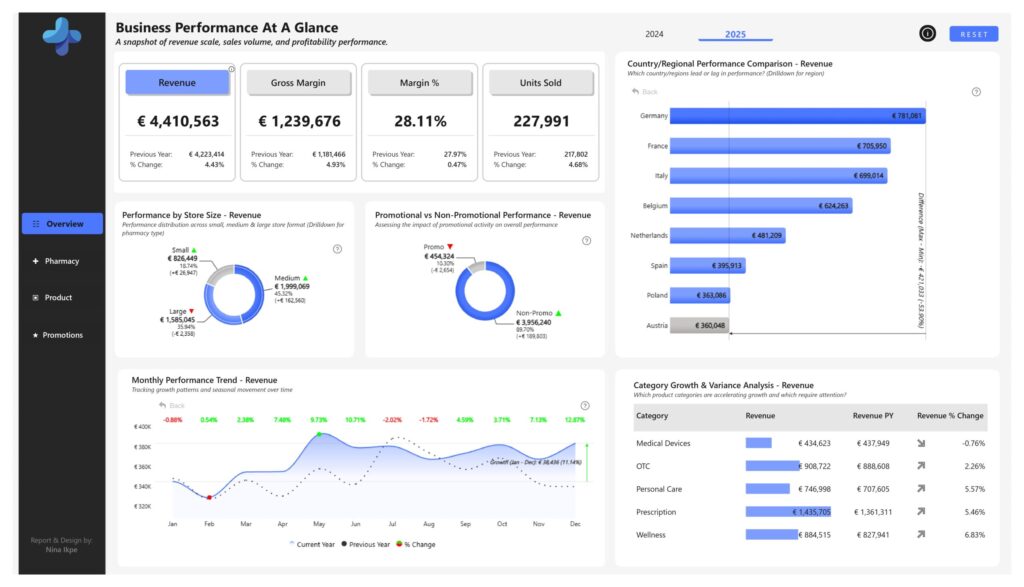
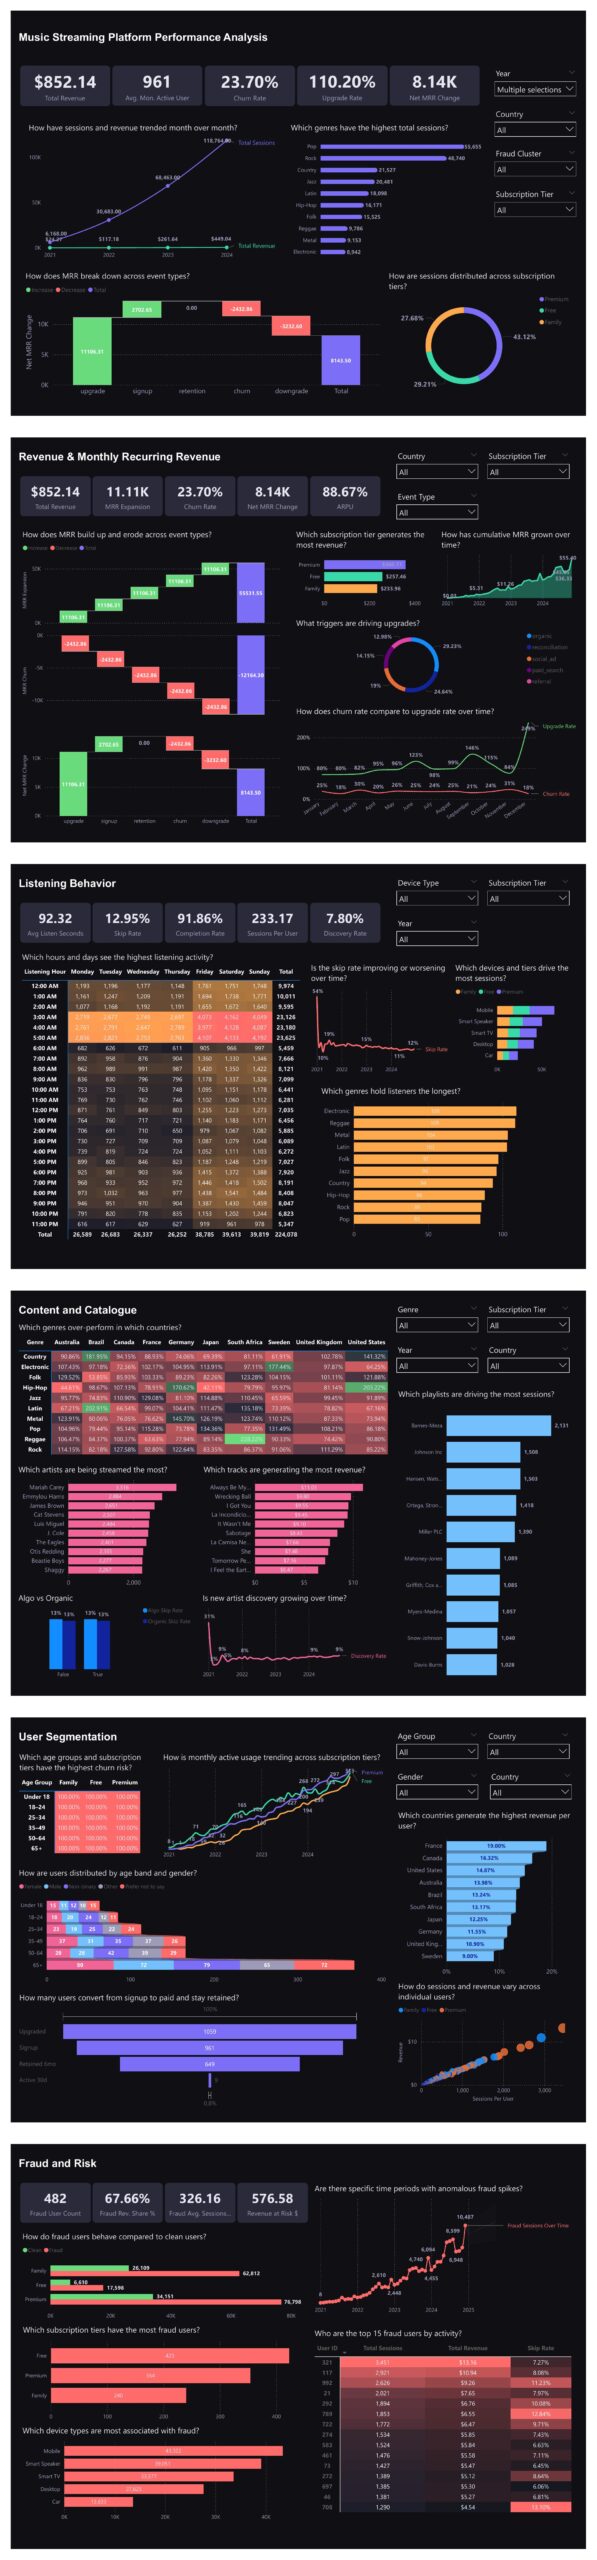
Tools: Power BI Desktop, DAX, Power Query Approach: Built a star schema data model with 2 fact tables, 9 dimension...
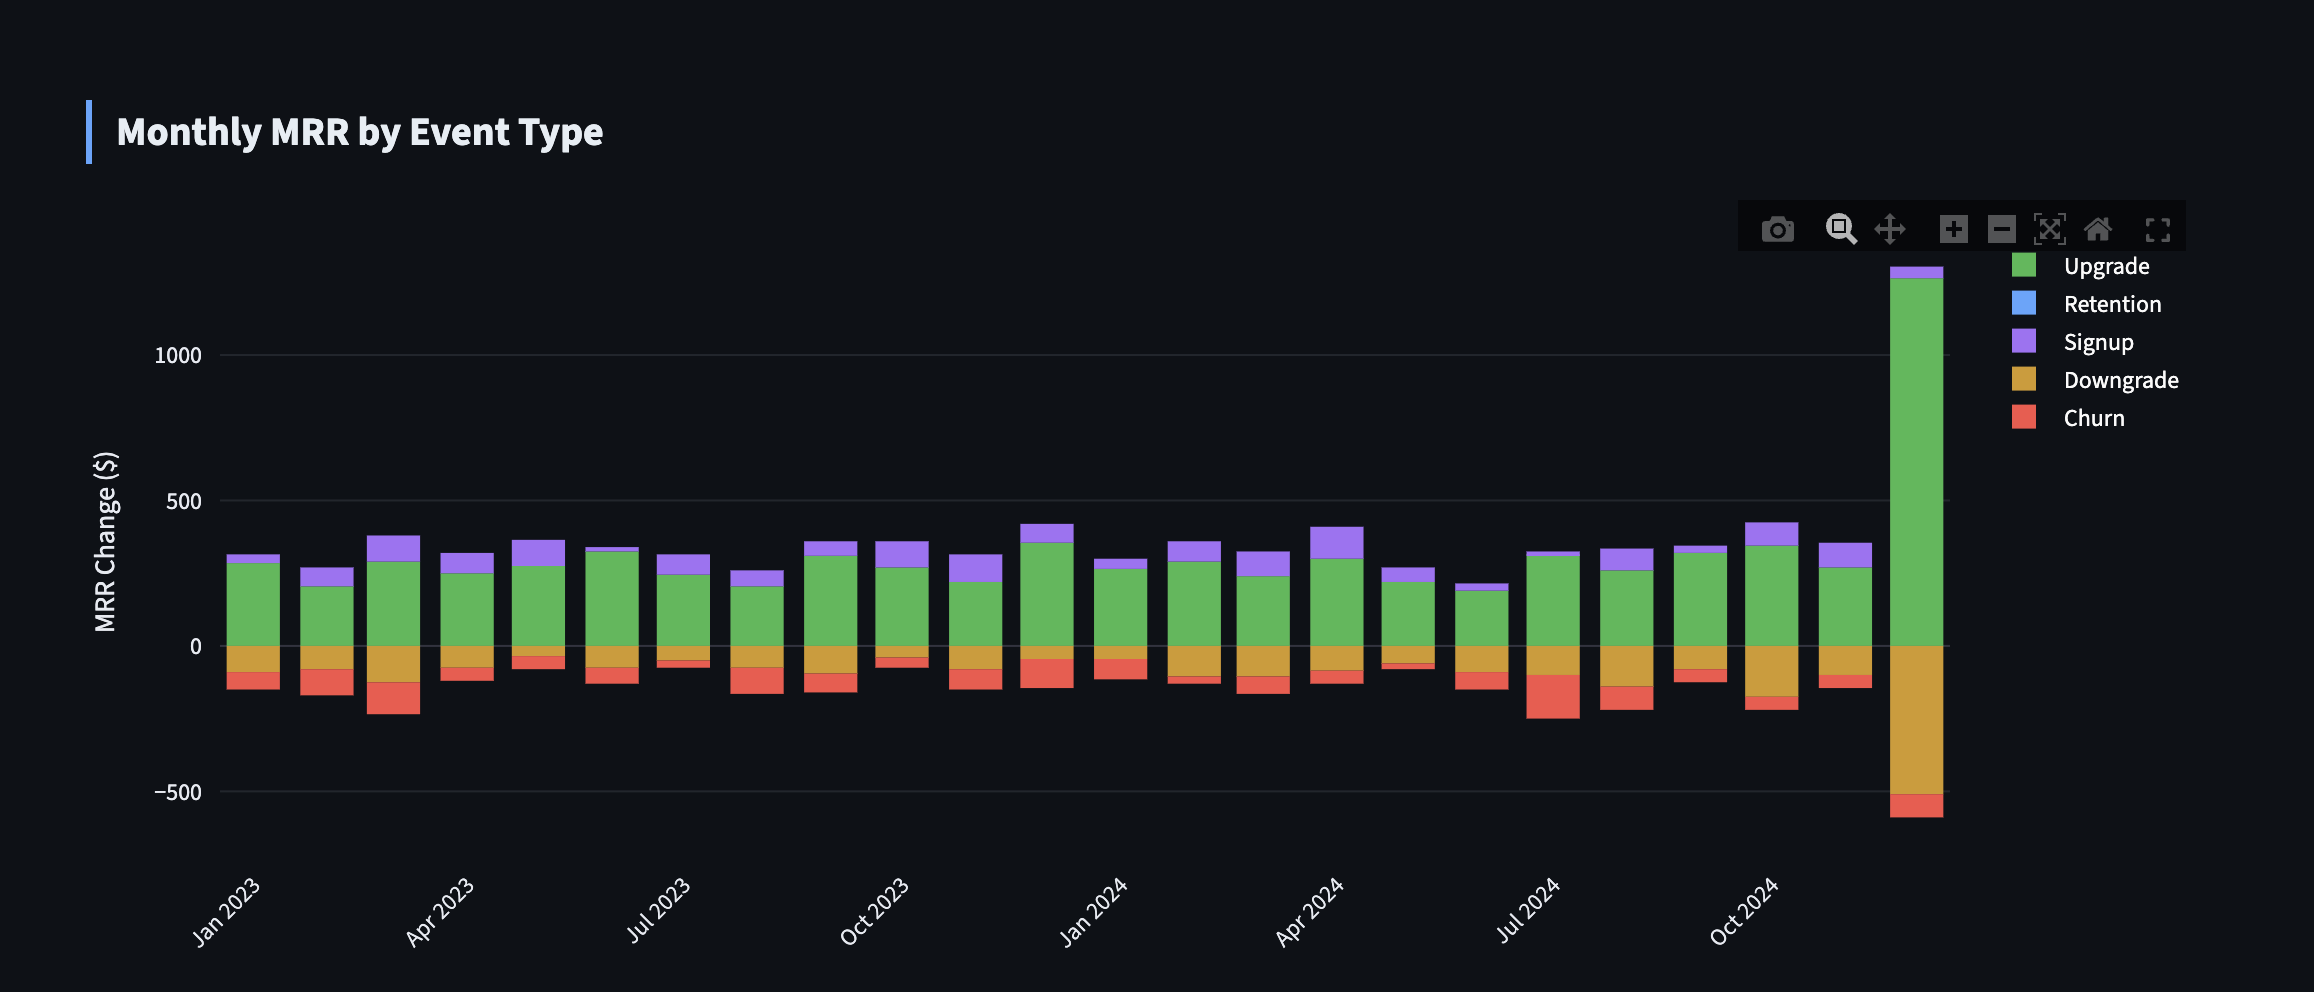
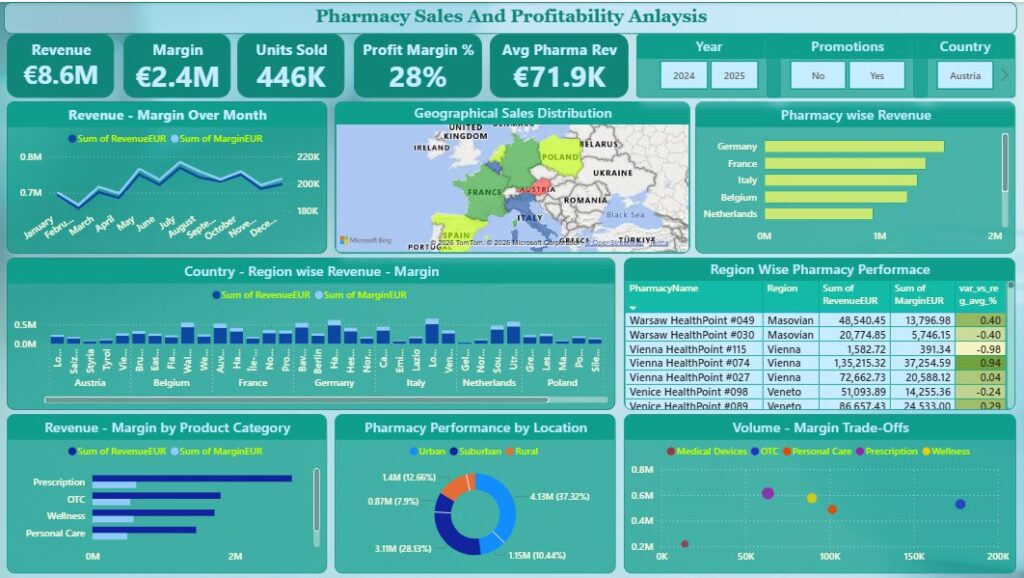
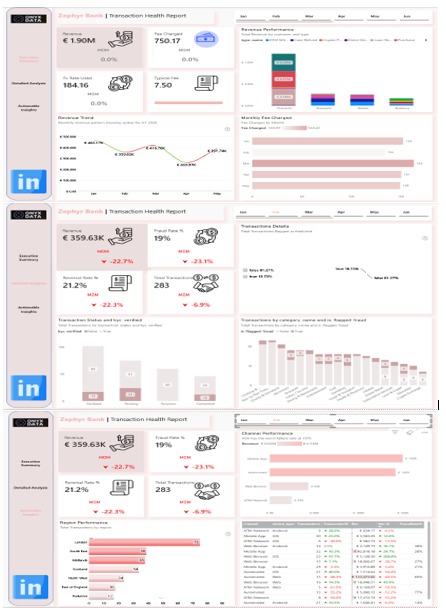
I used the Streamlit app, the plotly library mainly. I have added only a small part of my visualisation in...
For this challenge, I analysed a Music Streaming Platform dataset covering user behaviour, subscription lifecycle, content performance, and fraud risk....
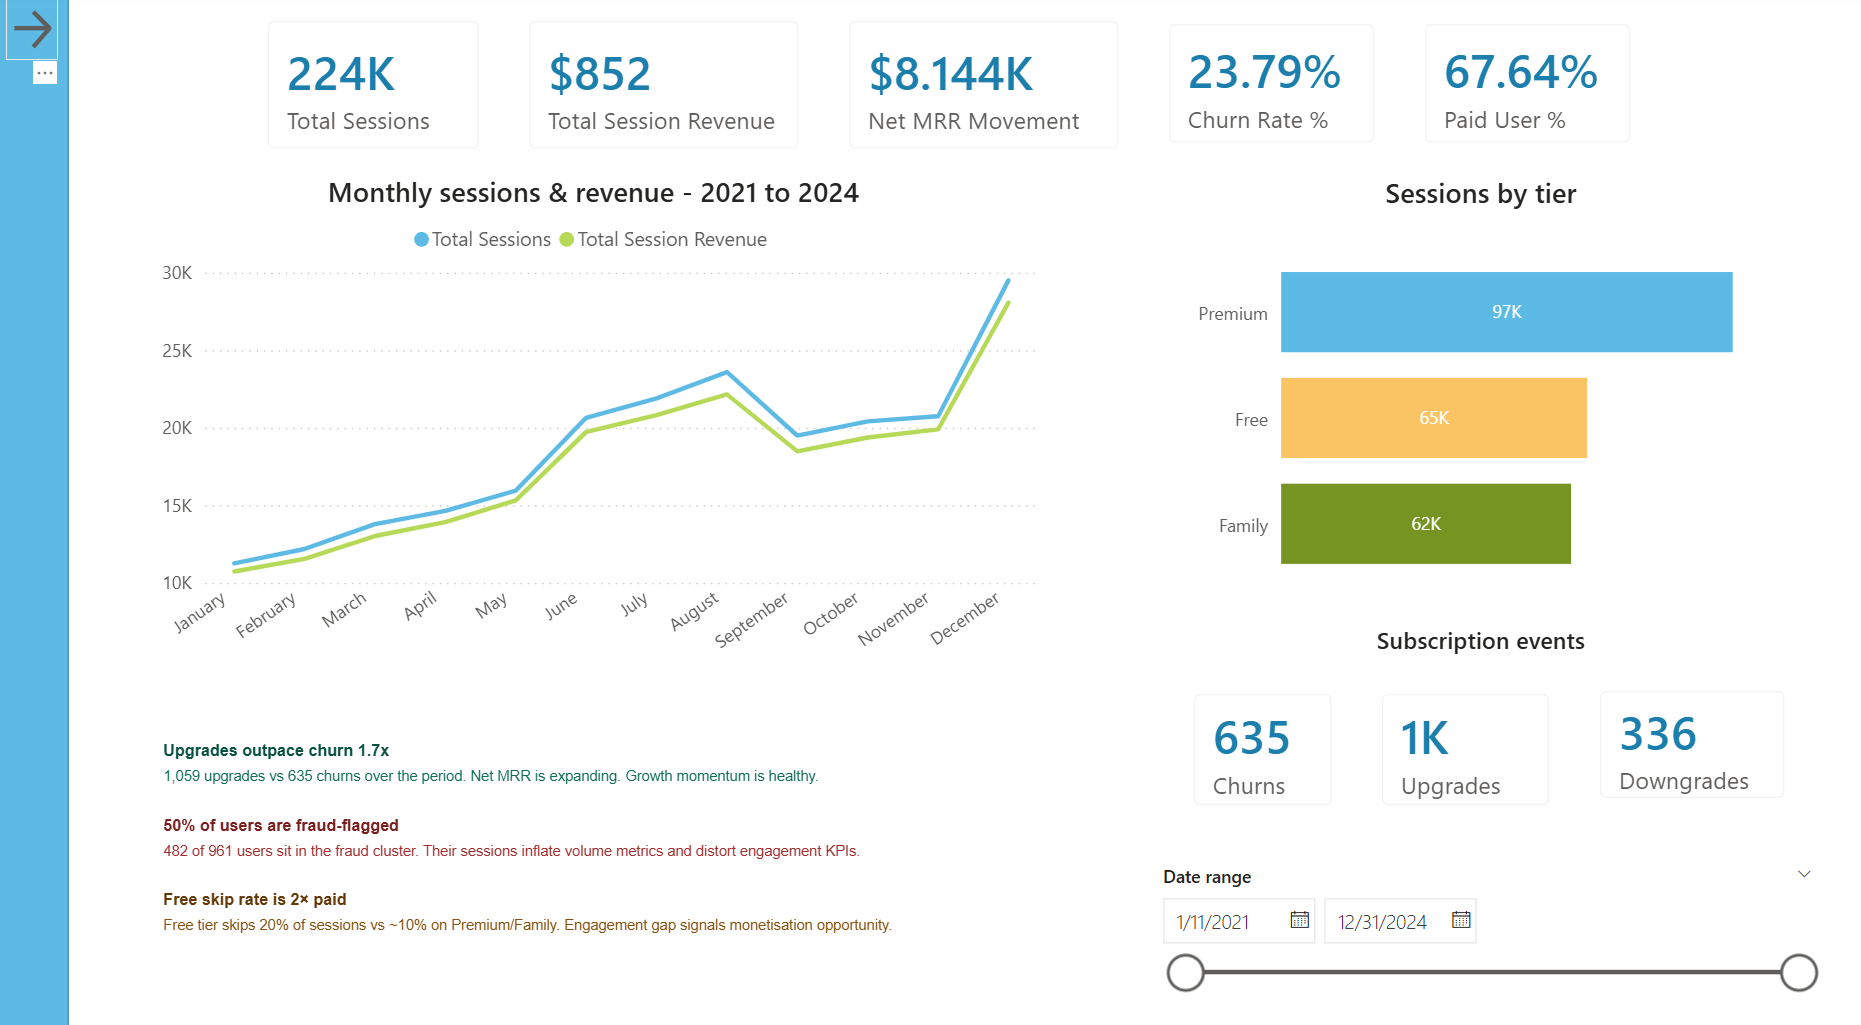
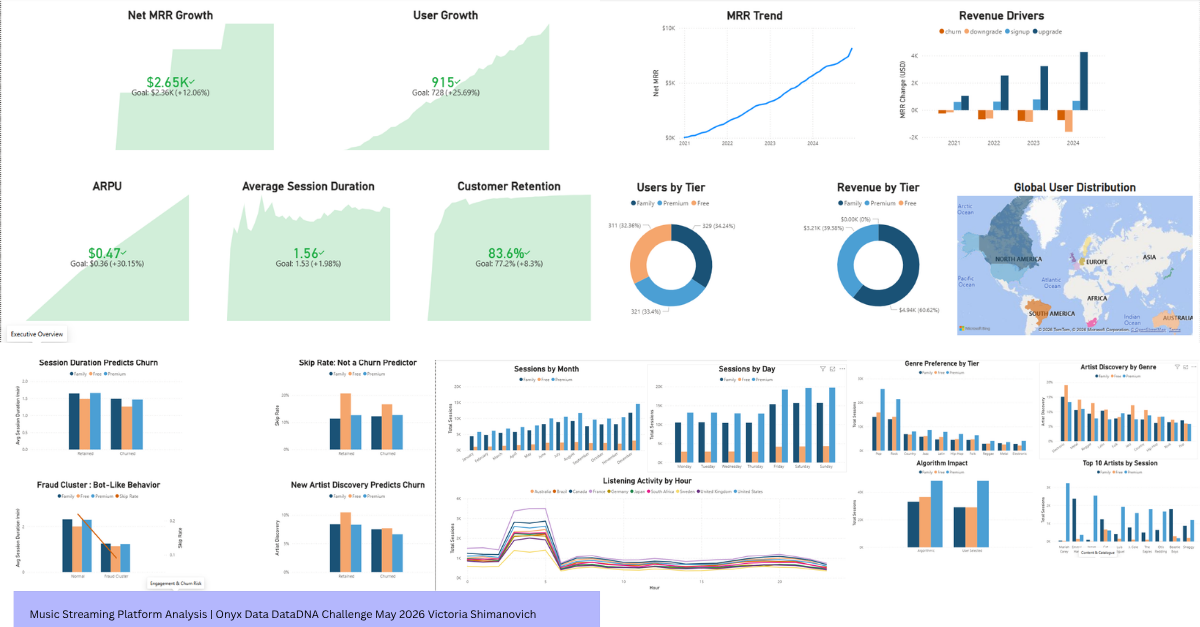
A four-year deep dive into a music streaming platform’s performance – uncovering revenue trends, subscription lifecycle, engagement gaps, fraud patterns,...
Discover the latest AI & Data challenges


Contact our team

16 Upper Woburn Place, London, Greater London, WC1H 0AF, United Kingdom