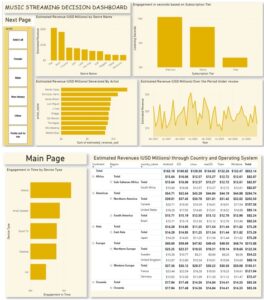
Join a community of the most creative Business Intelligence Professionals
Join a community of the most creative Business Intelligence Professionals

My submission for the ONYX Data Challenge: Music Streaming Analytics in Power BI. 📊 Page 1: Executive Streaming Overview 🎤...

Data visualization challenges like these are a great way to experiment with new visual concepts, storytelling techniques, color palettes, and...

🚨 1. Unmasking the High-Frequency Outliers On the Content & Fraud page, I engineered a Streaming Frequency Scatter Plot. By...
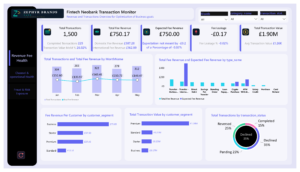
I took a layered, narrative-first approach to this report — moving from the big picture down to the details that...
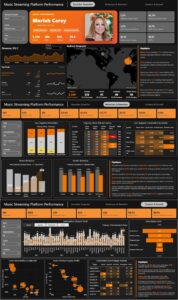
I’ve just completed my submission for the May 2026 #DataDNA Challenge by Onyx Data, where the goal was to analyse...
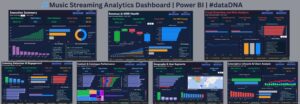
Analysed 4 years of music streaming data across 224,000 sessions, 961 users and 10 markets using Power BI and DAX....
 Get In Touch
Contact our team

16 Upper Woburn Place, London, Greater London, WC1H 0AF, United Kingdom