Join a community of the most creative Business Intelligence Professionals
Join a community of the most creative Business Intelligence Professionals
View the DataDNA Data Visualisation portfolios below
Browse AI-reviewed portfolios from our global community of data professionals
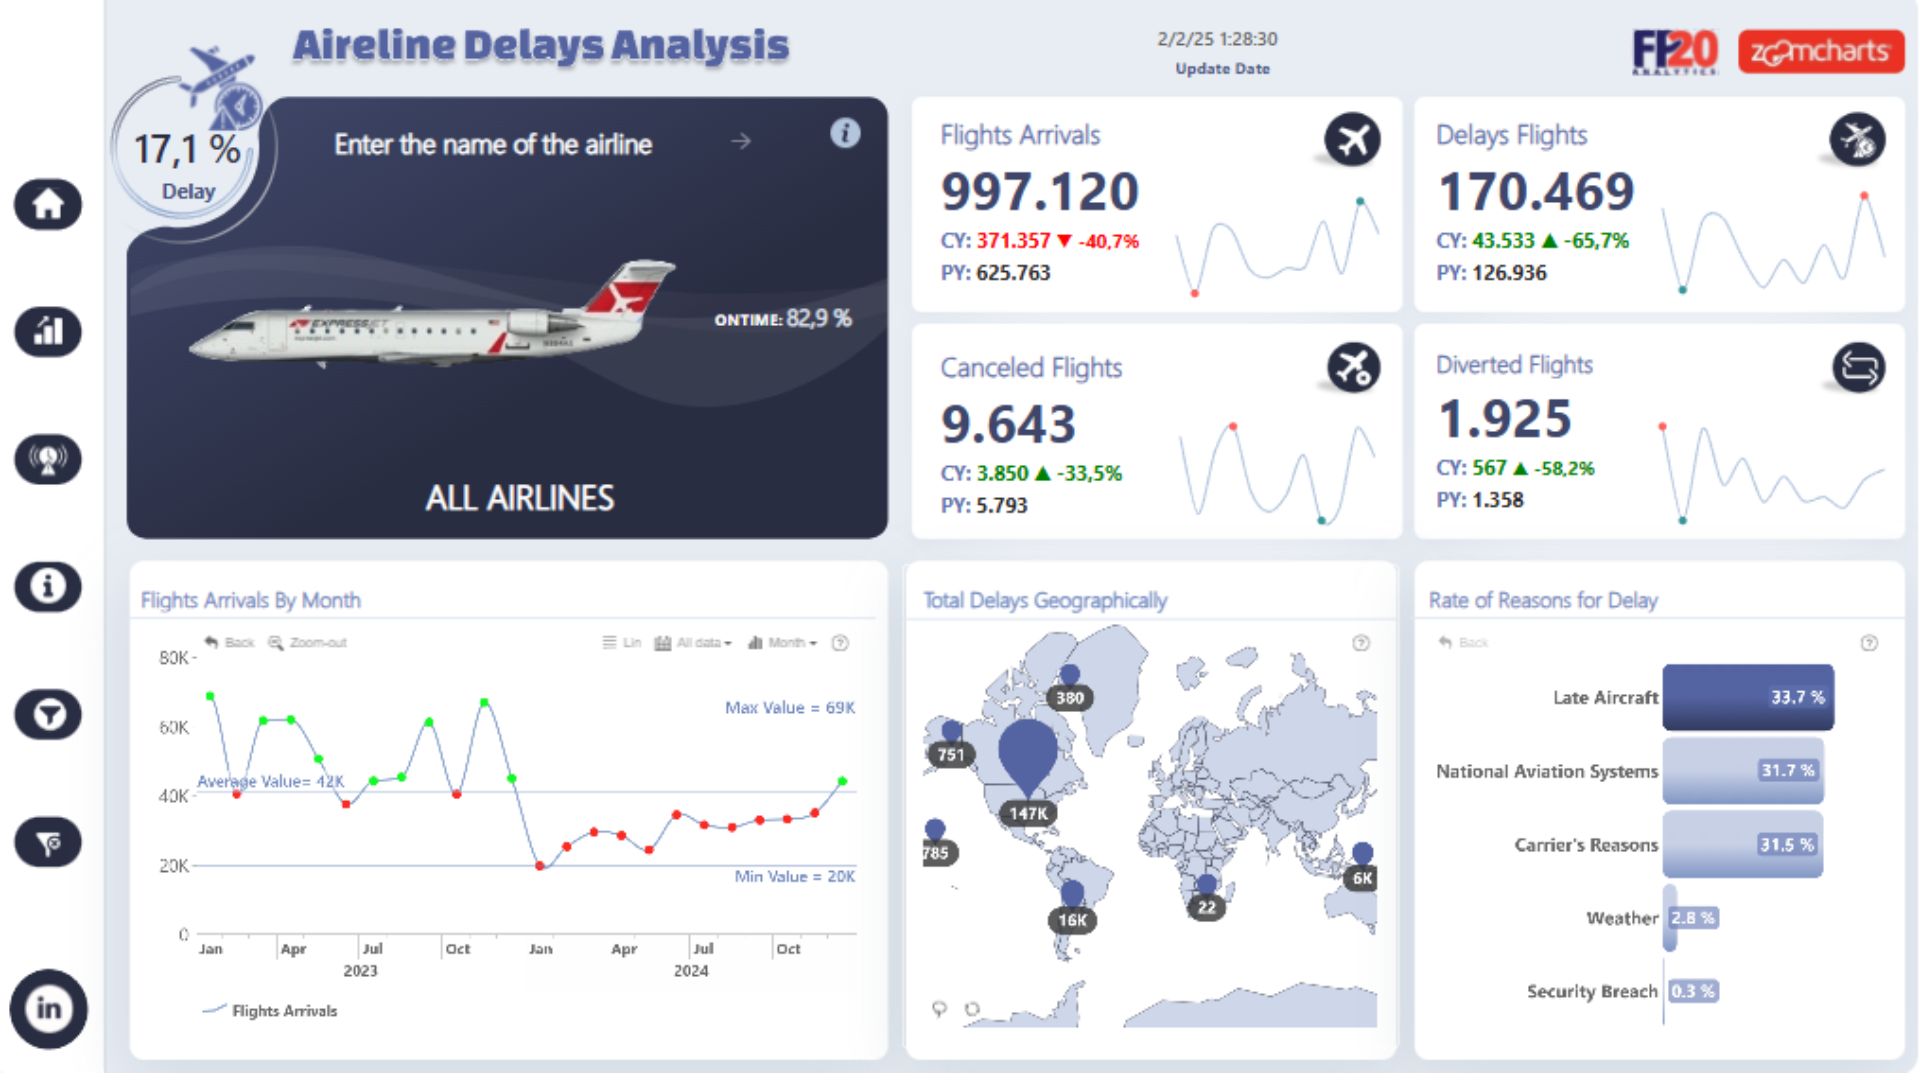
Este dashboard provee una visión integral sobre la puntualidad de las aerolíneas, mostrando una tasa promedio de 17.1% de retrasos....

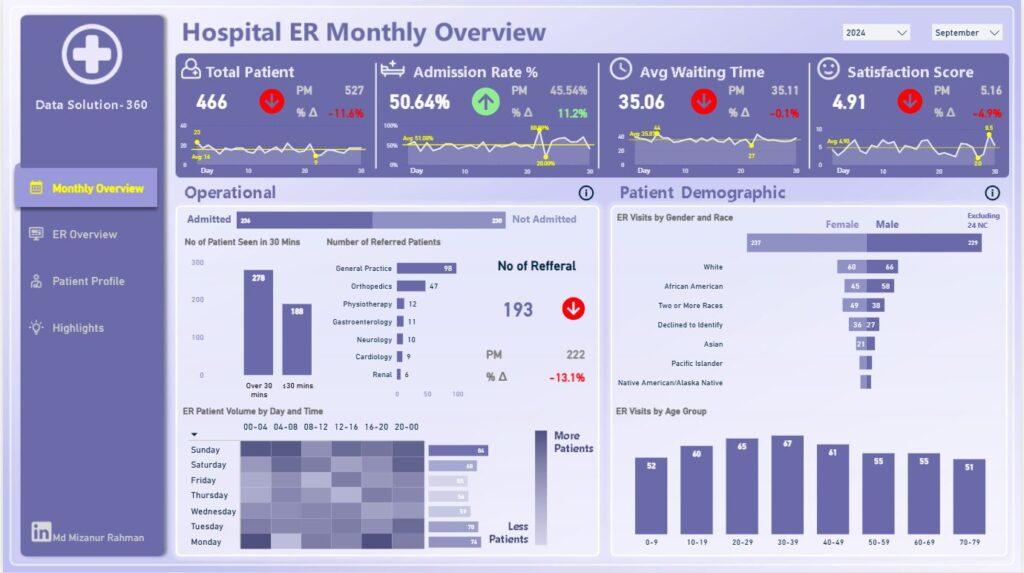
Dashboard que muestra el volumen total de tickets, el tiempo promedio de resolución, el porcentaje atendido en menos de 2...

Cuadro de Mando Estratégico de E-commerce. Este informe monitorea el rendimiento financiero (Net Revenue, Quantity Sold) y el comportamiento del...
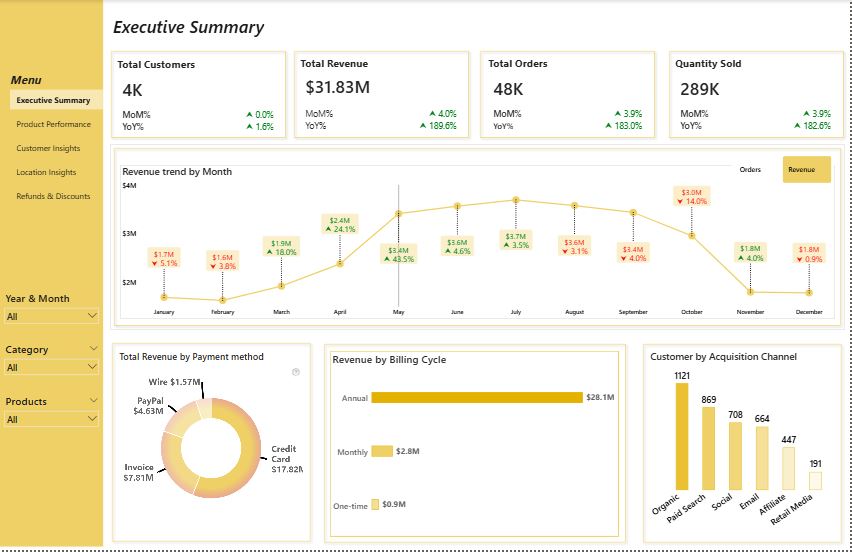
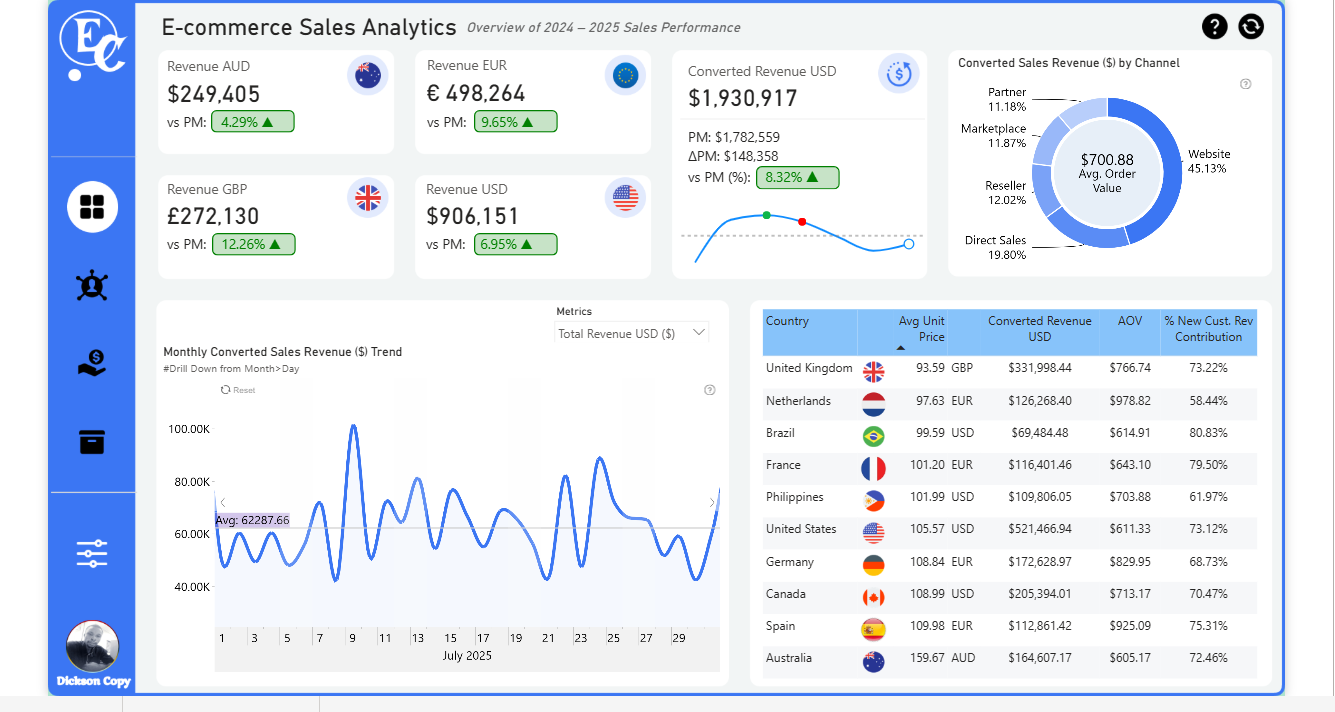
This dashboard provides a comprehensive view of the company’s sales, customer behavior, and product performance across global markets. It tracks...
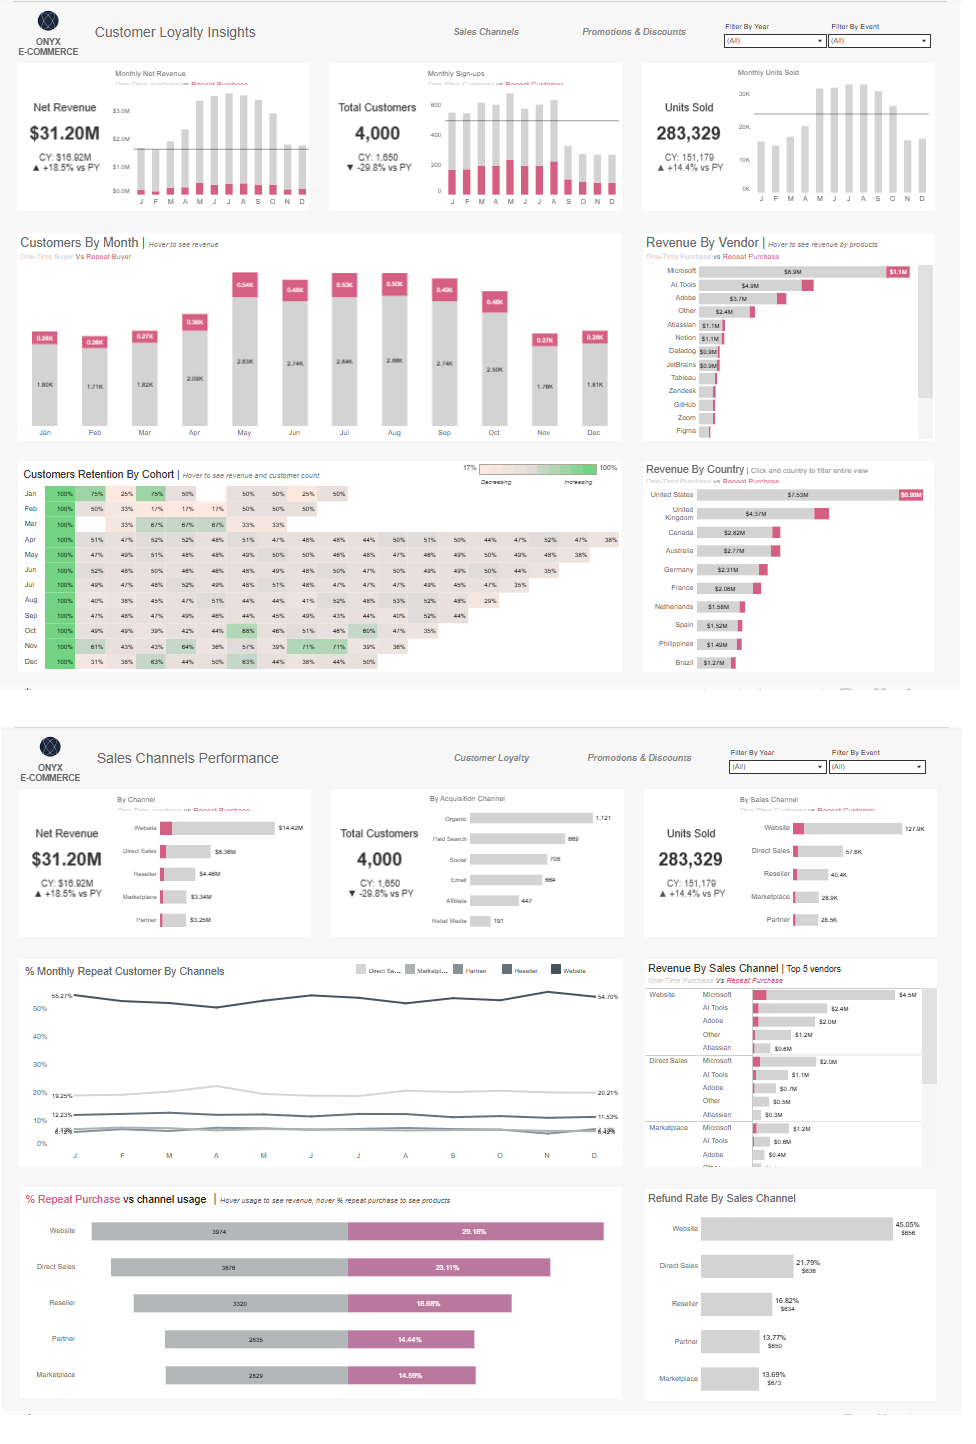
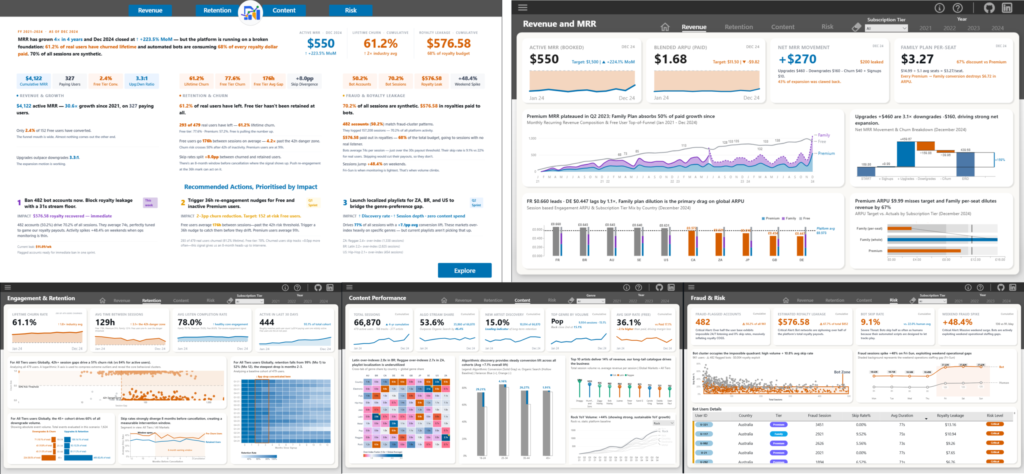
Here are the insights that stood out most: 1. Revenue is rising, even though customer sign-ups are falling The analysis...

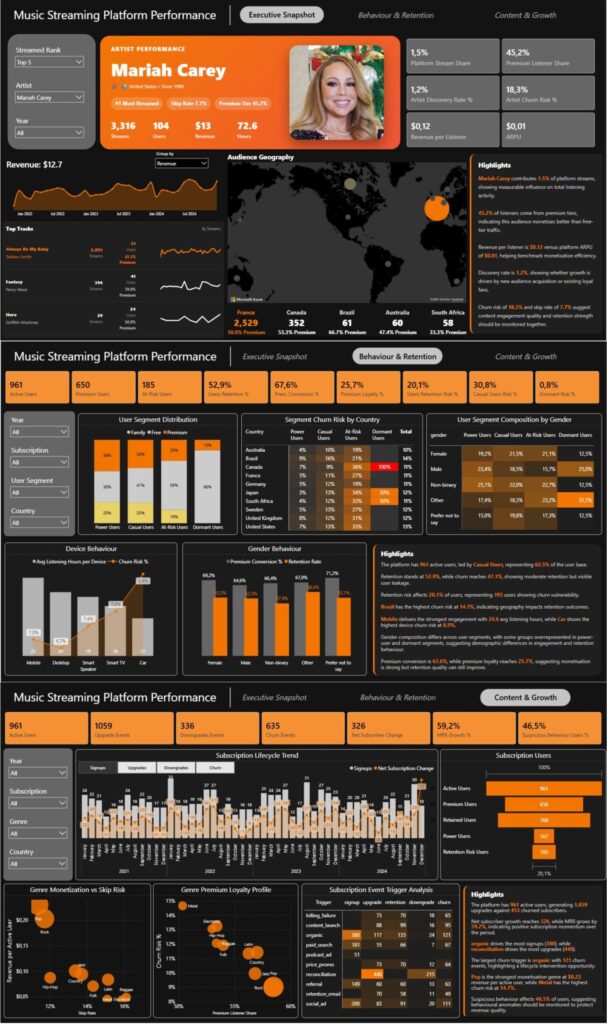
For this challenge, I’ve taken inspiration from the beautifully designed dashboard created by Tiffany Effinger for the Maven Northwind Challenge...

Highly motivated BI & Data Analyst with 5+ years of experience delivering data-driven solutions, building business intelligence dashboards, optimizing financial...
The report focuses on monthly sales trends, customer behaviour, revenue and profitability drivers, and the fastest-selling products.
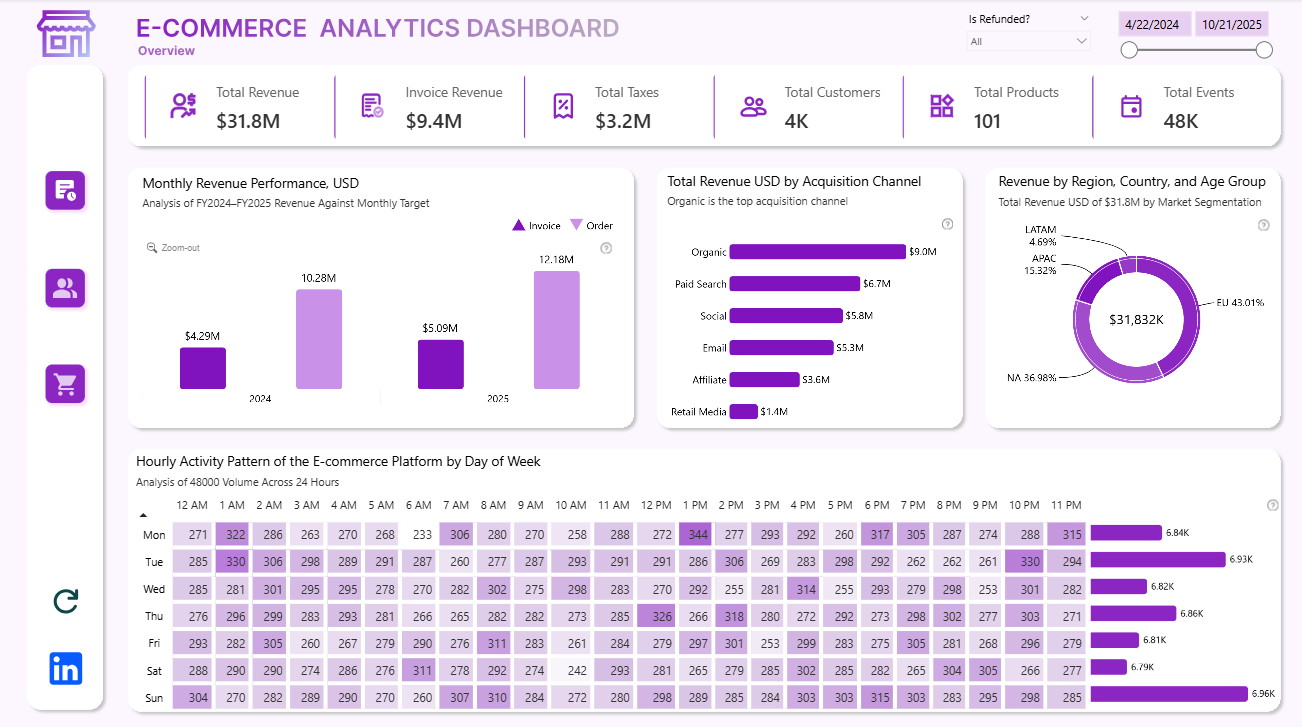
This project analyzed e-commerce sales data to build a comprehensive dashboard tracking $31.8M in revenue and identifying key loyal customer...
Discover the latest AI & Data challenges


Contact our team

16 Upper Woburn Place, London, Greater London, WC1H 0AF, United Kingdom