Join a community of the most creative Business Intelligence Professionals
Join a community of the most creative Business Intelligence Professionals
View the DataDNA Data Visualisation portfolios below

In this project, I tried to explore the history of Mount Everest.

Developed Power BI Hospital Emergency Room(ER) Dashboard to track KPIs & improve patient flow. Provides insights & actionable recommendations for...
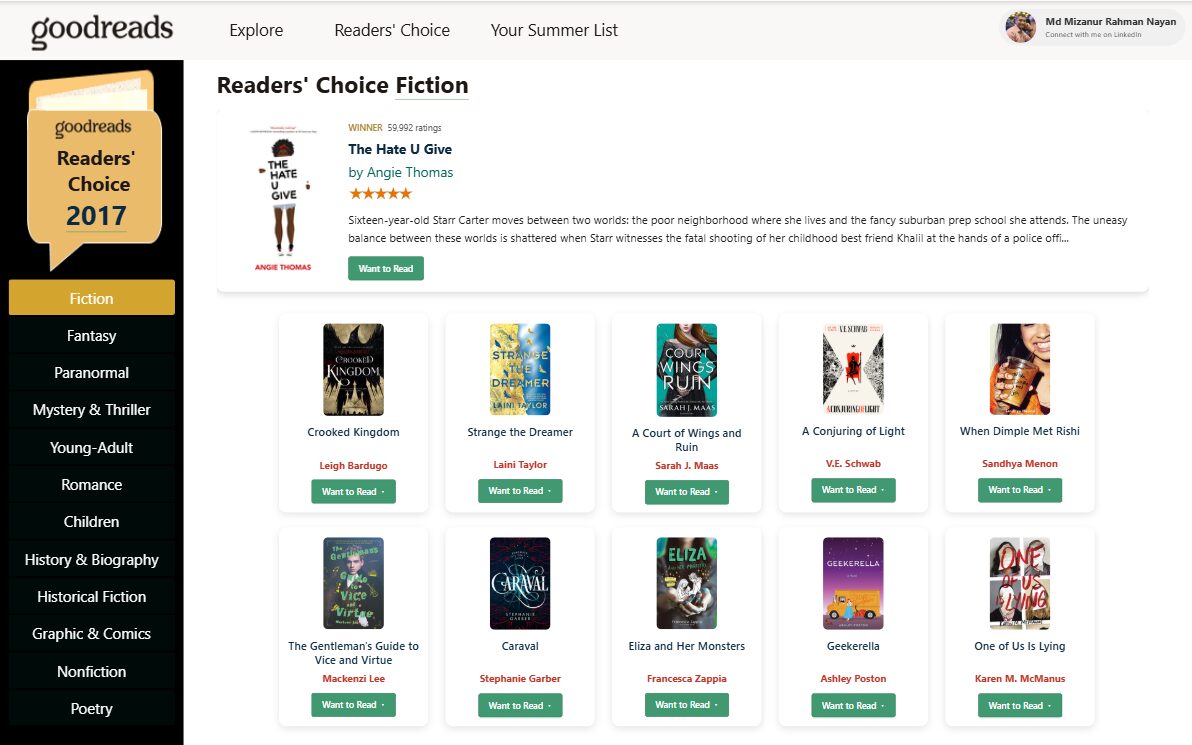
This dashboard will help users build their ideal summer reading list.

Comprehensive analysis of bank marketing campaigns to identify customer segmentation patterns, campaign effectiveness, and predictive insights for improving marketing ROI.
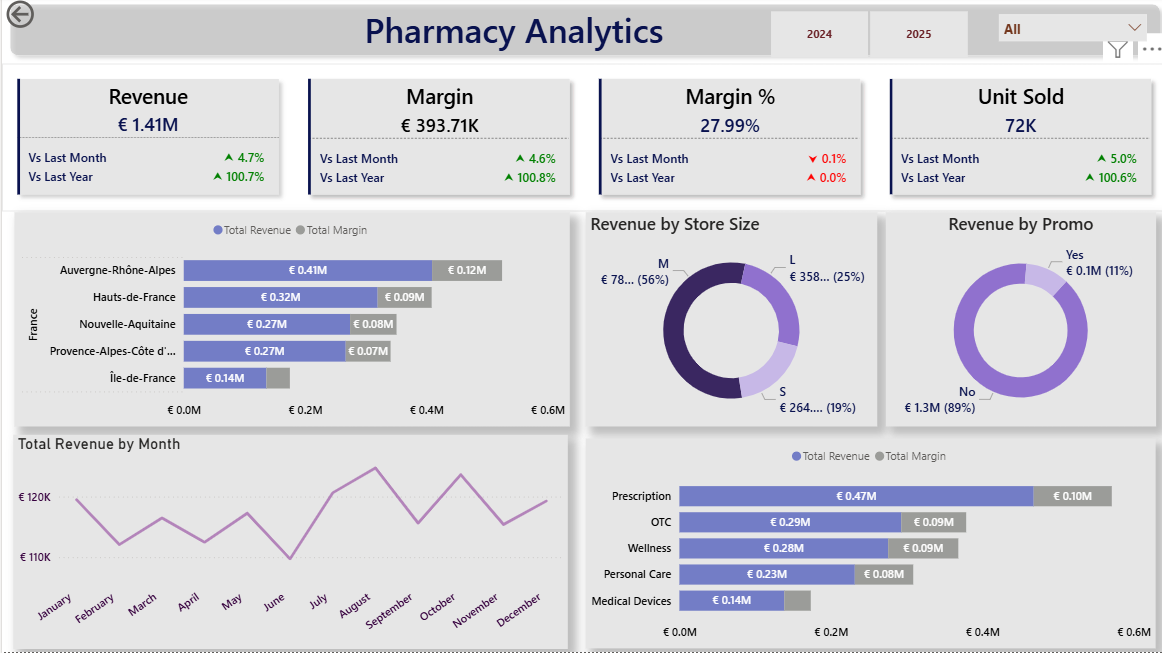
Developed an interactive Power BI dashboard to analyze daily sales transactions across multiple European countries, regions, and individual pharmacies. The...
Cool ideas on positioning stacked charts using special columns+rows and pop-up tooltip with line charts.
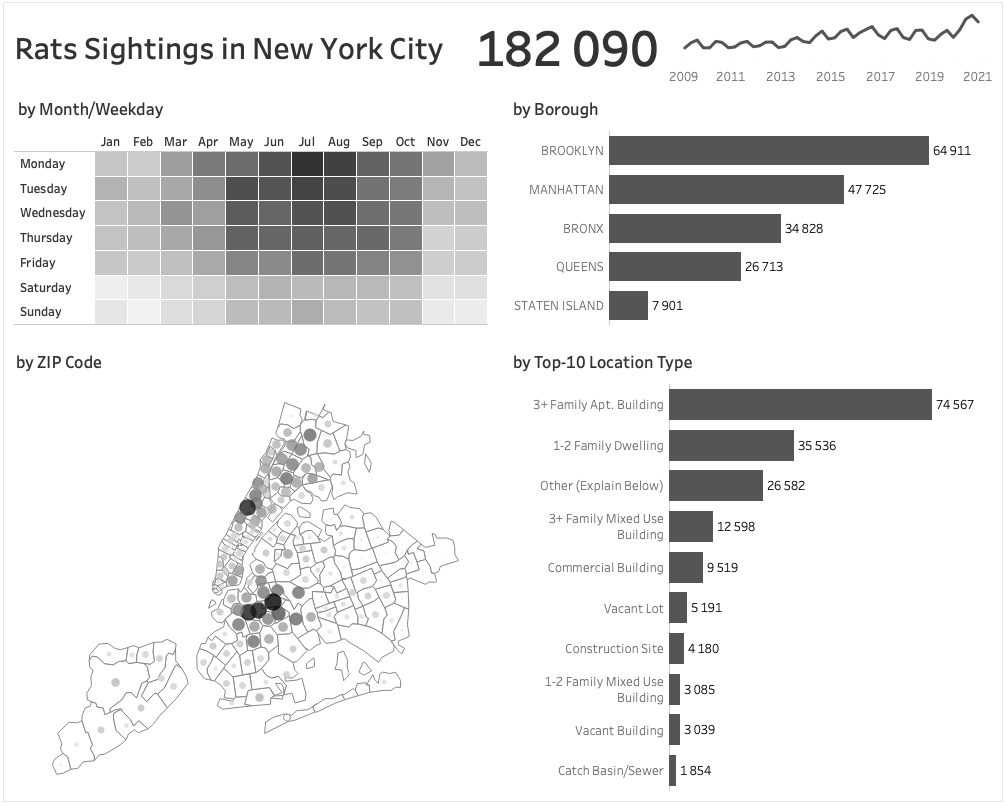
I’ve changed my mind about black-and-white dashboards. It’s so clear. Accents are achieved through opacity. Previously, I considered such dashboards...
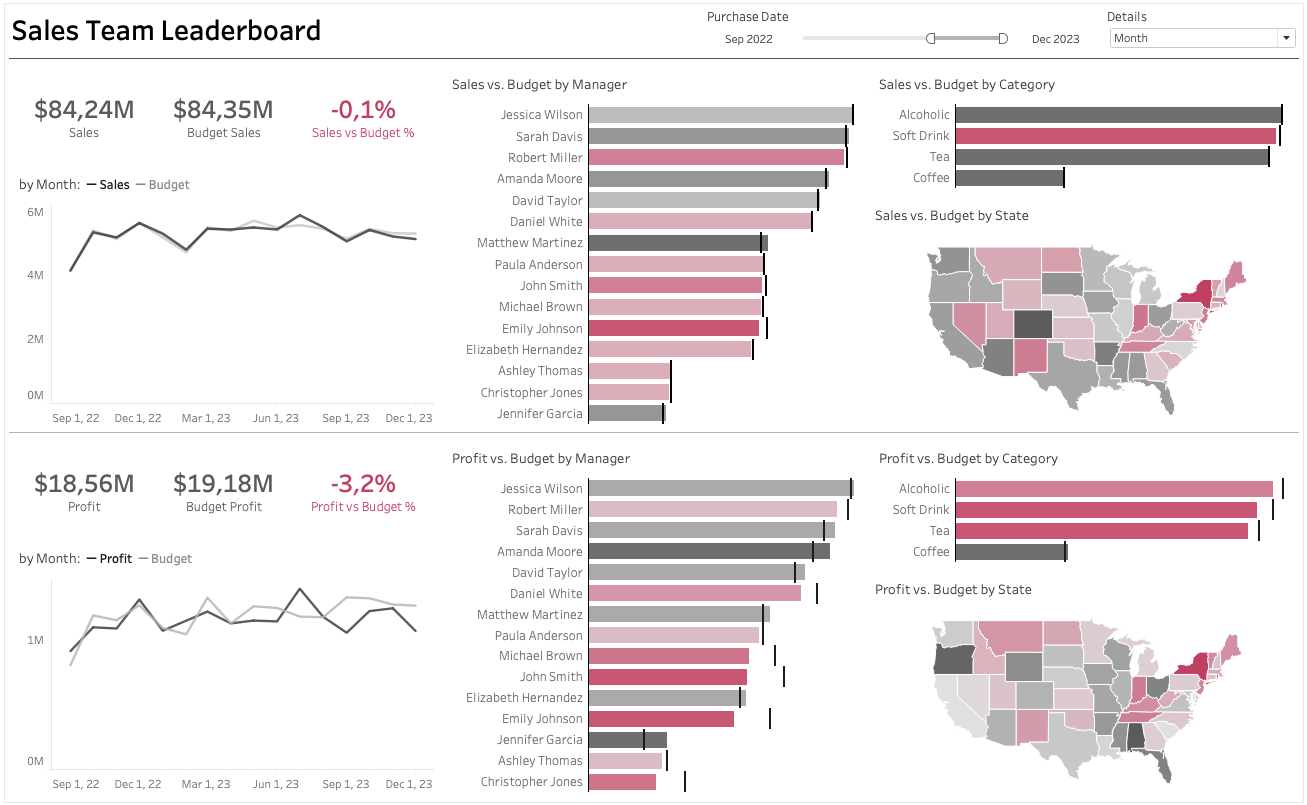
Which sales managers are best at selling tea and coffee? In which US states? Find the answers in just a...
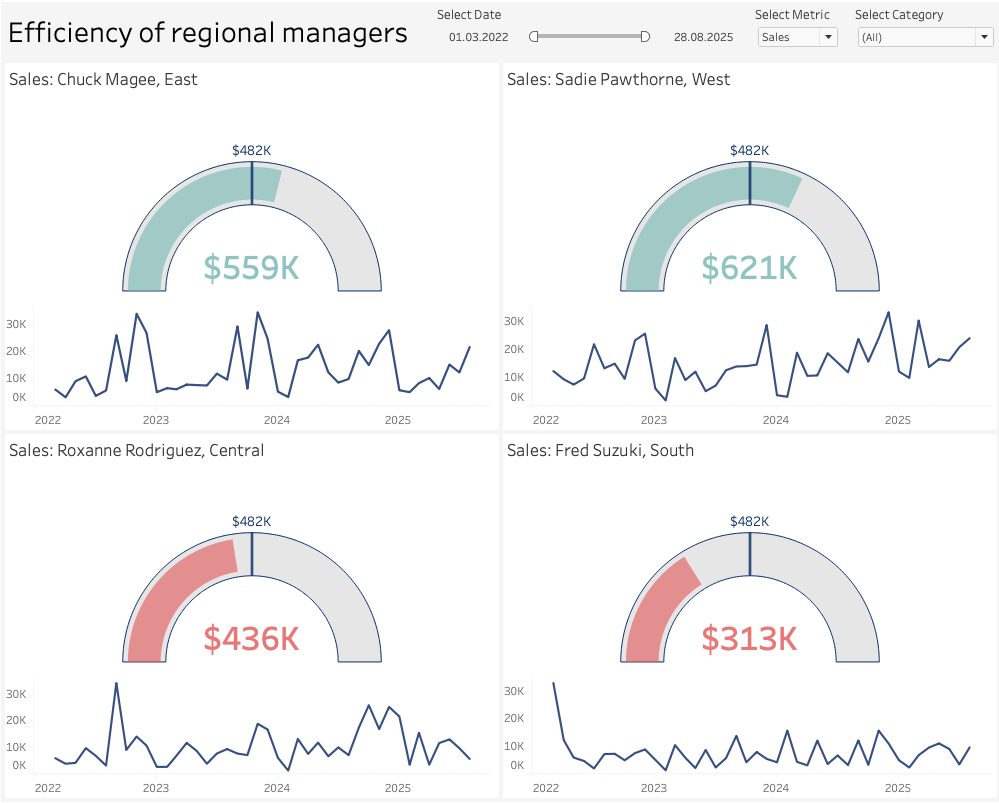
Quickly evaluate based on sales and profit. The combination of Gauge and Line charts allows to monitor the dynamics of...
Discover the latest AI & Data challenges


Contact our team

16 Upper Woburn Place, London, Greater London, WC1H 0AF, United Kingdom


