Join a community of the most creative Business Intelligence Professionals
Join a community of the most creative Business Intelligence Professionals
Find data professionals with skills verified through real challenge performance.
Browse Talent DirectoryCreate realistic synthetic data for training, testing, and demonstrations.
Explore Dataset Generator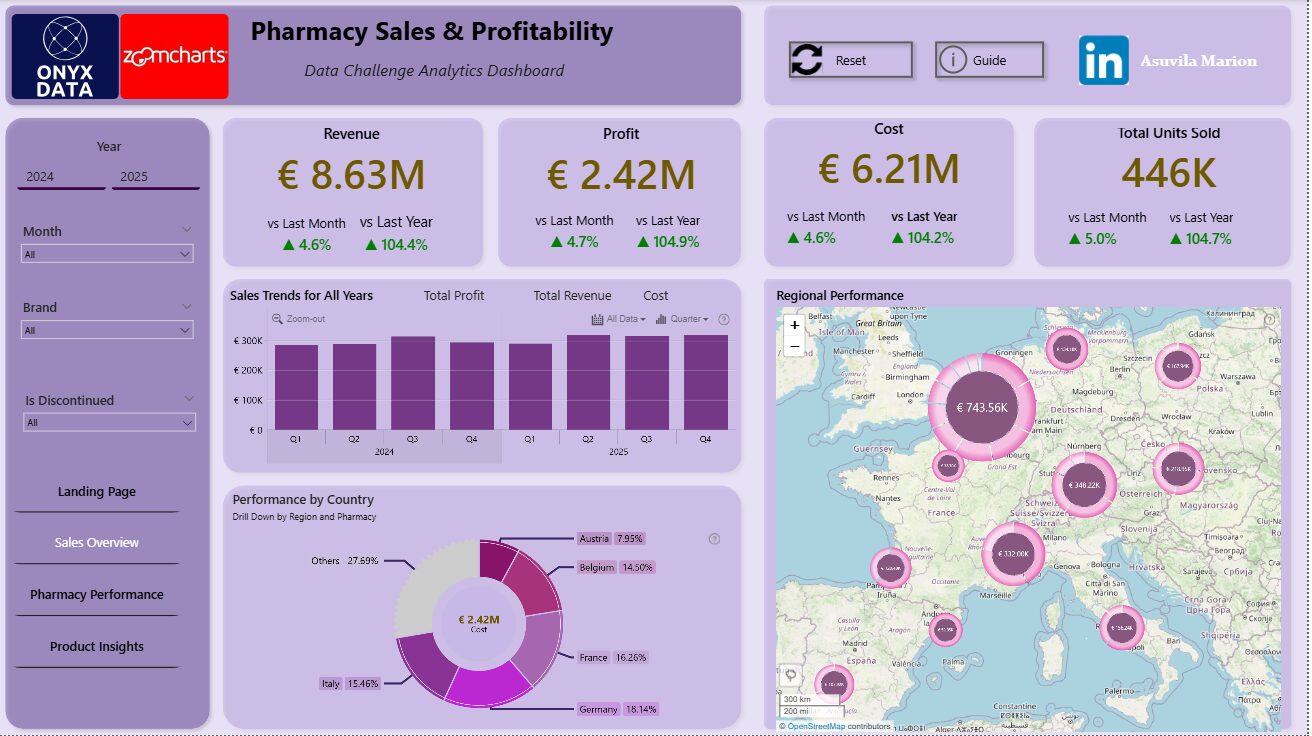
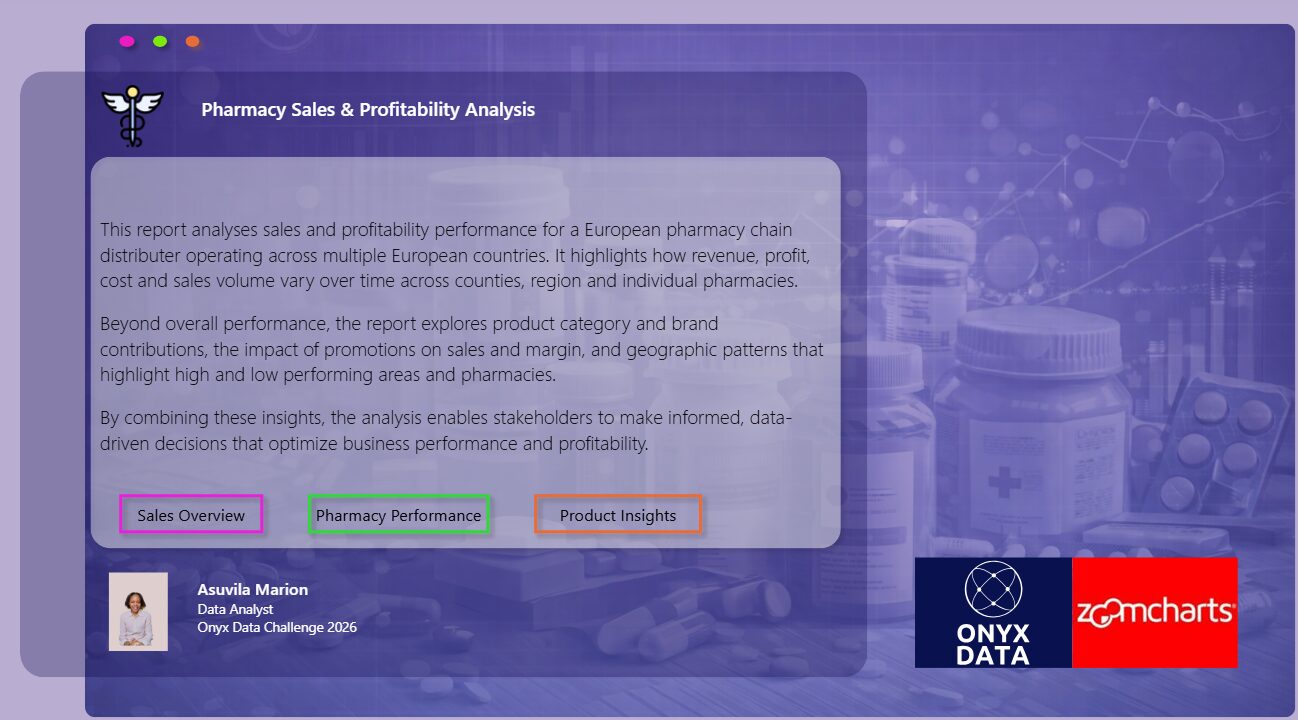
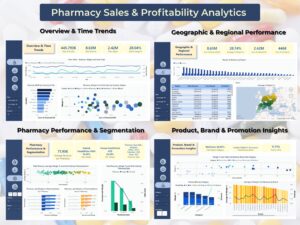
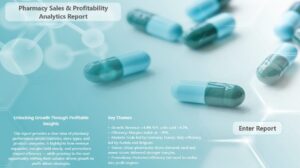
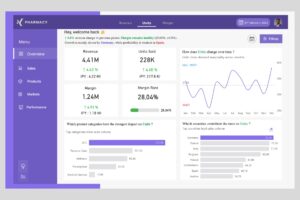
This report analyses sales and profitability performance for a European pharmacy chain distributer operating across multiple European countries. It highlights how revenue, profit, cost and sales volume vary over time across counties, region and individual pharmacies. Beyond overall performance, the report explores product category and brand contributions, the impact of promotions on sales and margin, and geographic patterns that highlight high and low performing areas and pharmacies. By combining these insights, the analysis enables stakeholders to make informed, data-driven decisions that optimize business performance and profitability.
Contact our team

16 Upper Woburn Place, London, Greater London, WC1H 0AF, United Kingdom


 ugo nwasuruba
 Mohamed ABBAKAR
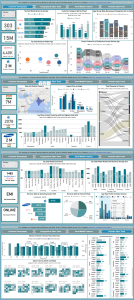
 Dhia Salsabila Azhar
 Cindy Jamaeca Balbag
 Wessel Tangai