Join a community of the most creative Business Intelligence Professionals
Join a community of the most creative Business Intelligence Professionals
Find data professionals with skills verified through real challenge performance.
Browse Talent DirectoryCreate realistic synthetic data for training, testing, and demonstrations.
Explore Dataset Generator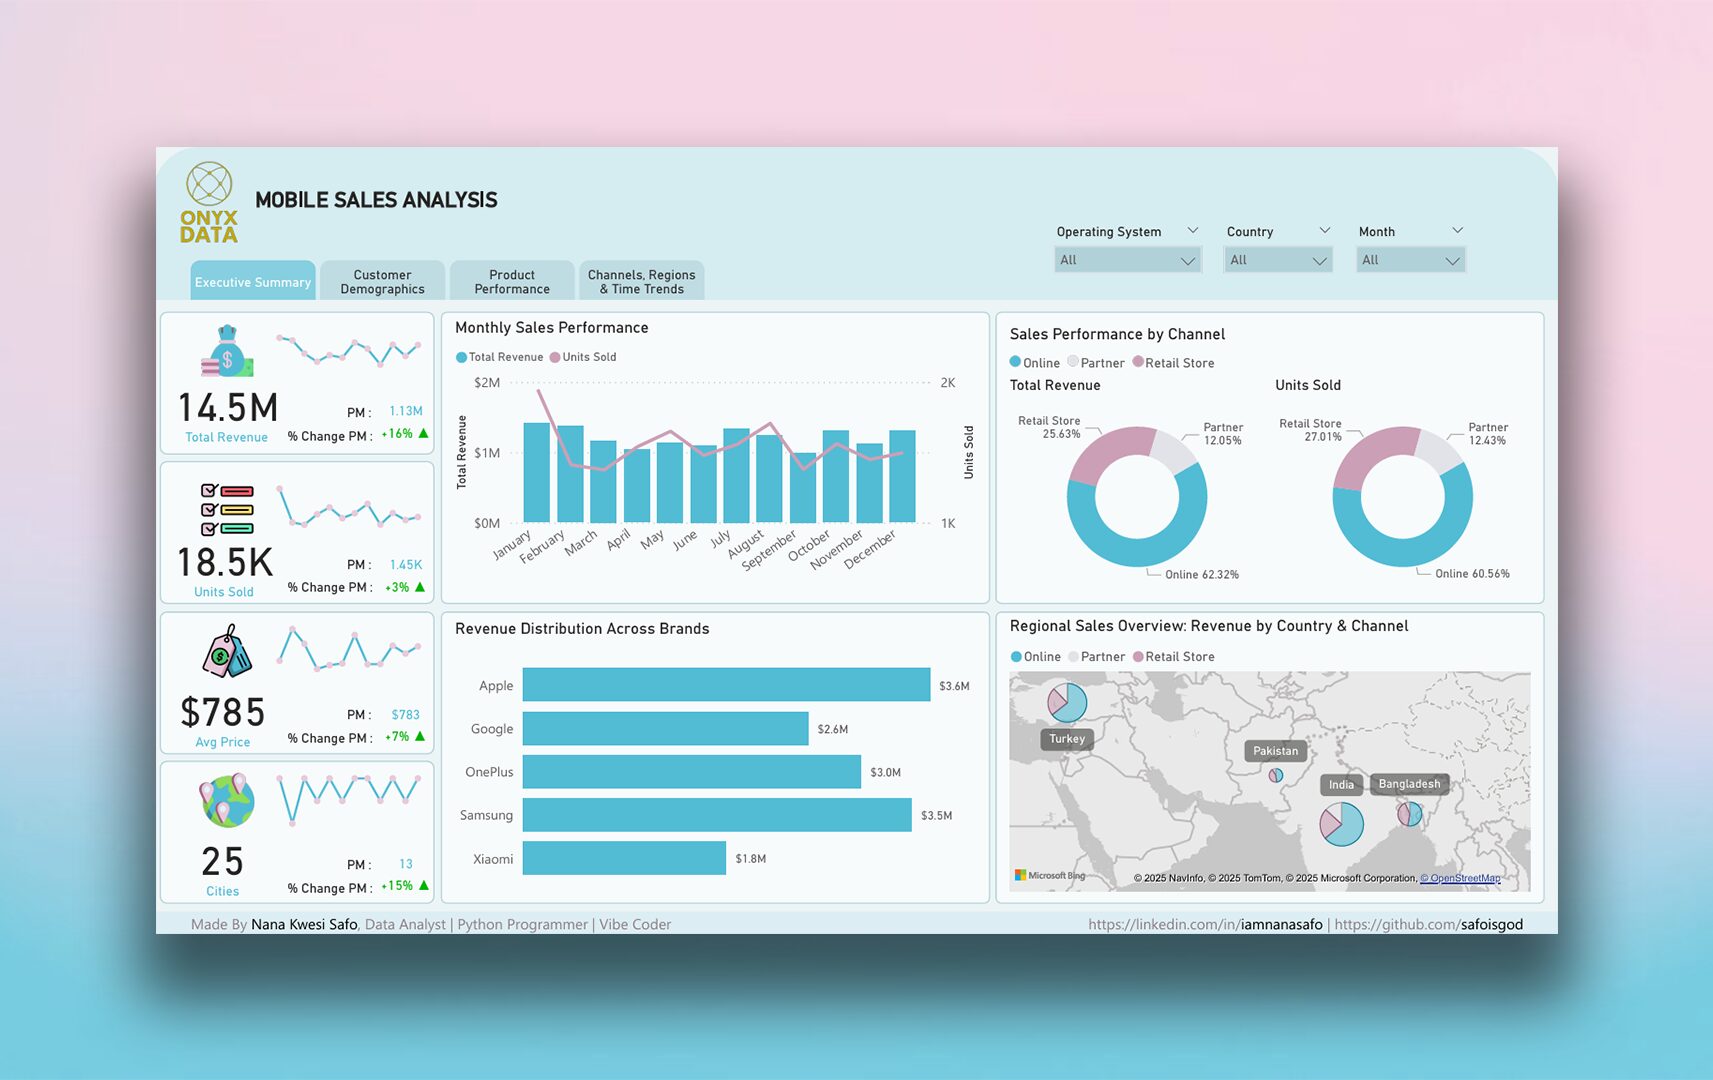
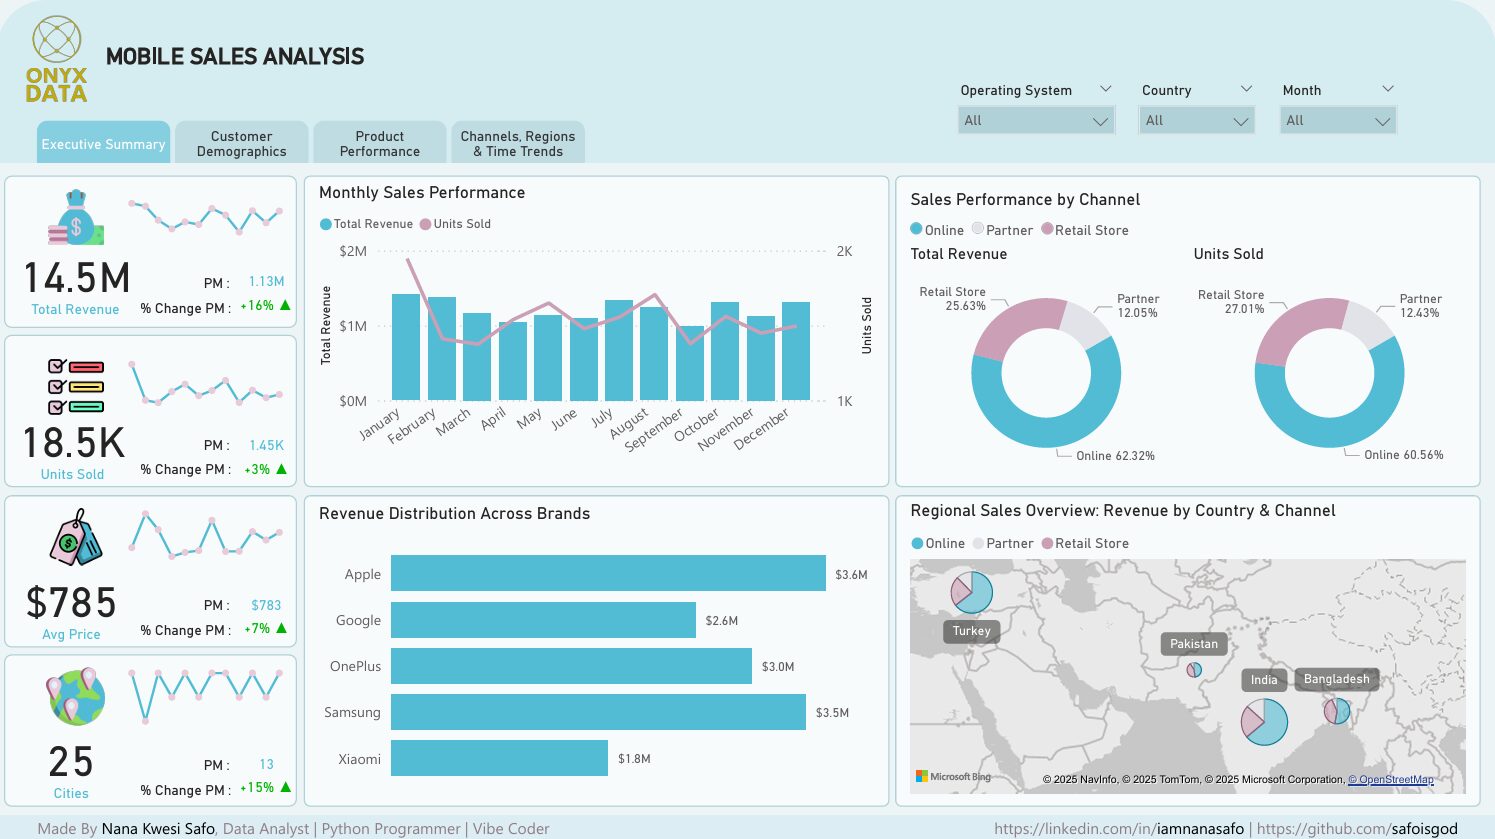
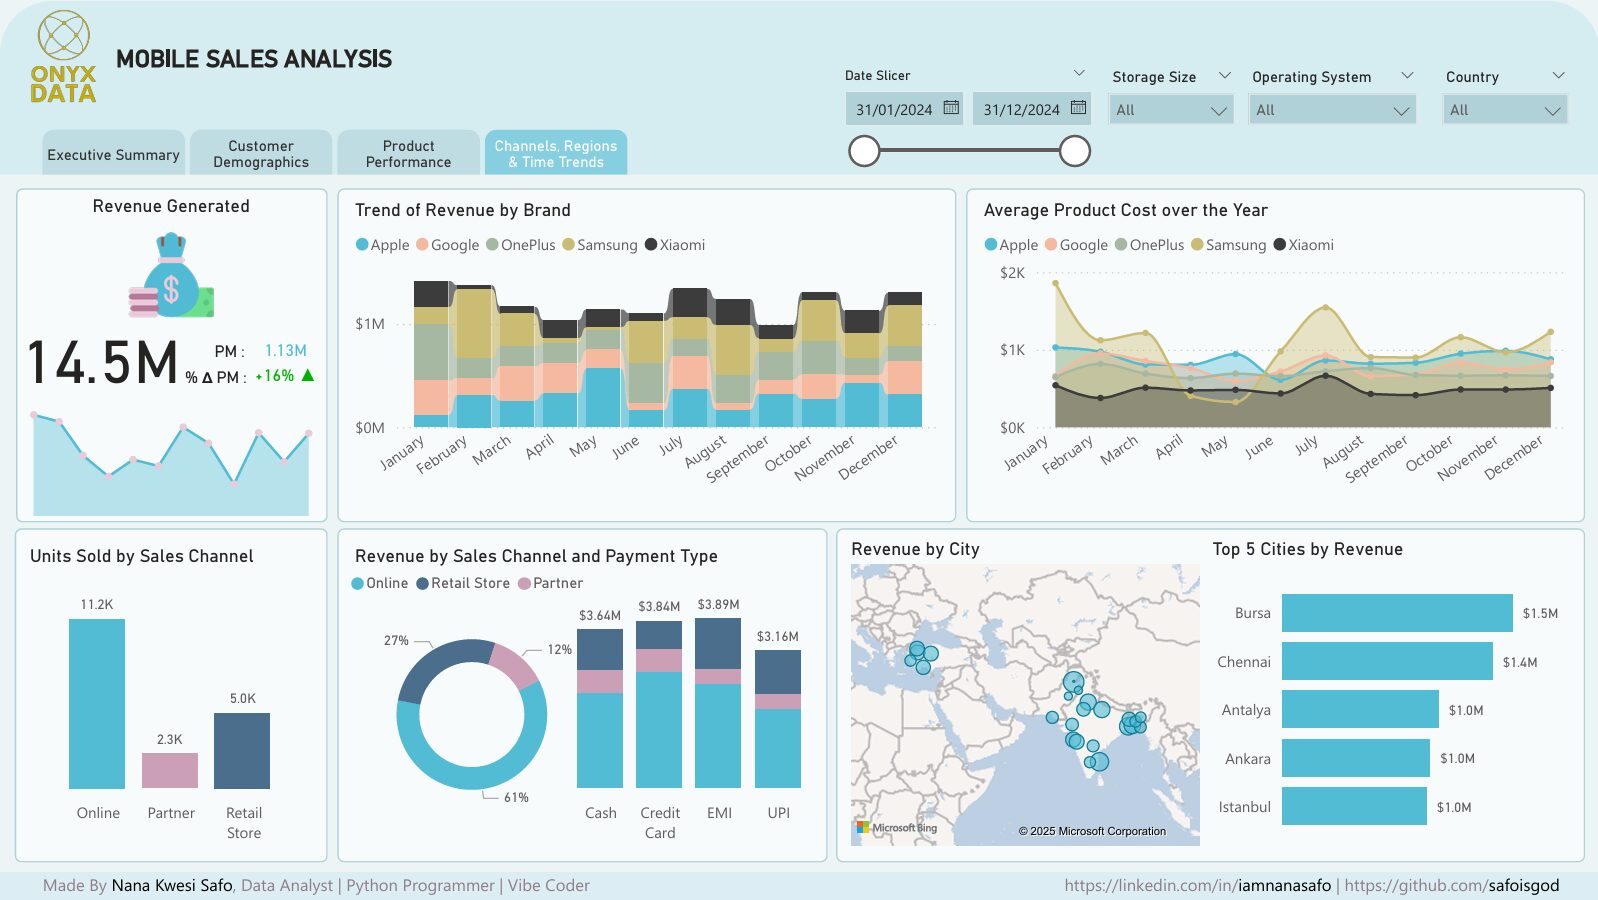
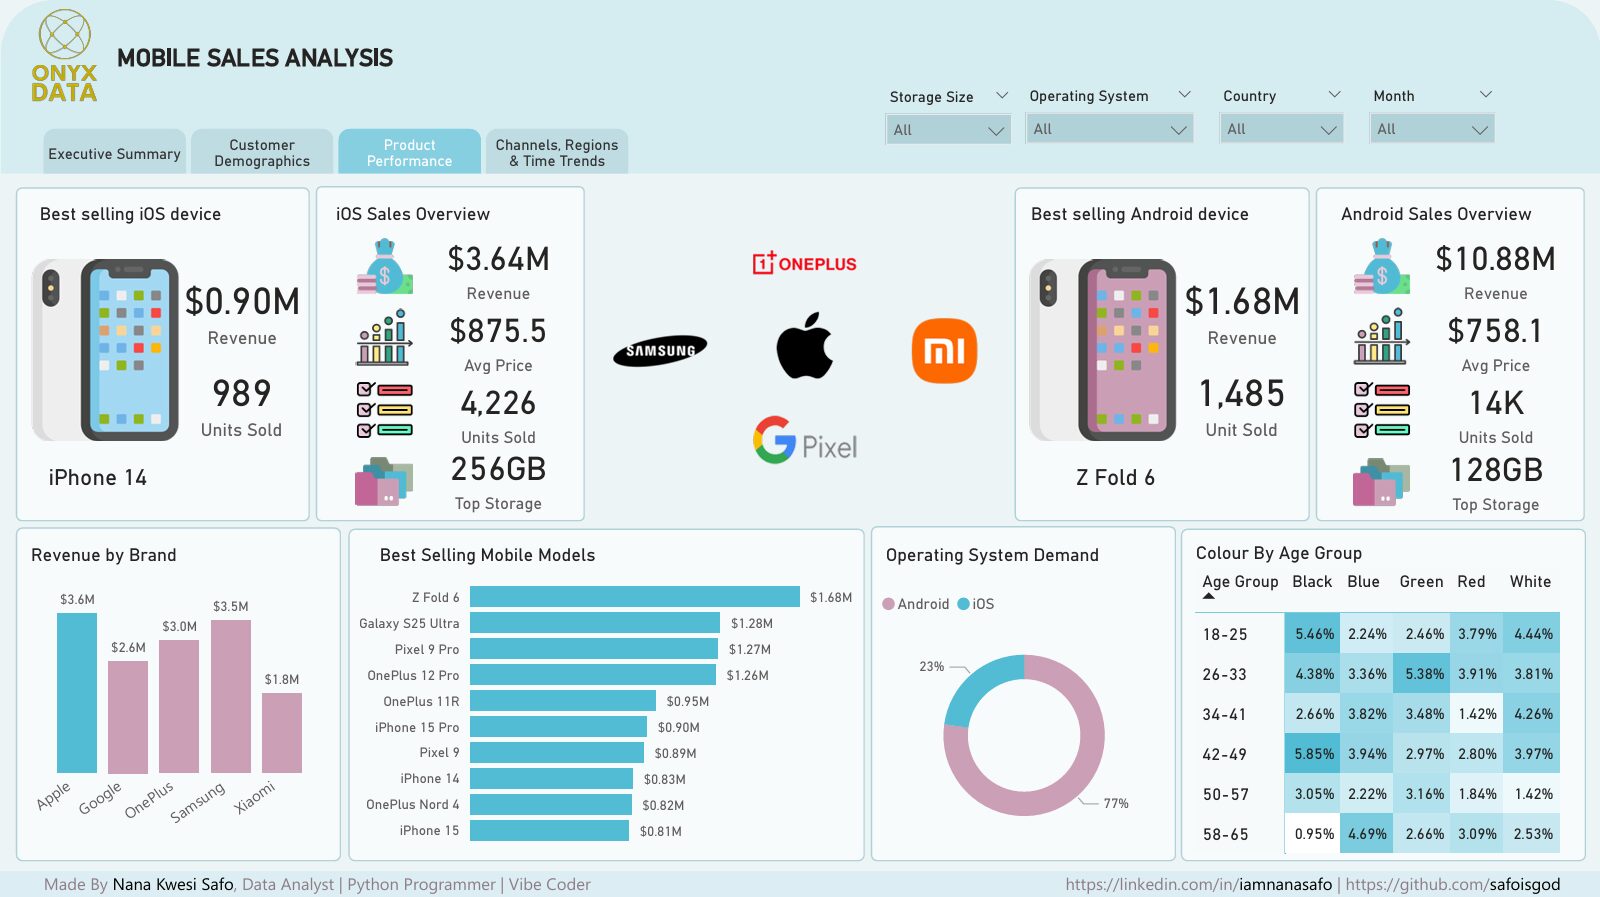
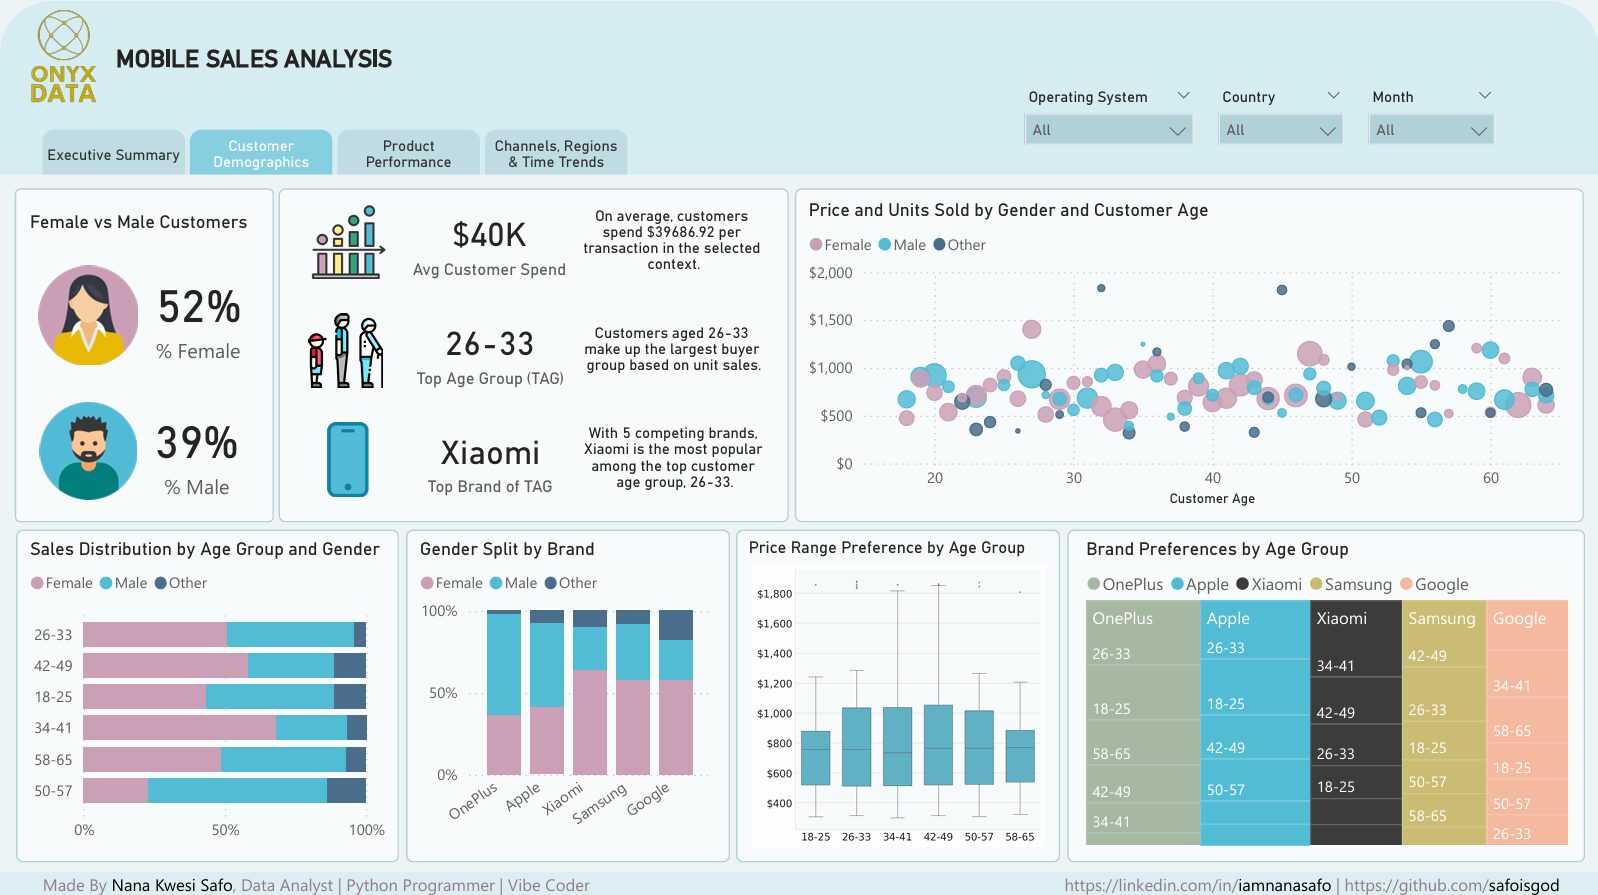
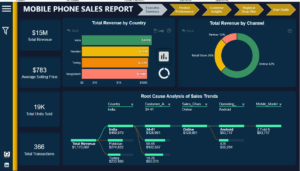
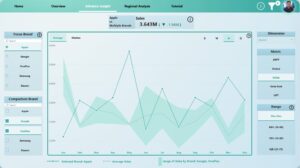
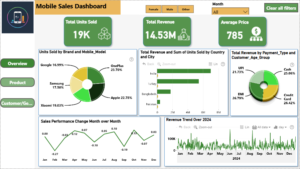
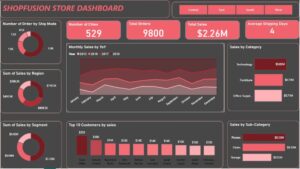
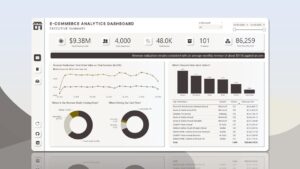
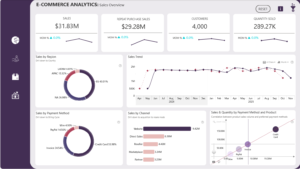
Mobile Sales Analysis Dashboard (Onyx Data May Challenge - Power BI) Created an interactive Power BI dashboard for the Onyx Data May Challenge, analyzing mobile sales data with $14.5M in revenue and 18.5K units sold. This multi-panel visualization, developed by Nana Kwesi Safo, features dynamic filters (Storage Size, Operating System, Country, Month) for in-depth exploration. Key Features: Executive Summary: Displays $14.5M revenue (+16% PM), 18.5K units (+3% PM), $785 average price, and 25 cities. Product Performance: Highlights best-sellers (iPhone 14 at $0.9M, OnePlus Z Fold 6 at $1.68M) and top brands (Apple $3.6M, Samsung $3.5M). Channel & Region: Breaks down sales by channel (Online 62.32%, Retail 25.63%) and top cities (Bursa $1.5M, Chennai $1.4M) on an interactive map. Trends: Tracks monthly performance and average product cost trends across Apple, Google, OnePlus, Samsung, and Xiaomi. Demographics: Offers insights into sales distribution by age, gender, and brand preferences. Impact: The dashboard enables stakeholders to identify high-performing products, optimize sales channels, and target key regions. Built with Power BI and DAX, it showcases advanced data visualization and analytical skills honed during the challenge. Technologies: Power BI, DAX
Contact our team

16 Upper Woburn Place, London, Greater London, WC1H 0AF, United Kingdom


 Nana Kwesi Safo
 Ekom-obong essien
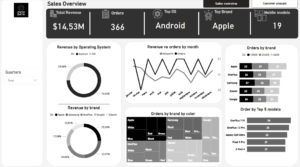

 Akindele Victor Omolayo