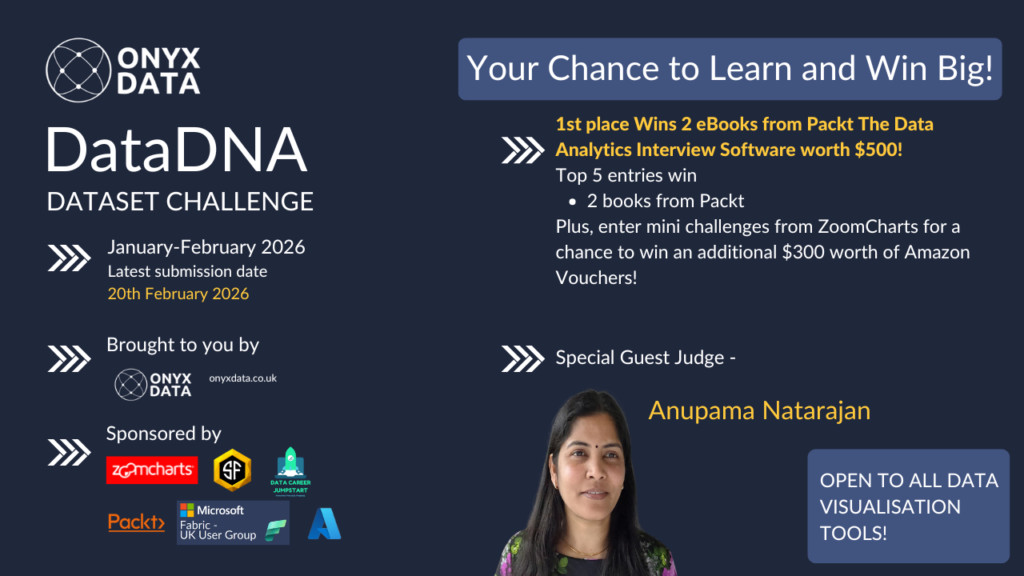
Welcome to the Data DNA - Dataset Challenge! This month we will be analysing the Pharmacy Sales & Profitability Analytics Challenge dataset
By entering your full name and email address, you are agreeing to our privacy policy and consent to such details being shared with the named sponsor or other third-party affiliates who may use your details for marketing purposes.
You can unsubscribe at any time from such marketing as set out in our privacy policy.
Prize Pool: 2 eBooks from Packt,The Data Analytics Interview Software worth $500!
Mini challenges from ZoomCharts for a chance to win an additional $300 worth of Amazon Vouchers!
Pharmacy chains operating across multiple countries face ongoing commercial and operational challenges, and this dataset highlights several critical areas:
Operational & Analytical Challenges
Fragmented visibility across countries and regions makes it difficult to understand true business performance.
Variations in sales and profitability between pharmacies obscure which locations are truly driving value.
Seasonal demand fluctuations complicate inventory planning, staffing, and promotional timing.
High-volume products with low margins reduce overall profitability and distort performance reporting.
Limited insight into the effectiveness of promotions makes it hard to justify discounting strategies.
Differences between urban, suburban, and rural pharmacy performance are often poorly understood.
Inconsistent product and brand performance across regions complicates assortment and pricing decisions.
Lack of clear drill-down from country to pharmacy level limits accountability and local optimisation.
Geographic patterns in sales and margin are not always visible, leading to missed regional opportunities.
Difficulty linking regional performance to overall results weakens strategic decision-making.
Your report should address these gaps by uncovering trends, drivers, and outliers that help pharmacy leaders improve profitability, optimise operations, and make more informed commercial decisions.
Step 3. In your post, share an image of your visualisation or dashboard (remember, it must be a single image).You can directly click on below button directly to share !
How to Enter ZoomCharts Mini Challenge for Power BI
Step 1: Register for ZoomCharts Mini Challenge here and receive a Drill Down Visuals Developer License for Power BI.
Step 2: Create a Power BI report including at least 2 ZoomCharts Drill Down Visuals in one report page!
Step 3:Submit your entry here to be verified.
(If your submission doesn’t match the challenge criteria, you will be notified by email, so make sure you have time for revision and resubmission if needed. Feel free to resubmit your entry as many times as necessary before the deadline.)
Business users use reports to make data-driven decisions. That’s why reports are called effective if they enable users to drill down and filter data quickly and intuitively to find answers to any question they might have and analyze data in all possible directions and dimensions.
We will evaluate:
1) How easy is it to understand the data? (Max 10 points)
Is too much text used for explanation?
Are the indicative colors in charts instinctually understandable?
Does it tell a story?
2) How easy-to-use is the report? (Max 14 points)
Cross-chart filtering implementation across the report. Can other visuals provide relevant data as the user explores the report?
Response time
Drill Down: Multi-layer data exploration. Can the user drill down and gain additional insights within the report?
Use of tutorial overlays and other elements to assist new users. Can a new user start using this report straight away with just the guidance provided within the report itself?
3) How good is the report design and is it suitable for its purpose? (Max 10 points)
Visual design: Is the overall look consistent, no empty spaces, no overcrowding?
Interface design: Are there unnecessary visualizations/buttons/complexity in use?
UX design: Is the produced report usable?
Report design: Is the main challenge answered?
Technical: Are all the fonts used the same, are the sizes readable?
You are encouraged to use various techniques at your disposal, such as tooltips, drill-throughs, drill-downs, cross-chart filtering, and page navigation features, to enhance your analysis.
Resources
Here are some useful links to learn more about ZoomCharts and get inspiration for your report:
Use-Case Gallery: Try live demos and download reports made by the ZoomCharts team.
Video Tutorials: Watch engaging video guides on how to set up and use the visuals.
Documentation: Technical deep-dive about ZoomCharts visuals.
ZoomCharts Blog: Useful tips & tricks for data visualization and report creation.
Visuals Gallery: Explore all the possible customization options for Drill Down Visuals.
Upcoming Webinar
No upcoming webinars available.
Past Webinar
Top 5 Pharmacy Sales & Profitability Reports: Power BI Best Practices Review
In this challenge, you will analyze a dataset representing a European pharmacy chain distributor operating across multiple European countries. The dataset includes daily sales transactions by pharmacy and product, with supporting dimensions for time, geography, and product hierarchy.
December 2025 DataDNA – Animal Shelter Operations Challenge Winner
December 2025
In this challenge, you will analyze the Animal Shelter Intakes and Outcomes dataset from the City of Long Beach Animal Care Services. The dataset includes detailed information about each animal entering or leaving the shelter, such as species, intake type, condition, outcome type, and length of stay.
November 2025 DataDNA – E‑commerce Analytics Challenge Winner
November 2025
E-commerce Analytics Challenge
Step into the role of a data analyst at a global software retailer that sells analytics, design, collaboration, and AI subscriptions. Your mission is to uncover what drives customer loyalty and identify which channels and campaigns lead to repeat purchases.
– Share a LinkedIn post with your visualization image and tag @OnyxData,@SmartFramesUI, @DataCareerJumpstart and @packt with #dataDNA.
– Share an image of your visualization or dashboard (single image only).
– Complete the entry form listed.
Only one entry is accepted for the challenge. After your first entry, no further entries will be accepted.
The challenge is open to all BI and data visualization tools.