
Join a community of the most creative Business Intelligence Professionals
Join a community of the most creative Business Intelligence Professionals
Find data professionals with skills verified through real challenge performance.
Browse Talent DirectoryCreate realistic synthetic data for training, testing, and demonstrations.
Explore Dataset Generator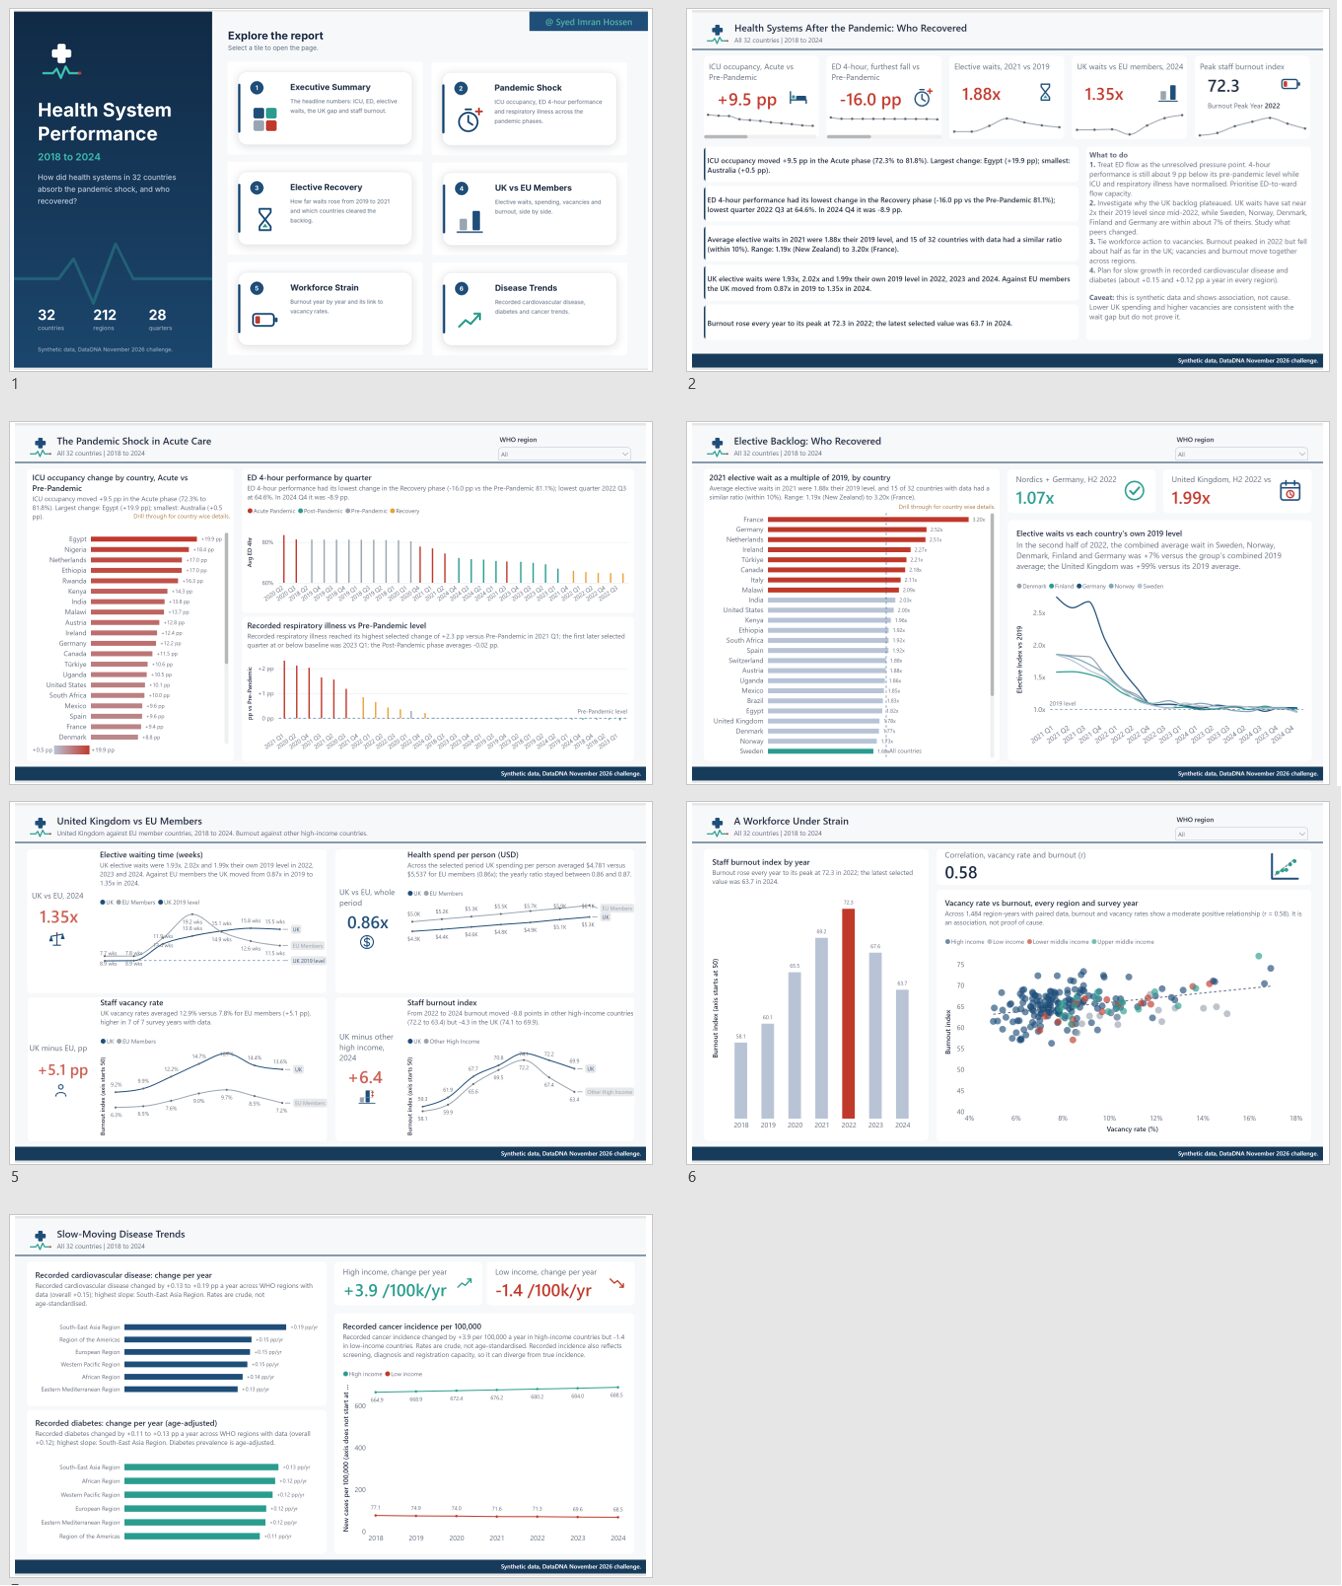
📊 For this month’s #dataDNA challenge, I analysed how health systems across 32 countries absorbed the pandemic shock between 2018 and 2024. The biggest takeaway? The real story isn't the peak. It's the uneven recovery. 🔍 What the data revealed: 🏥 ICU Occupancy Increased by 9.5 percentage points during the acute phase before stabilising. 🚑 Emergency Department Performance ED 4-hour performance dropped by 16 percentage points at its lowest. Still approximately 9 points below its pre-pandemic level. ⏳ Elective Waiting Times Increased 1.88x between 2019 and 2021. Country-level variation ranged from 1.19x to 3.20x. Only 15 of the 32 countries experienced a similar level of change. 🇬🇧 The UK: A Growing Pressure Point Moved from 13% below the EU average in elective waits (2019) to 35% above it (2024). Spends approximately 14% less per person. Has around 5 percentage points more workforce vacancies. 🔥 Workforce Burnout Increased every year, reaching a peak of 72.3 in 2022. Since then, burnout declined by 8.8 points in other high-income countries, compared with just 4.3 points in the UK.

 Nneamaka Obiazor
0

 Nayan Dholakia
2

 Salam Kling
0

 Kingsley Uten
0
 Get In Touch
Contact our team

16 Upper Woburn Place, London, Greater London, WC1H 0AF, United Kingdom





 Nina Ikpe
 Liza Deka
 Agbata Dickson Ukolojo
 Amit Bahedia