
Join a community of the most creative Business Intelligence Professionals
Join a community of the most creative Business Intelligence Professionals
Find data professionals with skills verified through real challenge performance.
Browse Talent DirectoryCreate realistic synthetic data for training, testing, and demonstrations.
Explore Dataset Generator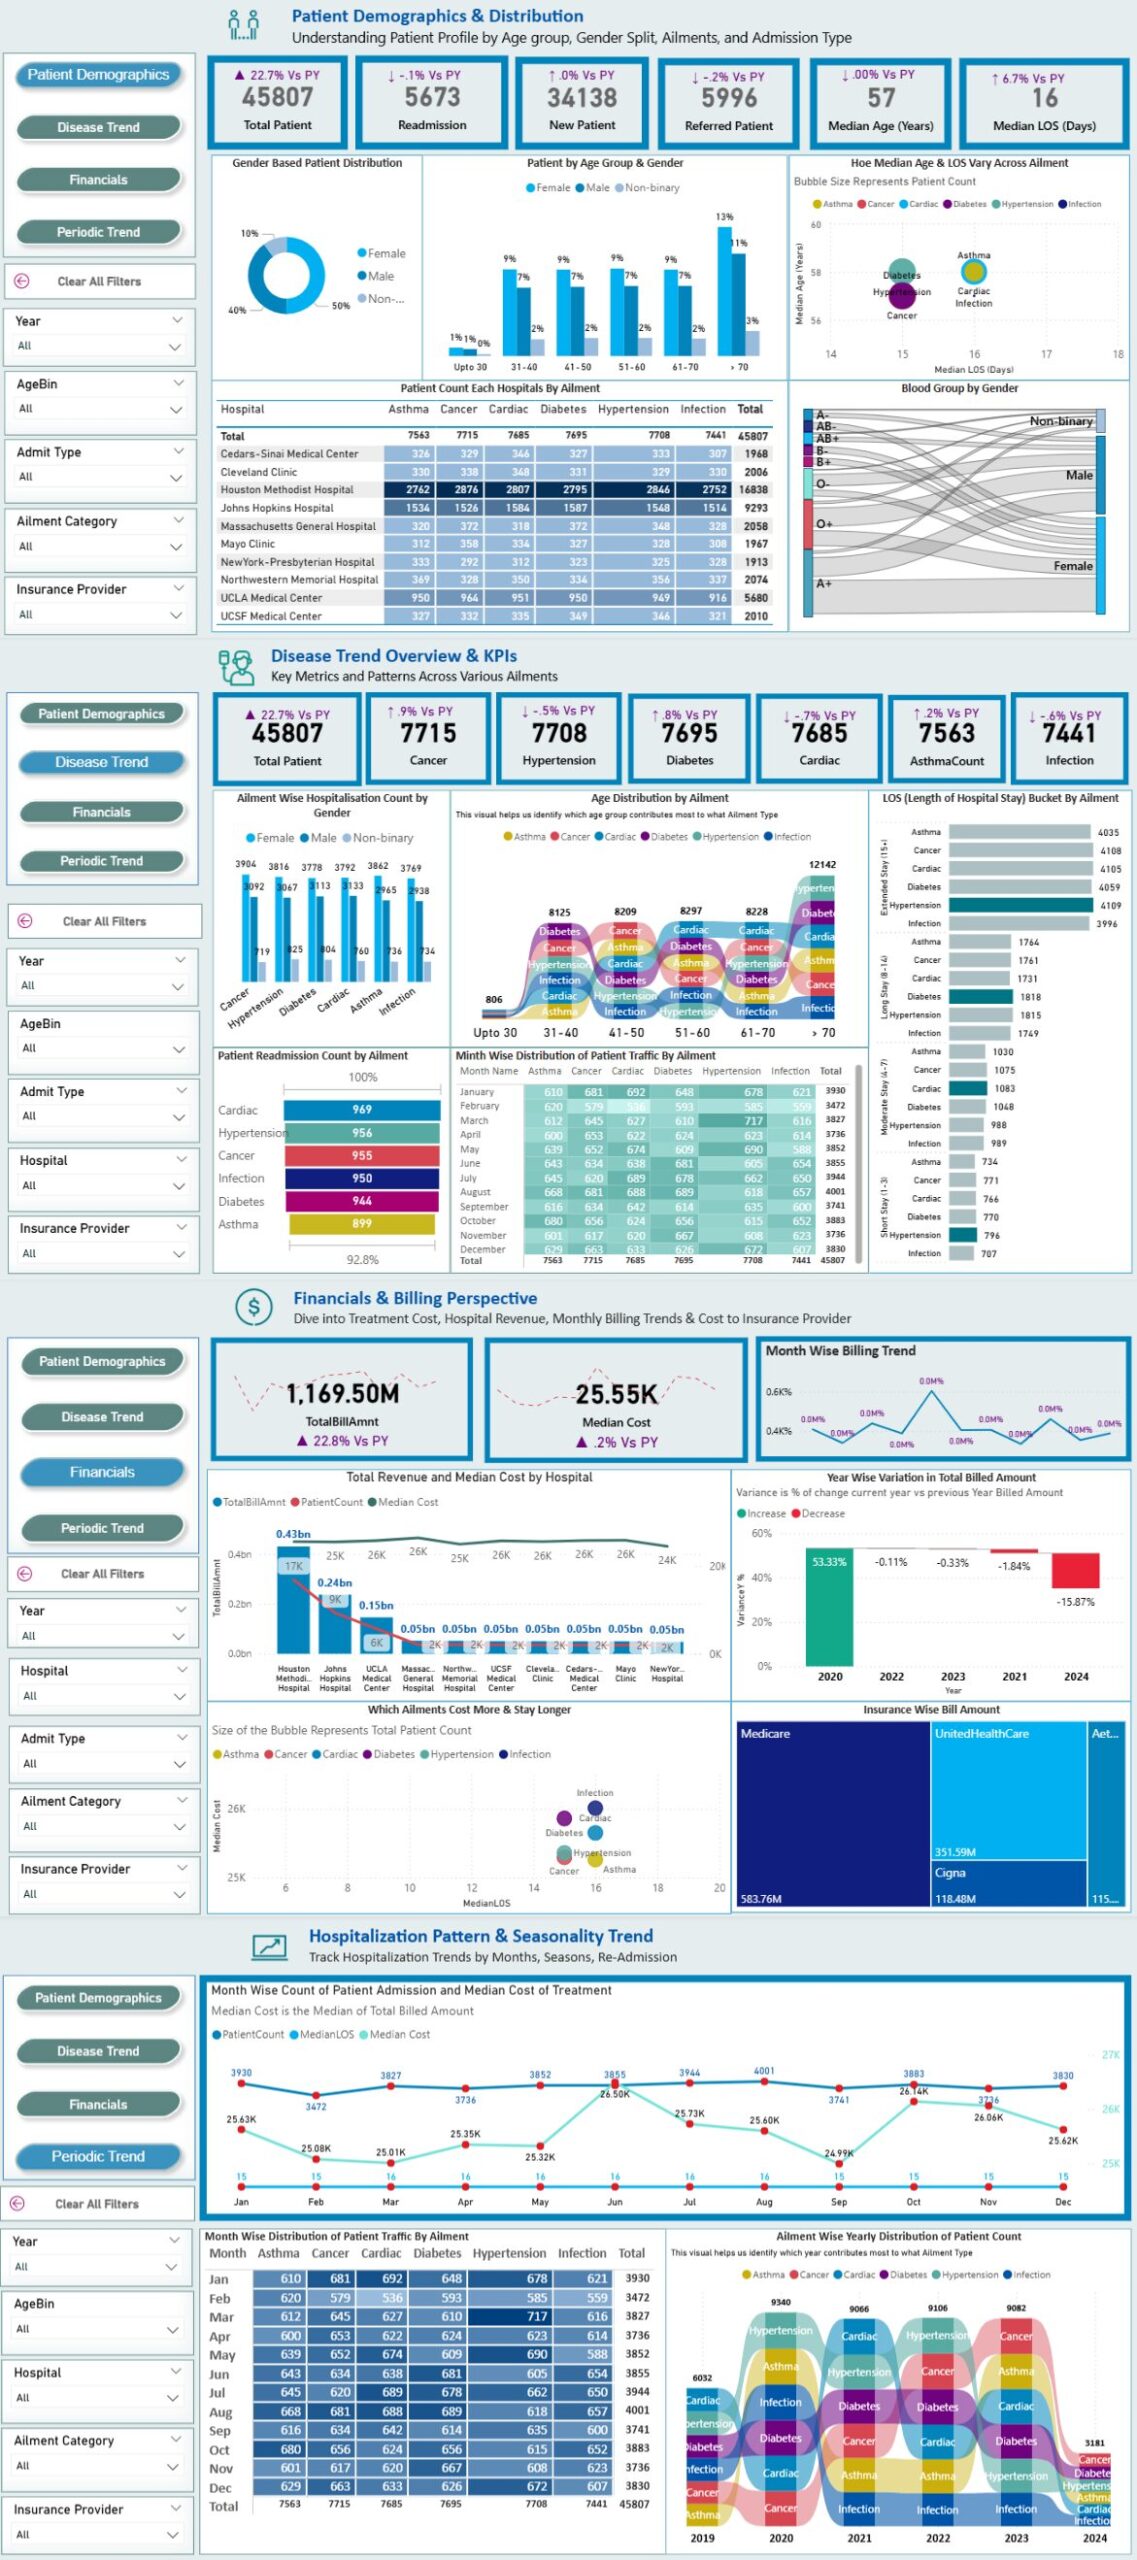
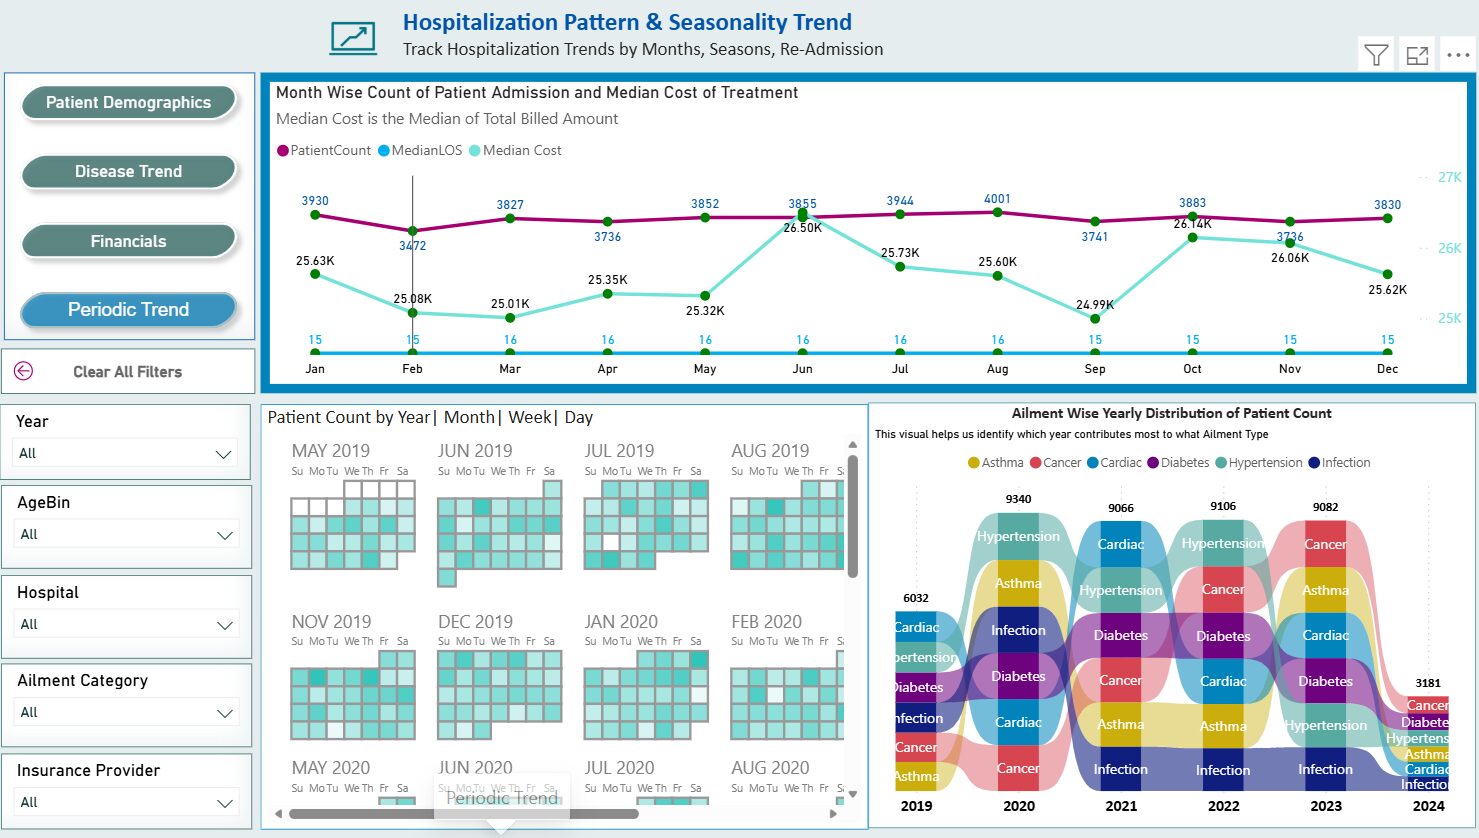
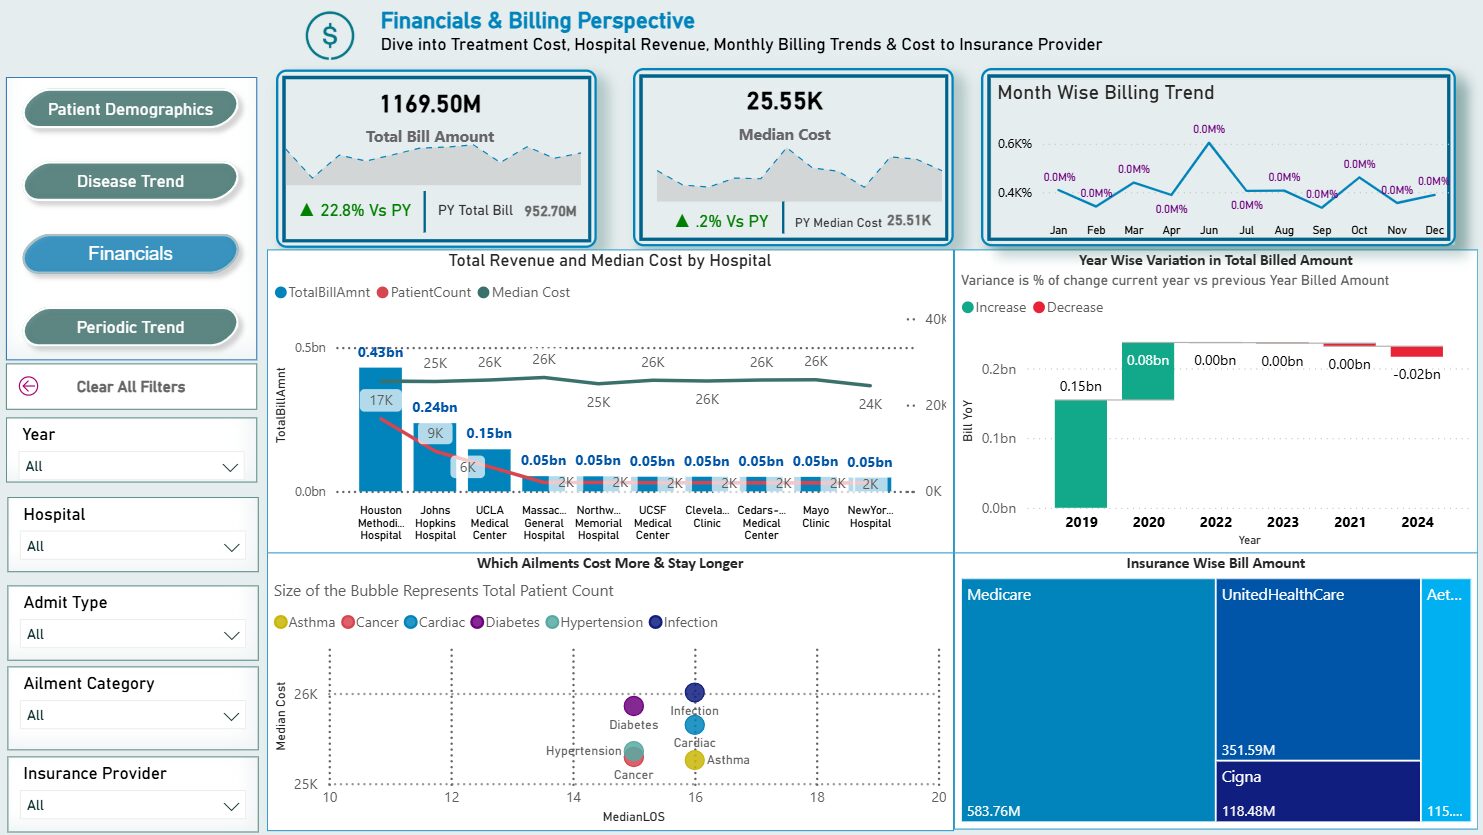
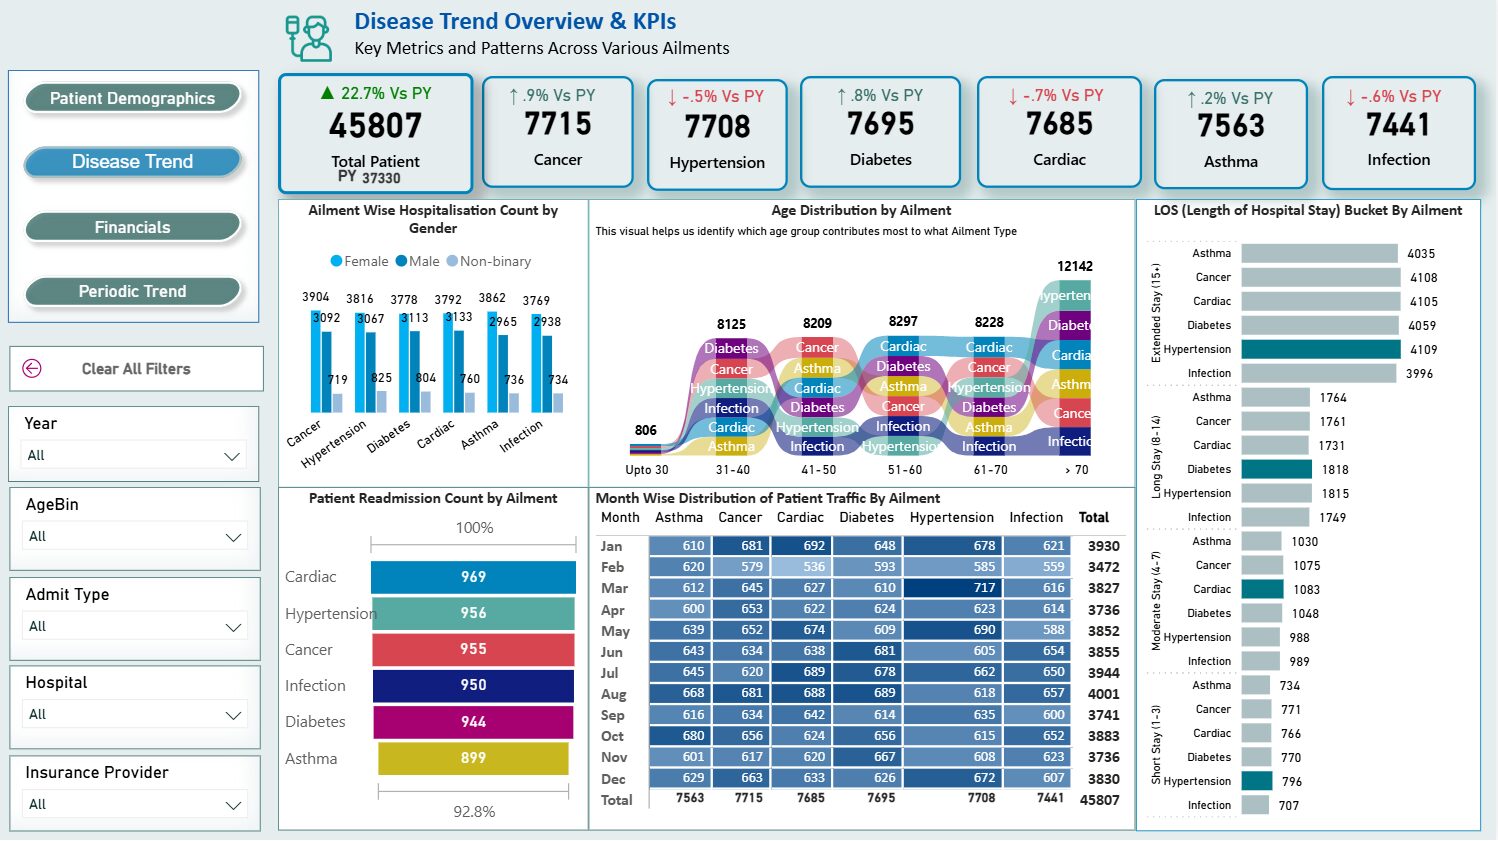
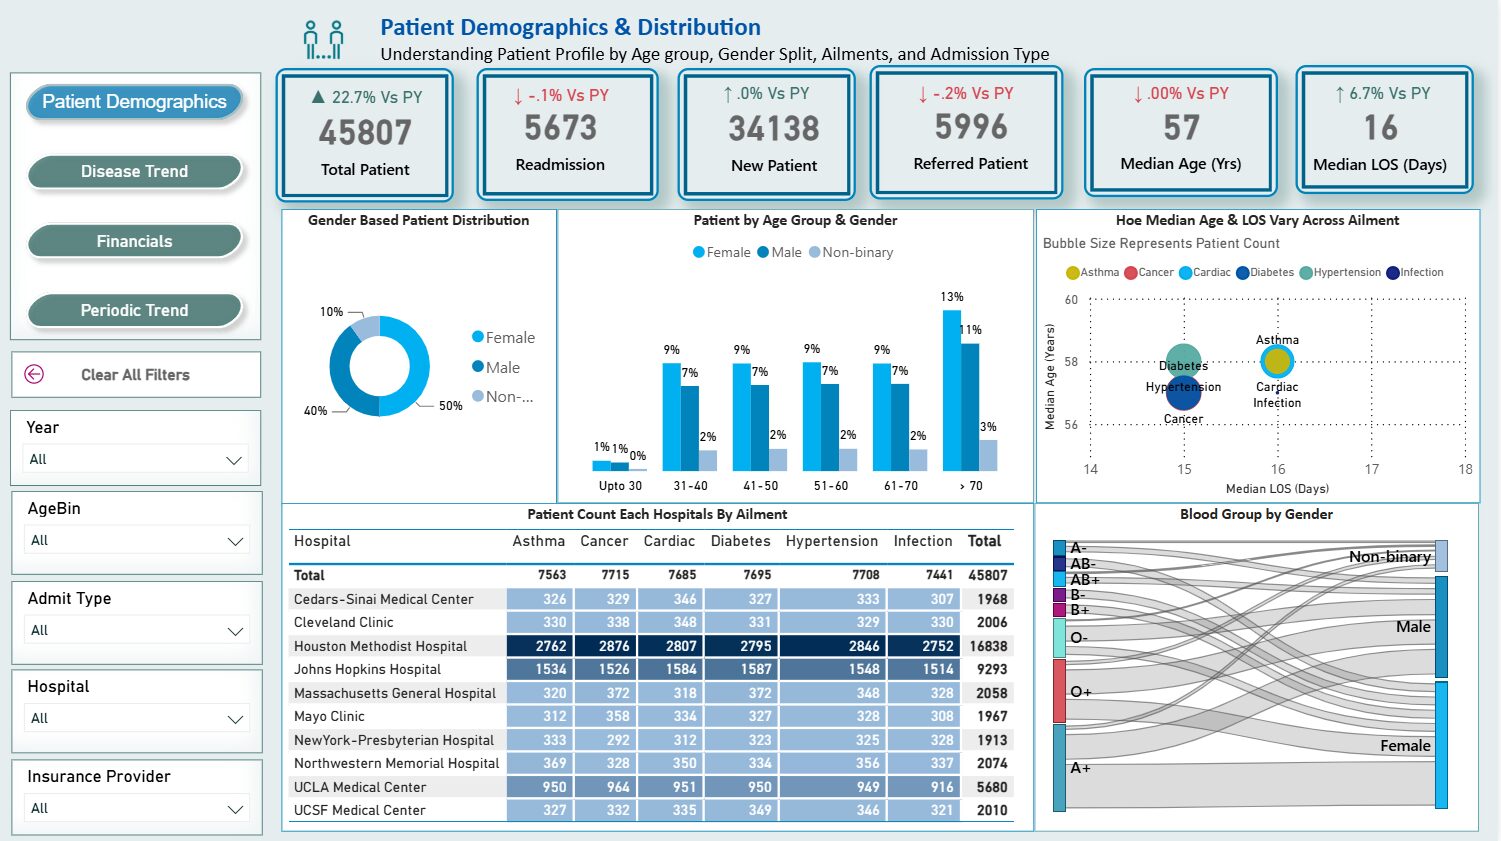
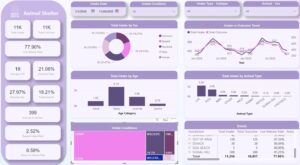
ANALYSIS DESCRIPTION • As a data analyst, I conducted a comprehensive analysis of 6 years of patient data (2019–2024) by top ailment (Cancer, Asthma, Cardiac, Hypertension, Infection, Diabetes) across hospitals, identifying trends in prevalence, growth rates, and hospital specialization. • Built patient profiles by age group, gender, blood group, and median age, uncovering demographic-driven disease patterns (e.g., ‘How Median Age and Length of Hospital Stay (LOS) vary across six ailments. Further analysed ailment patterns by age group to find disease prevalence by age. (Ex. Higher cases of ‘hypertension’ amongst patients 50-70 age group, higher ‘diabetes’ in younger age group 31-40 ). • Evaluated insurance utilization, identifying the top insurers by patient volume and billing coverage, and compared claim trends across hospitals. • Performed cost and billing analysis, including total billing trends, median treatment costs, and differences between hospitals and ailments. • Conducted hospital performance benchmarking, highlighting which hospitals contributed most to total patient volume, billing, and high-cost care cases. • Applied time-series analysis to uncover year-on-year and seasonal hospitalization trends, aiding in resource planning and preventive care initiatives. KEY QUESTIONS ADRESSED THROUGH THE ANALYSIS o Which ailments and hospitals report the highest number of patients overall and in specific regions? o How do patient volumes and costs vary by ailment, age group, gender, or insurance provider? o What is the typical patient profile — median age, gender split — for each ailment (Cancer, Asthma, Cardiac, Hypertension, Infection, Diabetes)? o How do billing and insurance claims break down across hospitals, insurers, and payment types (cashless vs. reimbursement)? o Are there noticeable differences in median treatment cost and Length of Stay (LOS) between hospitals or regions? o Which hospitals or regions generate the highest total billing and patient volumes? o Are there patterns in demographics (e.g., certain age groups or genders more prone to specific ailments)? o How have patient numbers and hospitalization costs changed year-on-year (2019–2024)? o Are there correlations between patient demographics and ailment prevalence (for example, hypertension more common in 40–55 age group, infections more in younger patients)?
 Get In Touch
Contact our team

16 Upper Woburn Place, London, Greater London, WC1H 0AF, United Kingdom




 Peter N
 Ankan Bandyopadhyay
 Dhia Salsabila Azhar
 Eamon McAllister