
Join a community of the most creative Business Intelligence Professionals
Join a community of the most creative Business Intelligence Professionals
Find data professionals with skills verified through real challenge performance.
Browse Talent DirectoryCreate realistic synthetic data for training, testing, and demonstrations.
Explore Dataset Generator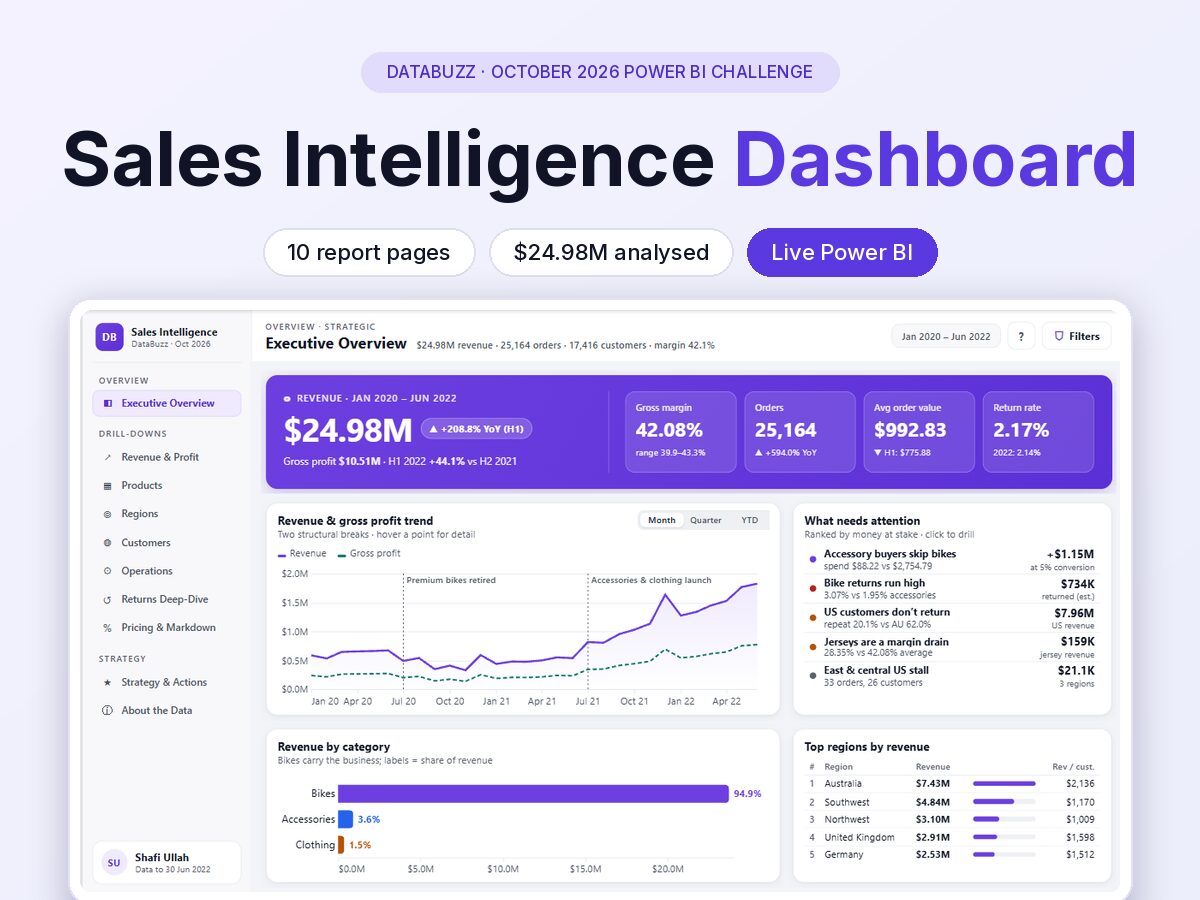
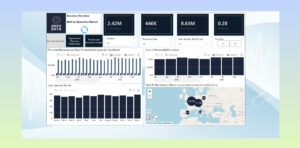
A 10-page Power BI report (plus 5 tooltip pages) built for the DataBuzz October 2026 Power BI Challenge. It answers three questions: what's happening across the business, why, and where to steer next. It covers 56,046 order lines, 25,164 orders and 17,416 customers (Jan 2020 – Jun 2022): $24.98M revenue at a 42.1% gross margin. Data loads live from GitHub through the Web connector, and every change happens in Power Query (no hand edits) on a clean star schema. Pages: Executive Overview, Revenue & Profit, Products, Regions, Customers, Operations, Returns Deep-Dive, Pricing & Markdown, Strategy & Actions (with a what-if), and About the Data. Key findings: H1 2022 revenue is up 184.7% year on year like-for-like, bikes bring in 94.9% of revenue, and Mountain-200 alone is 28.8% of sales.
 Get In Touch
Contact our team

16 Upper Woburn Place, London, Greater London, WC1H 0AF, United Kingdom




 Naved Khan
 Rukayat Awolola

 Waqas Hameed
 Gyanankur Baruah