
Join a community of the most creative Business Intelligence Professionals
Join a community of the most creative Business Intelligence Professionals
Find data professionals with skills verified through real challenge performance.
Browse Talent DirectoryCreate realistic synthetic data for training, testing, and demonstrations.
Explore Dataset Generator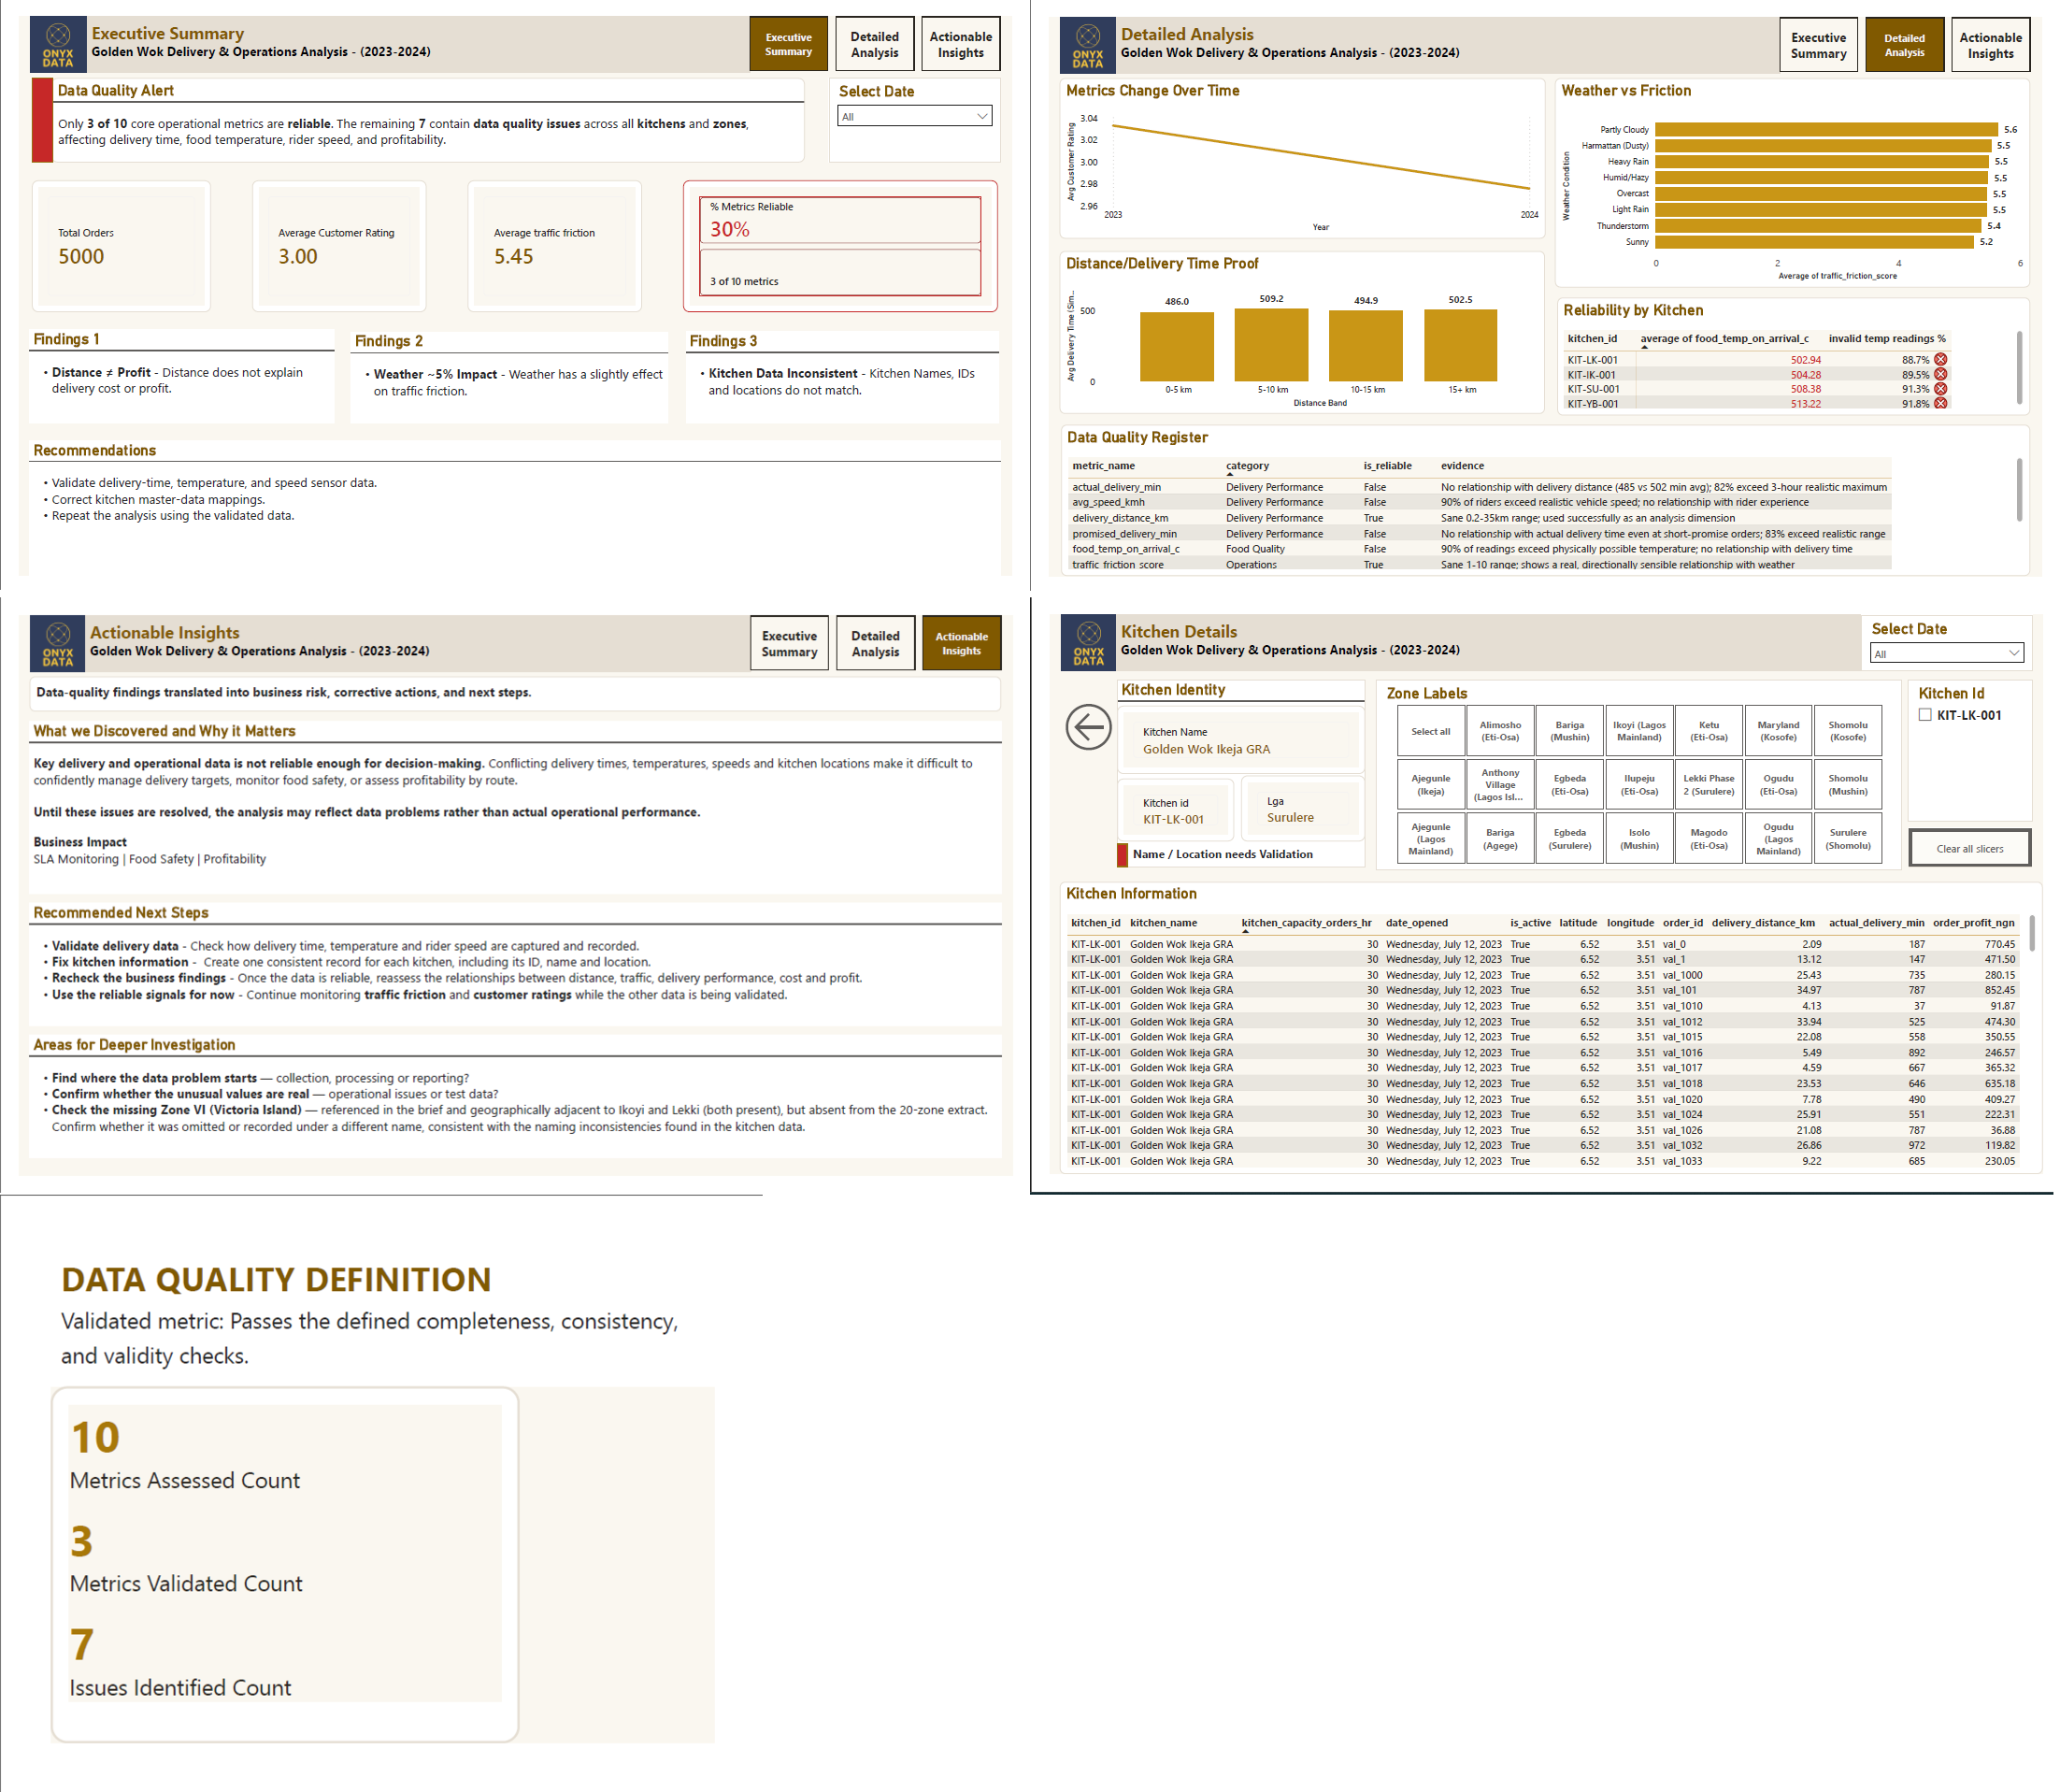
## Golden Wok | Delivery Performance & Data Quality Analytics For the **Onyx Data DataDNA Challenge**, I analysed delivery performance, traffic conditions, and profitability for a fictional food-delivery network, Golden Wok, covering 2023–2024. Rather than immediately building visuals, I first checked whether the key numbers made sense and could be trusted. This validation became the main focus of the project and shaped the final Power BI report. ### Approach * Explored and prepared the dataset, including its tables, kitchens, zones, and key metrics. * Validated the main metrics by comparing related fields and investigating unusual patterns. * Tested the challenge brief's suggested findings against the actual data. * Documented the data-quality issues and identified the metrics suitable for analysis. * Built an interactive Power BI report with filters, KPIs, drill-throughs, and supporting visuals. ### Tools - Power BI Desktop — analysis, modelling, and dashboard development - Power Query — data cleaning and preparation - DAX — calculations and KPIs - Power BI custom theme — report design ### Key Insights * Only **3 of 10 core metrics** appeared reliable: customer rating, delivery distance, and traffic friction. * Several metrics showed unusual patterns, with **82–90% of records affected**. * The suggested explanation for unusually high delivery times was **not supported by the data**. * Several claims in the challenge brief were also **not supported**, including negative profit beyond 8 km. * **Kitchen IDs, names, and locations were inconsistent**, affecting kitchen-level analysis. * Traffic friction was around **5% higher during heavy rain** than sunny conditions. ### Key Takeaway **Good analysis starts with checking the data, not just visualising it.** Validating the dataset first helped separate reliable insights from misleading patterns and shaped the final report.
 Get In Touch
Contact our team

16 Upper Woburn Place, London, Greater London, WC1H 0AF, United Kingdom





 Ankan Bandyopadhyay
 SYED IMRAN HOSSEN
 Shafi Ullah
 Nina Ikpe