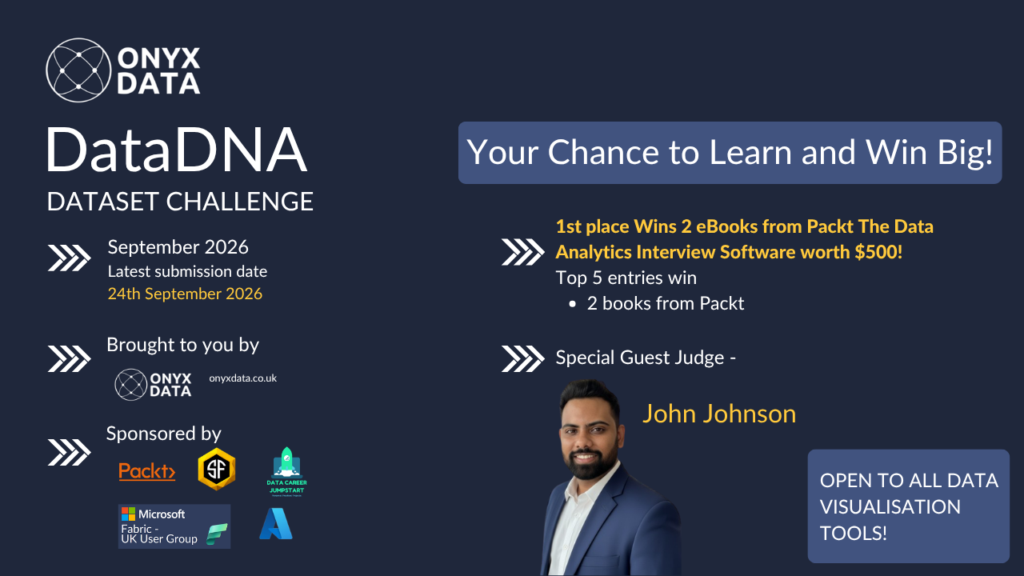
September 2026 DataDNA – Golden Wok Food Delivery Analytics Challenge

September 2026 DataDNA – Golden Wok Food Delivery Analytics Challenge

Submission Deadline

0 Days : 0 Hours : 0 Minutes : 0 Seconds
Join DataDNA Community

Download the DataDNA dataset

Welcome to the Data DNA - Dataset Challenge! This month we will be analysing the Golden Wok Food Delivery Analytics Challenge Dataset

By entering your full name and email address, you are agreeing to our privacy policy and consent to such details being shared with the named sponsor or other third-party affiliates who may use your details for marketing purposes.
You can unsubscribe at any time from such marketing as set out in our privacy policy.

Why Participate?

AI-Powered Feedback

Every submission receives detailed scores across four dimensions: Storytelling, Design, Technical, and Insights. Know exactly where you excel and where to improve.

Build Your Portfolio

Your best work becomes part of a verified portfolio that shows potential employers your actual skill levels, not just claims on a CV.

Earn Your Tier

Progress from Beginner to Intermediate to Advanced as you complete more challenges. Your tier reflects your demonstrated data visualisation skills.

How We Score Your Work

Our AI reviewer evaluates every submission across four dimensions:

1-5

Storytelling

Does your visualisation tell a clear, compelling story? We look for logical flow, context, and narrative progression that guides the viewer through your insights.

1-5

Design

Is your dashboard clean, readable, and visually appealing? We evaluate layout, typography, colour choices, and visual hierarchy.

1-5

Technical

Does your work demonstrate strong technical skills? We assess DAX usage, data modelling, chart type selection, and interactivity implementation.

1-5

Insights

Do you provide meaningful analysis? We look for non-obvious discoveries, actionable recommendations, and demonstrated business impact.

A score of 3 represents solid, competent work. Scores of 4-5 require exceptional evidence in that dimension.

What Happens After You Submit?

1

AI Review

Within 15-30 minutes, our AI reviewer analyses your submission and generates personalised feedback across all four scoring dimensions.

2

Email Feedback

If you opted into feedback emails, you'll receive your scores, strengths, areas for improvement, and a pro tip to help you level up.

3

Portfolio Draft

If you selected portfolio creation, a draft entry is added to your profile. Review it, refine your description, then publish when you're ready.

21 Days Remaining
Prize Pool: 2 eBooks from Packt,The Data Analytics Interview Software worth $500!

Operational & Analytical Challenges

Urban food-delivery operations face growing pressure to balance delivery speed, customer experience, traffic conditions, and order profitability, and this dataset highlights several critical operational and analytical challenges:

  • Fragmented visibility across orders, kitchens, delivery zones, traffic conditions, weather, and customer outcomes makes it difficult to understand overall delivery performance and operational efficiency.
  • Delivery performance varies significantly by time of day, with rush-hour orders to outer-ring zones experiencing severe delays and SLA breaches, making peak-period capacity and routing difficult to manage.
  • Weather conditions can materially increase traffic friction and delivery times, making it challenging to predict and manage service disruptions during Rain and Heavy Rain periods.
  • Long-distance deliveries create structural profitability pressure, with orders exceeding 8 km generating negative profitability as delivery costs increase faster than order revenue.
  • Food quality deteriorates as delivery times increase, with longer deliveries associated with lower food temperatures and significantly poorer customer ratings.
  • Profitability varies considerably across delivery corridors and zones, making it difficult to identify which kitchen-to-zone combinations consistently create financial losses.
  • Traffic congestion across major urban routes can compound both delivery delays and delivery costs, creating operational inefficiencies that are difficult to isolate without corridor-level analysis.
  • High order volumes do not always translate into healthy business performance, as delays, excessive delivery costs, SLA breaches, and poor customer experiences can erode order profitability.
  • Limited visibility into the relationship between delivery distance, traffic friction, weather, delivery time, food temperature, and customer ratings weakens operational and service-level decision-making.
  • Cross-dimensional interactions (e.g., kitchen × zone × time period × weather × traffic conditions) are complex and often under-analysed, hiding high-risk delivery corridors and optimisation opportunities.
  • Seasonal, daily, and rush-hour variations in delivery demand and traffic conditions create uneven operational performance that is difficult to manage without structured temporal analysis.
  • Difficulty connecting delivery performance to order profitability, customer satisfaction, and operational costs limits strategic decisions around pricing, routing, kitchen allocation, delivery zones, and SLA management.

What happens after you submit

Instant confirmation

You'll receive a confirmation email immediately with links to your portfolio entry and profile.

AI feedback within 30 minutes

Your work is scored across storytelling, design, technical depth, and insights. Detailed feedback arrives by email.

Scores on your portfolio

A draft portfolio entry is created automatically. Once you publish it, your AI scores appear on your public profile and the portfolio gallery.

Certificates for winners

Certificates are emailed to winners after the challenge closes and results are finalised.

Please note: Resubmissions are not permitted, to ensure fairness for all participants.

How to submit your entry

  • Step 1. Follow Onyx Data on LinkedIn (it’s Ok if you already follow Onyx Data).
  • Step 2. Share a LinkedIn post on your profile with your visualisation image and tag directly using @ mention to:
    @OnyxData @SmartFramesUI @DataCareerJumpstart
    and use the hashtag #dataDNA.
  • Step 3. In your post, share an image of your visualisation or dashboard (remember, it must be a single image).You can directly click on below button directly to share !


DataDNA Challenge Submission Form

Fill out the form to participate

Requires a portfolio on DataDNA so we can view your work
PNG, JPG or WebP, maximum 10 MB. Required for all entries — shown on your portfolio card, to the AI reviewer and to judges.

Judging Criteria for Power BI Reports

Business users use reports to make data-driven decisions. That’s why reports are called effective if they enable users to drill down and filter data quickly and intuitively to find answers to any question they might have and analyze data in all possible directions and dimensions.

We will evaluate:

1) How easy is it to understand the data? (Max 10 points)

  • Is too much text used for explanation?
  • Are the indicative colors in charts instinctually understandable?
  • Does it tell a story?

2) How easy-to-use is the report? (Max 14 points)

  • Cross-chart filtering implementation across the report. Can other visuals provide relevant data as the user explores the report?
  • Response time
  • Drill Down: Multi-layer data exploration. Can the user drill down and gain additional insights within the report?
  • Use of tutorial overlays and other elements to assist new users. Can a new user start using this report straight away with just the guidance provided within the report itself?

3) How good is the report design and is it suitable for its purpose? (Max 10 points)

  • Visual design: Is the overall look consistent, no empty spaces, no overcrowding?
  • Interface design: Are there unnecessary visualizations/buttons/complexity in use?
  • UX design: Is the produced report usable?
  • Report design: Is the main challenge answered?
  • Technical: Are all the fonts used the same, are the sizes readable?

You are encouraged to use various techniques at your disposal, such as tooltips, drill-throughs, drill-downs, cross-chart filtering, and page navigation features, to enhance your analysis.


Upcoming Webinar

No upcoming webinars available.

Past Webinar

Top 5 Pharmacy Sales & Profitability Reports: Power BI Best Practices Review

Top 5 Pharmacy Sales & Profitability Reports: Power BI Best Practices Review

📅 27/02/2026 ⏰ 8:00 pm
Learn more

Timeline

01 September 2026
Challenge Begins

Challenge begins and entries accepted

24 September 2026
Deadline for all entries to be submitted

No form submitted after the deadline

25 September 2026
Entry Review and Winner Selection b

Review and selection will be done between 25-30 September

30 September 2026
Winners Announcement

Winner will be announced and notified

Explore Past Challenges

August 2026 DataDNA – African Gig-Economy and Digital Wallet Analytics Challenge

August 2026

In this challenge, you will analyze an operational fintech dataset tracking digital wallet transactions, fraud exposure, dispute activity, and gig-economy behaviour across multiple African markets. The data spans transactions and wallet events between 2023 and 2024, covering payment activity, fraud and reversal events, account lifecycle, and supporting dimensions including users, gig worker segments, channels, countries, and transaction types. Your objective is to uncover the key drivers of fraud and operational risk, identify customer segments and channels most vulnerable to financial losses, evaluate transaction behaviour across markets, and highlight where fintech providers should prioritise fraud prevention, operational improvements, and risk mitigation to build a safer, more resilient digital payments ecosystem through data-driven decision-making.

View Details

July 2026 DataDNA – Global AI Adoption Workforce Displacement Index Analytics Challenge

July 2026

In this challenge, you will analyze a global labour market dataset tracking AI adoption, workforce displacement, job creation, and reskilling investment across countries, industries, and skill categories. The data spans quarterly workforce trends between 2021 and 2024, covering AI adoption rates, displacement risk, employment shifts, reskilling expenditure, and supporting dimensions including countries, industries, skill categories, and time. Your objective is to uncover how artificial intelligence is reshaping the global workforce, identify industries and skills most vulnerable to AI-driven disruption, evaluate whether reskilling investment is keeping pace with workforce displacement, and highlight where governments and policymakers should prioritise intervention to build a more resilient future workforce through data-driven decision making.

View Details

June 2026 DataDNA – UK Fintech Neobank Digital Transaction Health Monitor Analytics Challenge

June 2026

In this challenge, you will analyze a transactional dataset from a UK-based fintech neobank tracking customer activity, transaction performance, fraud exposure, and fee revenue across digital banking channels. The data spans individual transactions, customer profiles, transaction types, merchant categories, and supporting dimensions including regions, devices, channels, and KYC status. Your objective is to uncover revenue opportunities, identify fraud and operational risks, and detect customer behaviour patterns — helping Risk, Finance, Product, and Compliance teams improve transaction success rates, reduce revenue leakage, strengthen fraud controls, and enhance the overall customer experience through data-driven decisions.

View Details

May 2026 DataDNA – Music Streaming Platform Performance Analytics Challenge

May 2026

In this challenge, you will analyze an operational dataset from a mid-sized music streaming platform tracking user behaviour, content performance, and subscription activity across multiple markets. The data spans listening sessions, subscription lifecycle events, and supporting dimensions including users, artists, tracks, genres, devices, and geography. Your objective is to uncover growth opportunities, identify churn risks, and detect behavioural patterns — helping leadership increase retention, optimise revenue streams, and improve user engagement through data-driven decisions.

View Details

March-April 2026 DataDNA – International Maritime Logistics & Terminal Efficiency Analytics Challenge

April 2026

In this challenge, you will analyze an operational dataset from a global maritime logistics company managing cargo movements across international terminals. The data includes cargo transactions by terminal and vessel, with supporting dimensions for time, regional hub (EMEA, APAC, AMER), vessel category, and operations. Your objective is to identify the impact of the 2021 Suez disruption, uncover infrastructure bottlenecks, and detect efficiency anomalies — helping leadership reduce cargo movement times by 15% through data-driven terminal optimization.

View Details

January-February 2026 DataDNA – Pharmacy Sales & Profitability Analytics Challenge

February 2026

In this challenge, you will analyze a dataset representing a European pharmacy chain distributor operating across multiple European countries. The dataset includes daily sales transactions by pharmacy and product, with supporting dimensions for time, geography, and product hierarchy.

View Details

Become a Sponsor

FAQ

– Follow Onyx Data on LinkedIn.

– Share a LinkedIn post with your visualization image and tag @OnyxData, @SmartFramesUI, @DataCareerJumpstart and @packt with #dataDNA.
– Share an image of your visualization or dashboard (single image only).
– Complete the entry form listed.

Only one entry is accepted for the challenge. After your first entry, no further entries will be accepted.

The challenge is open to all BI and data visualization tools.

Get In Touch

Contact our team

    name

    email

    number

    Pre-estimated budget

    Message

    locations

    Office Address

    16 Upper Woburn Place, London, Greater London, WC1H 0AF, United Kingdom

    call

    Telephone number

    +44 204 534 7858
    Loader