Join a community of the most creative Business Intelligence Professionals
Join a community of the most creative Business Intelligence Professionals
Find data professionals with skills verified through real challenge performance.
Browse Talent DirectoryCreate realistic synthetic data for training, testing, and demonstrations.
Explore Dataset Generator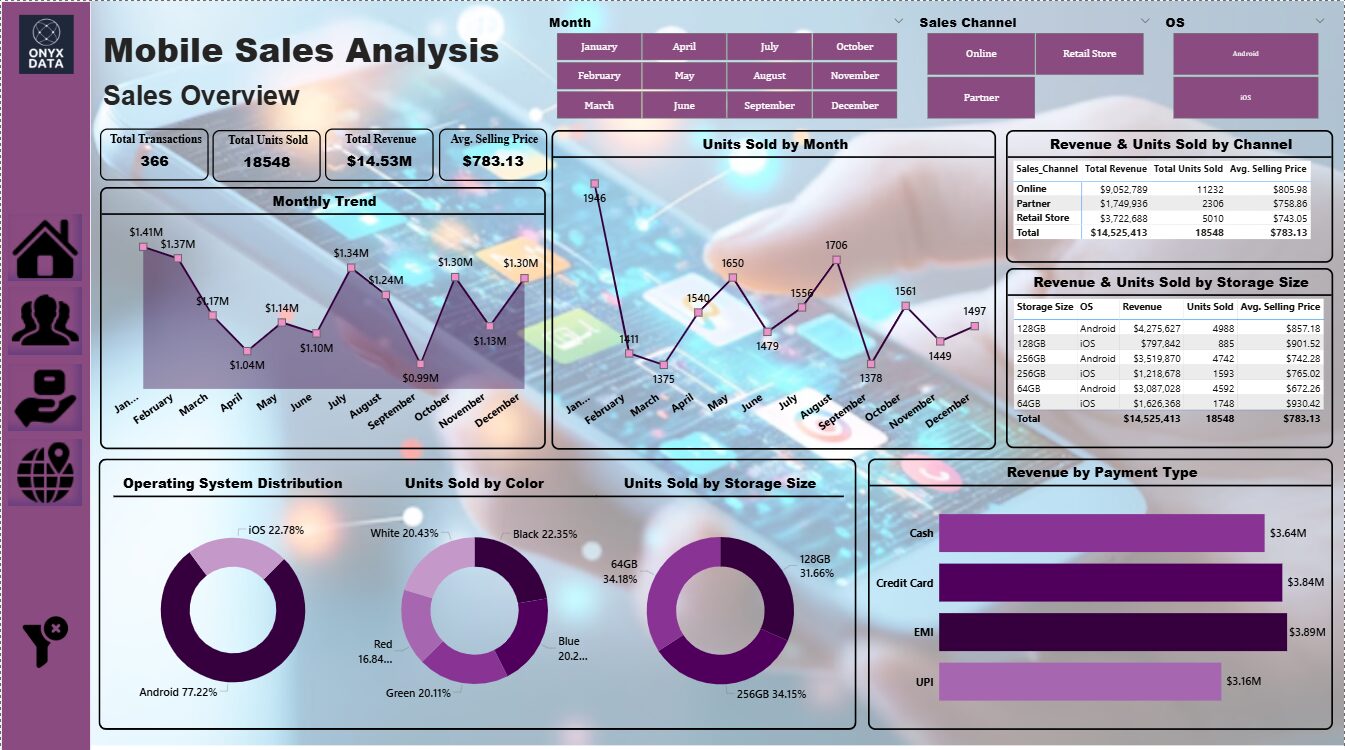
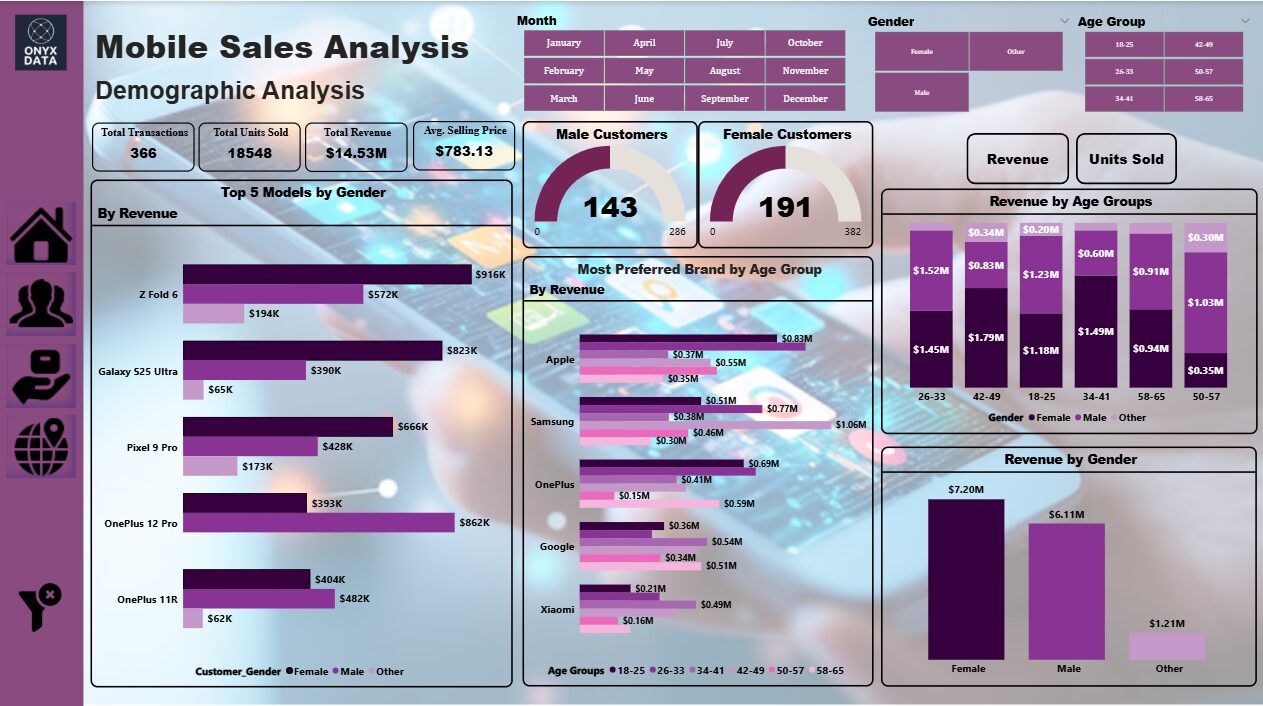
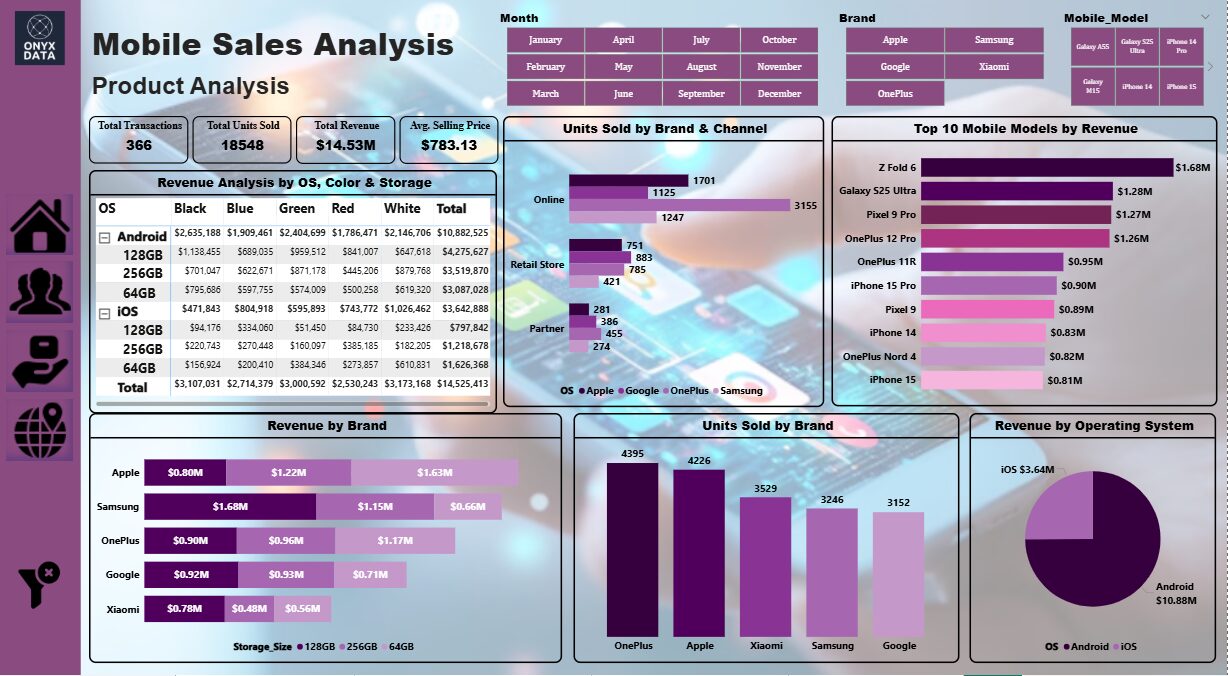
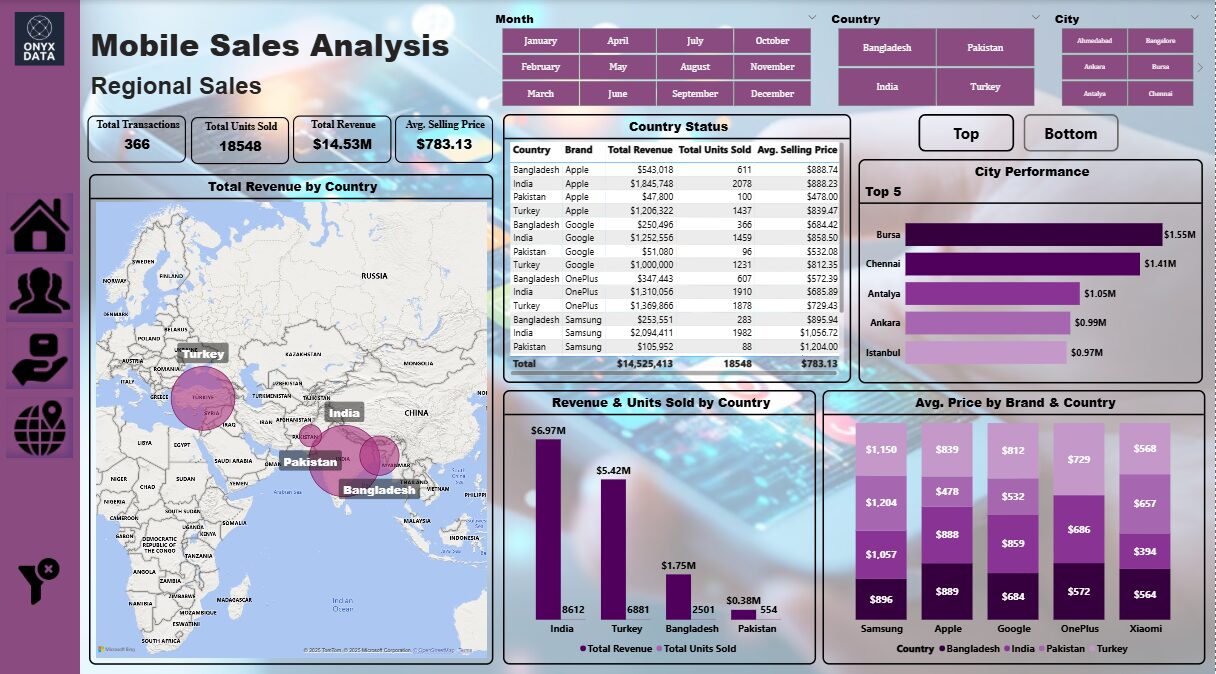
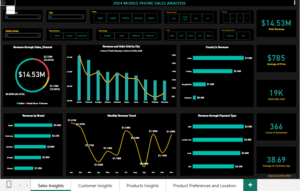
1. Sales Overview - Top Revenue Months = January ($1.41M), February ($1.37M) - Low revenue months = September ($988K) - Highest units sold = January (1946), August (1706) - Lowest units sold = March (1375) - Storage and OS = android leads across all storage types, iOS is strong in 64GB. - Sales Channel = Online sales leads in revenue, unit sold and Avg. Selling Price while Retail Stores has lowest ASP ($743.05) - Payment Method = EMI is top performing method ($3.89M) while UPI is least used ($3.16M) 2. Demographic Analysis - Revenue and Units Sold by Gender = Female customers contribute the most (~49%) and lead in quantity sold. - Top Models by Gender = Female: Z Fold 6 and Galaxy S25 Ultra. Male: OnePlus 12 Pro. Others: Z Fold 6 and Pixel 9 Pro. 3. Product Analysis - Top Brands = Apple and Samsung: ~49% of total revenue - Top Models = Samsung Z Fold 6 and Galaxy S25 Ultra (Revenue); OnePlus Nord 4 and OnePlus 12 Pro (Units Sold). 4. Regional Sales - By Country (Revenue and Units Sold) = India and Turkey lead in both. - Top cities by Revenue = Dominated by Turkish Cities: Bursa, Chennai, Antalya, Ankara, and Istanbul
Contact our team

16 Upper Woburn Place, London, Greater London, WC1H 0AF, United Kingdom


 Fiza Syed