Join a community of the most creative Business Intelligence Professionals
Join a community of the most creative Business Intelligence Professionals

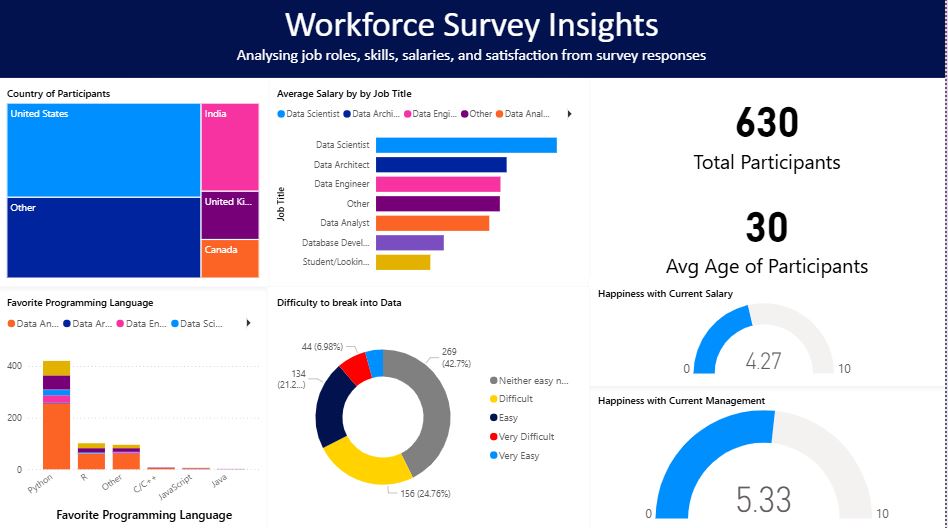
This interactive Power BI dashboard analyzes survey data to uncover insights about the data workforce including roles, salaries, skills, and job satisfaction. It summarizes key statistics such as total participants, average age, favorite programming languages, and average salaries by job title. The visuals help understand workforce diversity, difficulty of entering the data field, and happiness levels with salary and management across different roles and regions.
Contact our team

16 Upper Woburn Place, London, Greater London, WC1H 0AF, United Kingdom


