Join a community of the most creative Business Intelligence Professionals
Join a community of the most creative Business Intelligence Professionals
Find data professionals with skills verified through real challenge performance.
Browse Talent DirectoryCreate realistic synthetic data for training, testing, and demonstrations.
Explore Dataset Generator
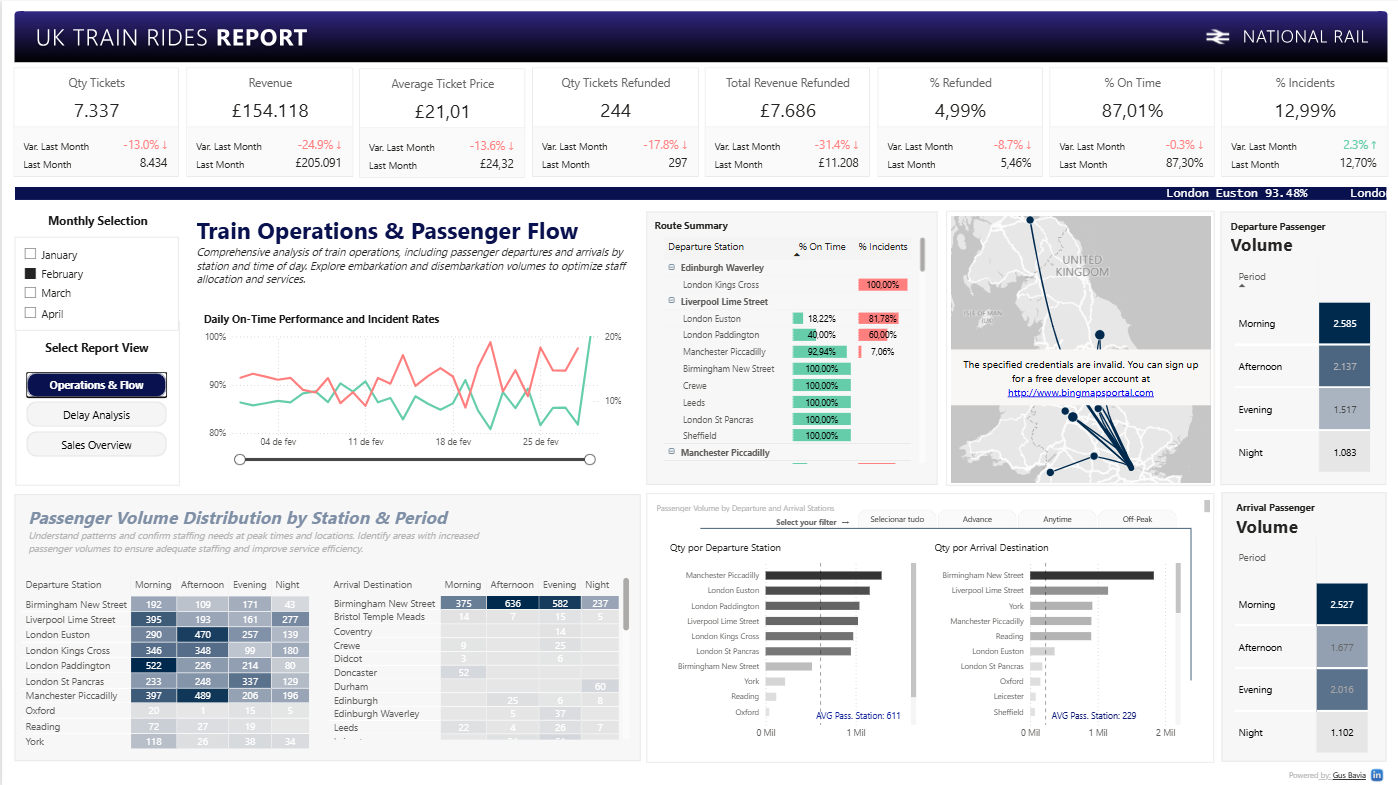
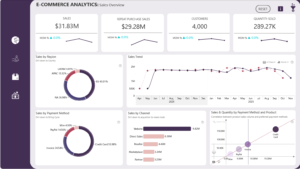
I conducted a monthly analysis with bookmarks to isolate the visualizations for focused insights. From the purchase, journey, and arrival dates, extracted detailed date breakdowns and created a new exploration by 1-hour ranges. This allowed for both individual month-by-month analysis and a comprehensive overview. The slicers included a bar slicer for easy navigation through the desired analysis period range. I also focused on showcasing month-over-month variations to analyze behaviors and trends continuously. A flow map was incorporated to identify routes and destinations, providing a clear visualization of the most traveled paths and areas needing attention.
Contact our team

16 Upper Woburn Place, London, Greater London, WC1H 0AF, United Kingdom


 Peter N
 Sunil Kumar
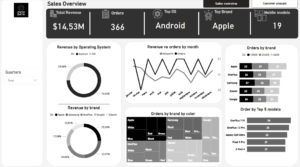
 Akindele Victor Omolayo