Join a community of the most creative Business Intelligence Professionals
Join a community of the most creative Business Intelligence Professionals
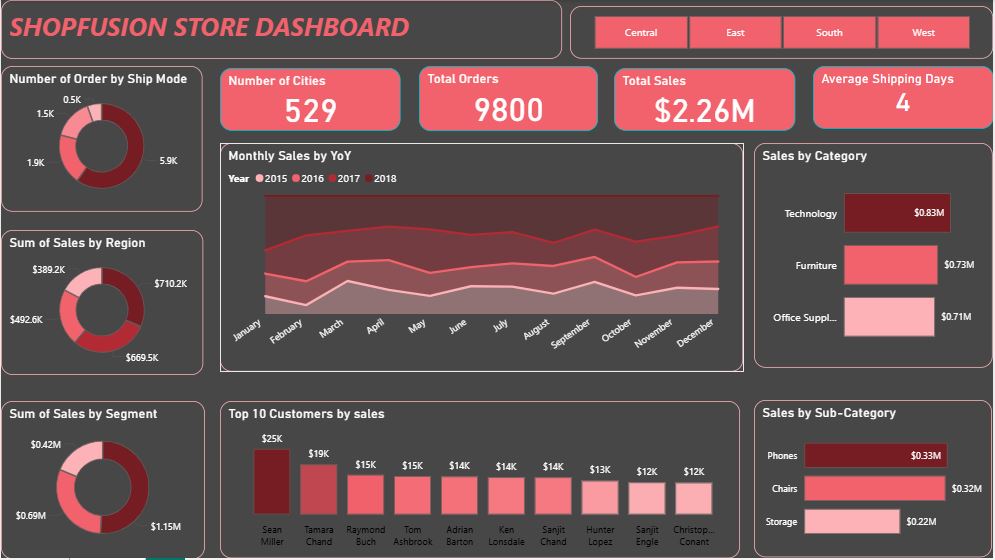

This Power BI dashboard provides an end-to-end analysis of superstore sales performance across regions, categories, and customer segments. It highlights key KPIs such as Total Sales, Total Orders, and Average Shipping Days, while visualizing top-performing customers, product subcategories, and sales trends over time. The dashboard enables quick insights into regional performance and yearly sales growth, helping identify areas for revenue optimization.
Contact our team

16 Upper Woburn Place, London, Greater London, WC1H 0AF, United Kingdom


