Join a community of the most creative Business Intelligence Professionals
Join a community of the most creative Business Intelligence Professionals
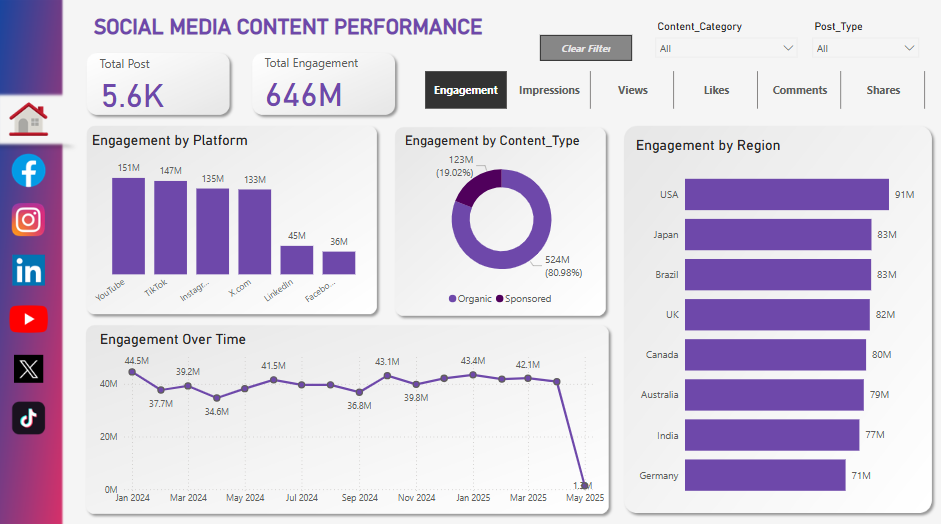

This Power BI dashboard report provides a concise overview and detailed analysis of social media content performance. It tracks key metrics like Total Posts and Total Engagement, breaking down engagement by platform (e.g., YouTube, TikTok), content type (Organic vs. Sponsored), and geographical region. A prominent line chart visualizes Engagement Over Time, highlighting trends and anomalies (like the sharp drop in May 2025). The interactive tabs allow users to switch between different performance metrics such as Engagement, Impressions, Views, Likes, Comments, and Shares, enabling a comprehensive understanding of content effectiveness.
Contact our team

16 Upper Woburn Place, London, Greater London, WC1H 0AF, United Kingdom


