Join a community of the most creative Business Intelligence Professionals
Join a community of the most creative Business Intelligence Professionals
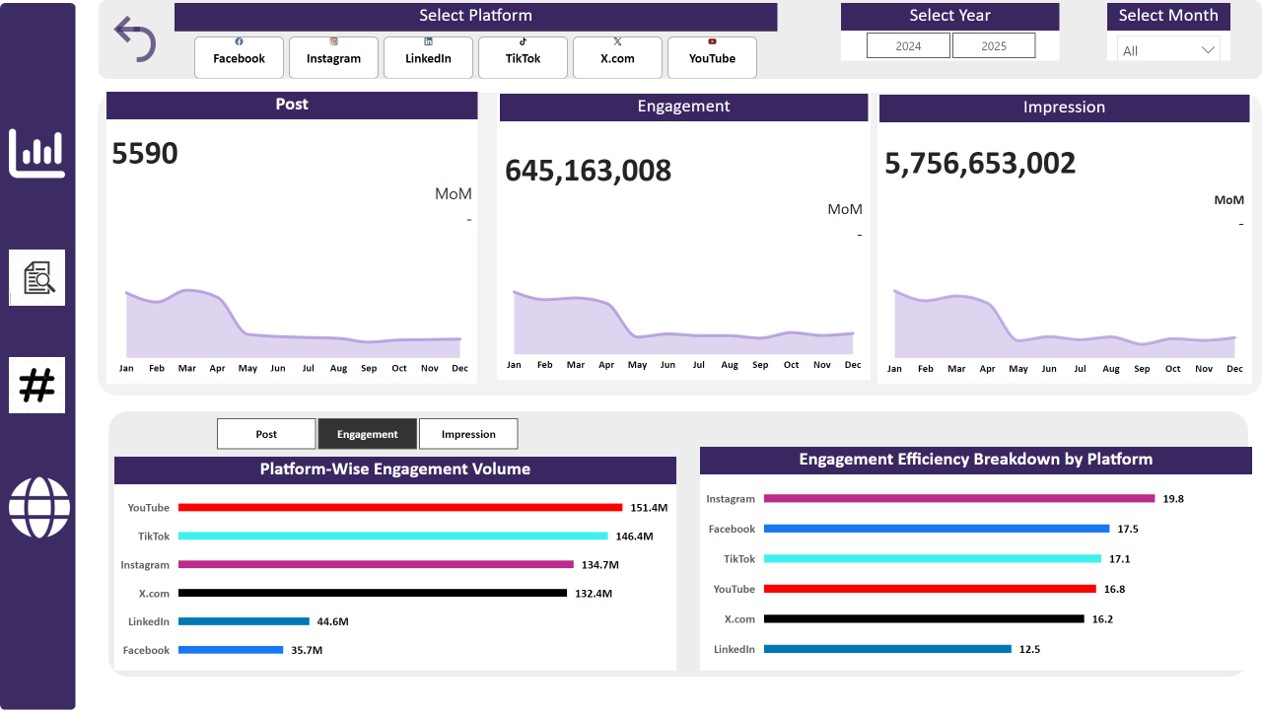
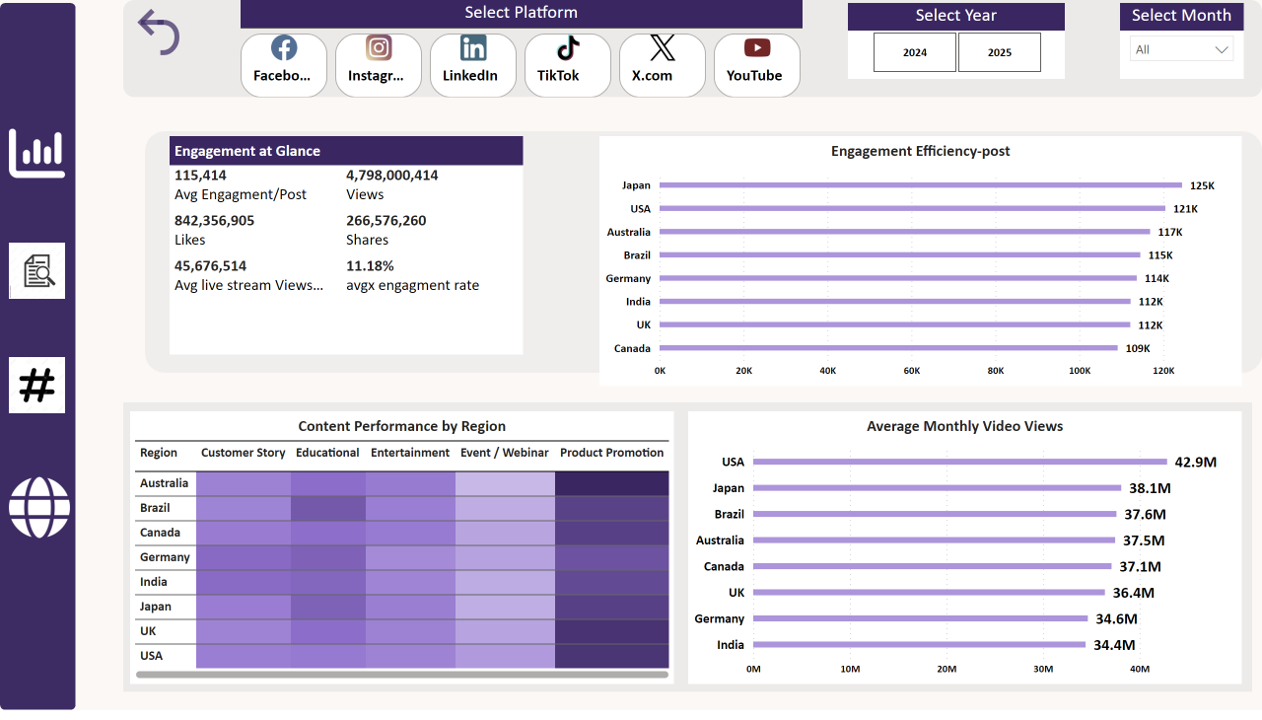
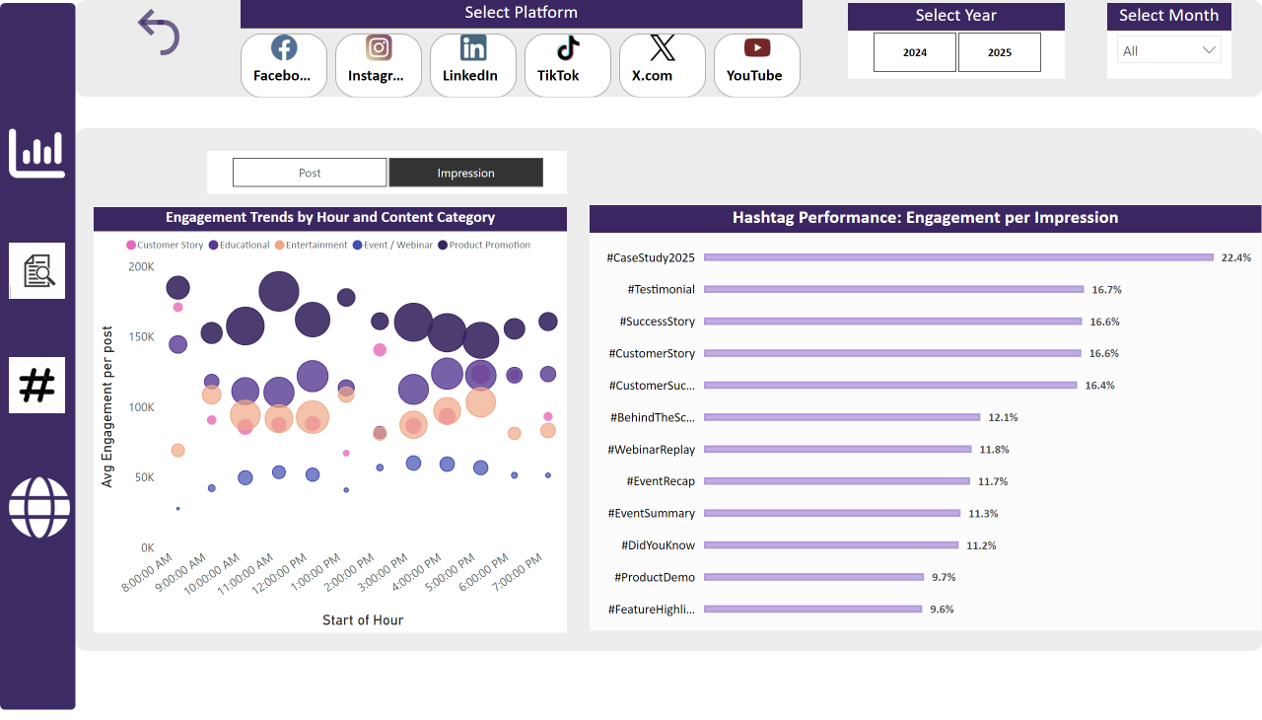
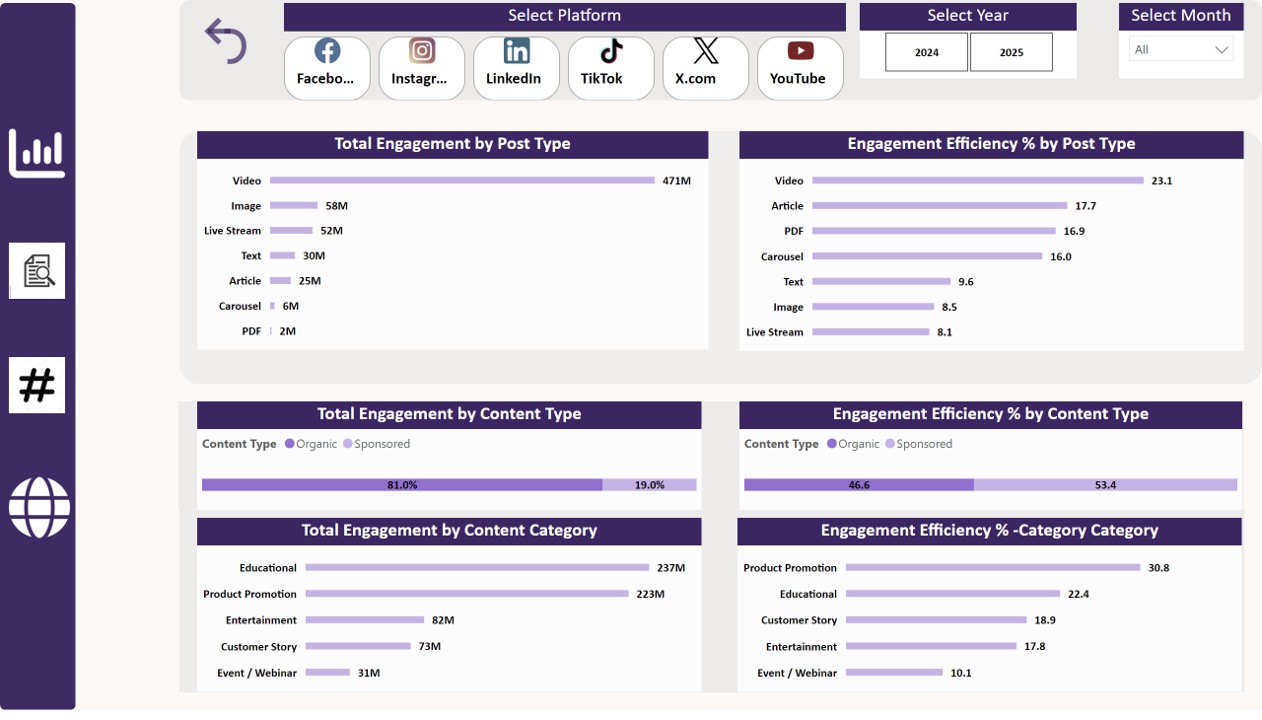
I explored social media platform overview and analysis, regional trends, timing and top performing hashtag. Key Insight I performed analysis comparing Volume Vs Efficiency of engagement rate. 1) You tube and TikTok leads in total engagement volume but engagement efficiency share % across platforms Instagram and Facebook has higher engagement. 2) Overall all post type Video has higher engagement in volume and also engagement efficiency. Facebook post type engagement leads in text but when it comes to engagement efficiency it is image. 3) Sponsored content type has 53.4% engagement efficiency compared to organic content. 4) Product Promotion leads in engagement efficiency followed by Educational category. 5) Top performing hashtag (hashtag effectiveness by using divide total engagement/total impression) that brings audience reach/visibility to content. 6) engagement Trends analysis by hour and content category - when there are higher impression it leads to higher engagement as it shows in the scatter chart. Product promotion has higher engagement when post between 10:00am to 12:00 pm and 3:00 pm to 5:00pm. 7) Japan leads in engagement efficiency rate followed by USA. Facebook most popular content in India is educational . You tube is the most popular platform for product promotion performance in all the regions.
Contact our team

16 Upper Woburn Place, London, Greater London, WC1H 0AF, United Kingdom


