Join a community of the most creative Business Intelligence Professionals
Join a community of the most creative Business Intelligence Professionals
Find data professionals with skills verified through real challenge performance.
Browse Talent DirectoryCreate realistic synthetic data for training, testing, and demonstrations.
Explore Dataset Generator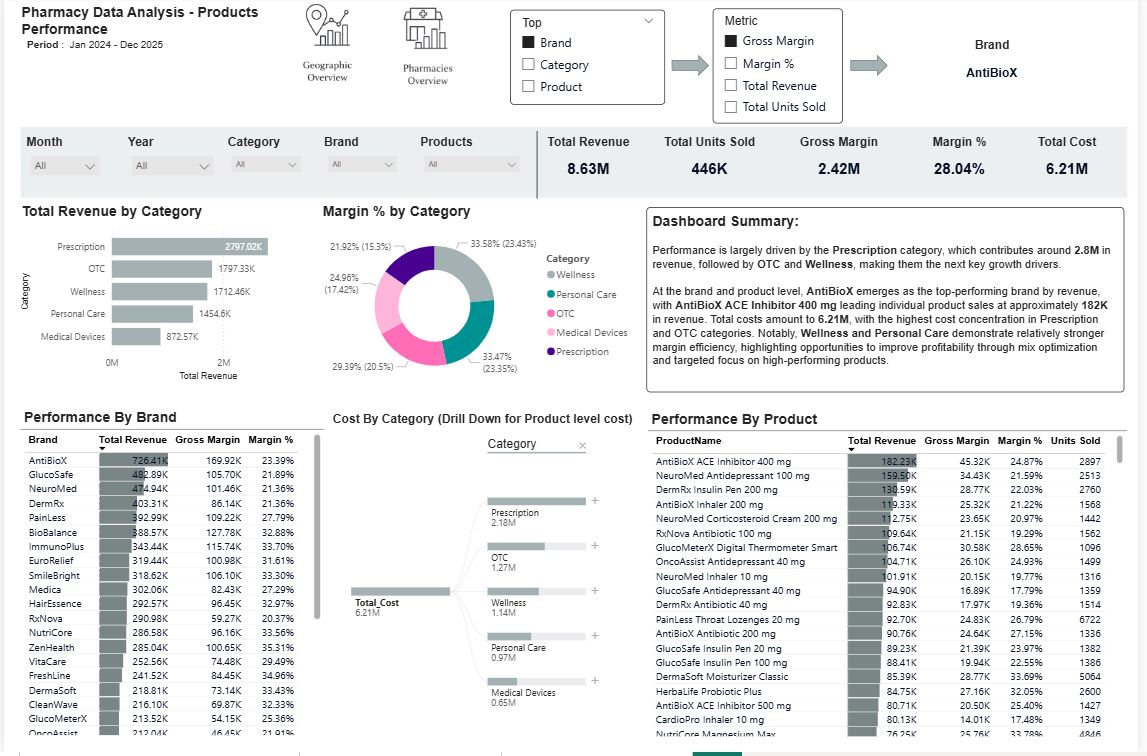
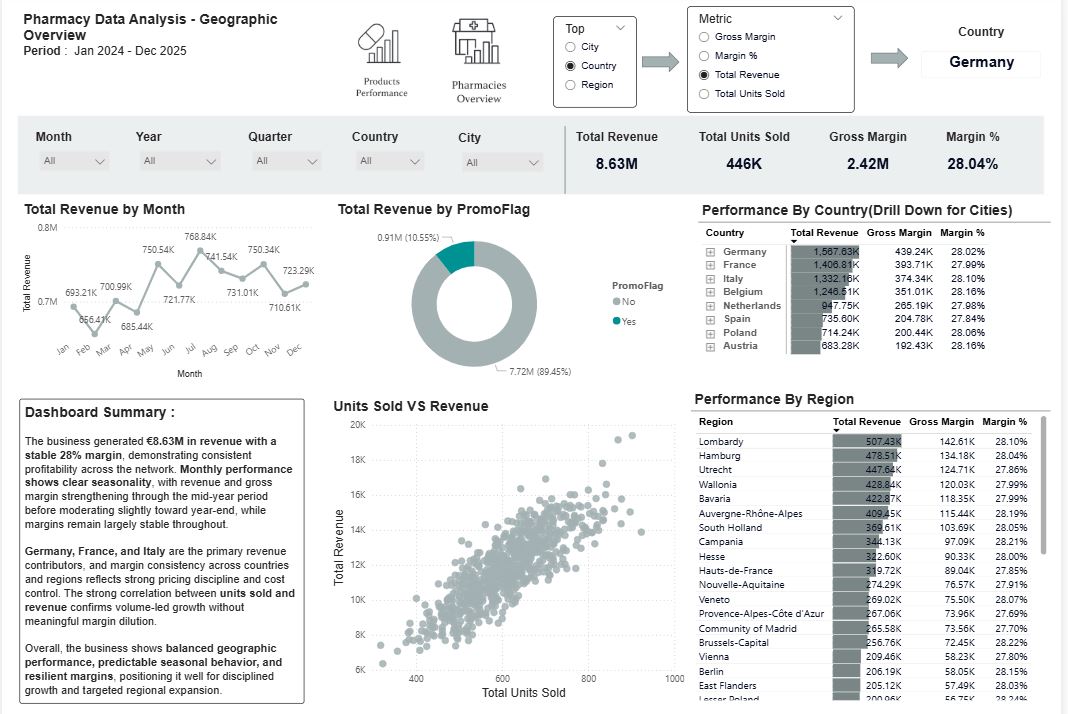
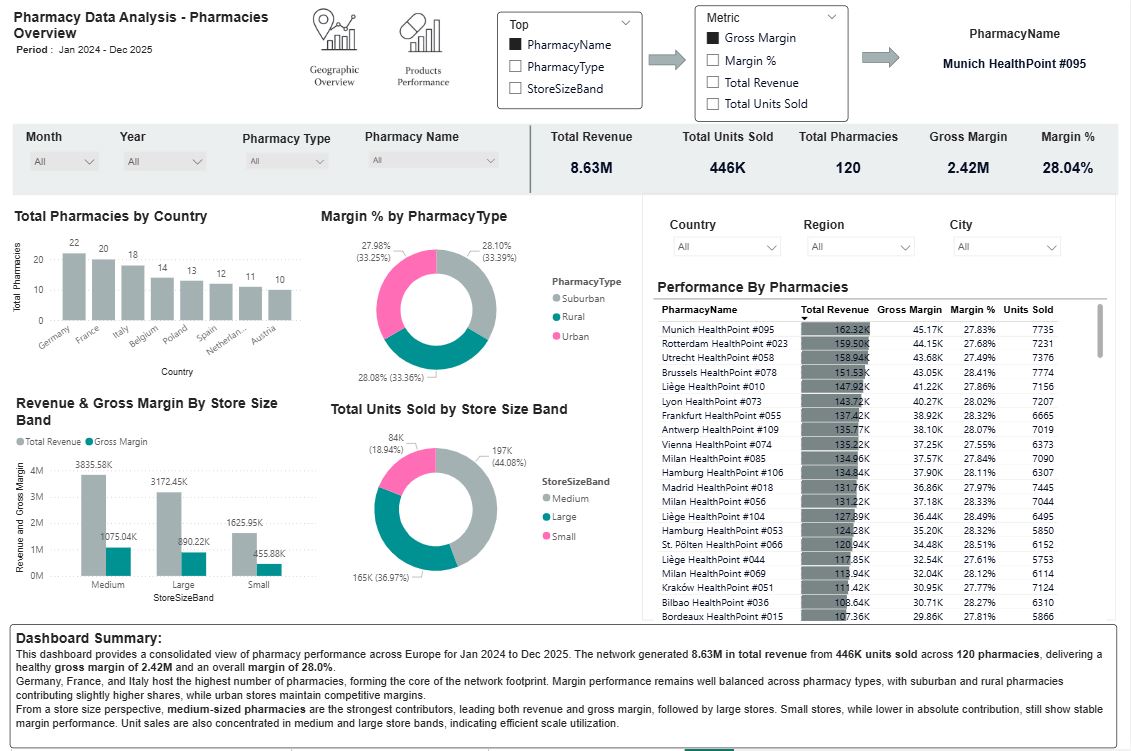
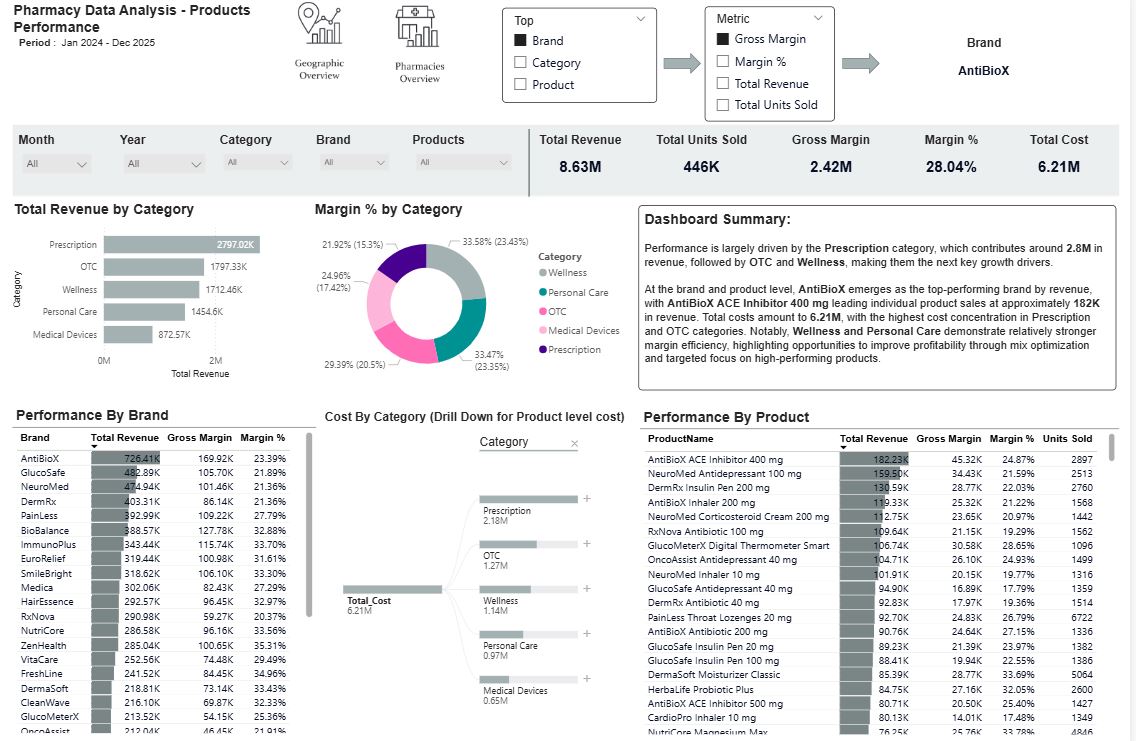
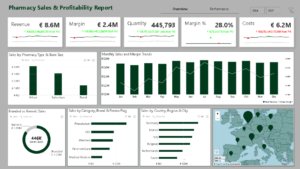
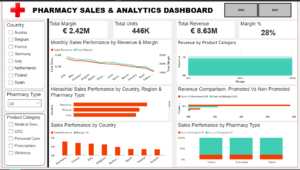
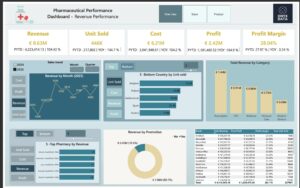
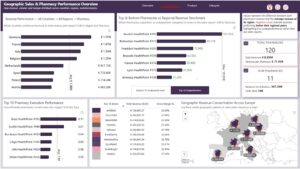
A European pharmacy chain distributor operates across multiple countries, regions, and cities, offering a wide range of pharmaceutical products through a network of pharmacies. While the organization captures detailed daily sales and cost data at the pharmacy and product level, decision-makers currently lack a consolidated, interactive view of business performance. The leadership team needs a data-driven analytical solution to understand how sales, profitability, and margins vary across geographies, pharmacy formats, and product segments. They also want to identify top- and under-performing pharmacies, regions, and product categories to support pricing decisions, inventory planning, and regional expansion strategies. The report should enable stakeholders to: Compare sales, gross margin, and profitability across countries, regions, and individual pharmacies Analyze product performance by category, brand, and SKU across different geographic markets Evaluate regional contributions to overall revenue and profit Identify performance patterns, outliers, and growth opportunities using interactive filters and drill-downs
Contact our team

16 Upper Woburn Place, London, Greater London, WC1H 0AF, United Kingdom


 Iman Ngwepe
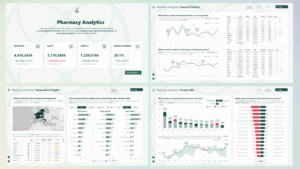
 Benedicta Otakpor
 Clarisse S.
 Akindele Victor Omolayo