Join a community of the most creative Business Intelligence Professionals
Join a community of the most creative Business Intelligence Professionals
Find data professionals with skills verified through real challenge performance.
Browse Talent DirectoryCreate realistic synthetic data for training, testing, and demonstrations.
Explore Dataset Generator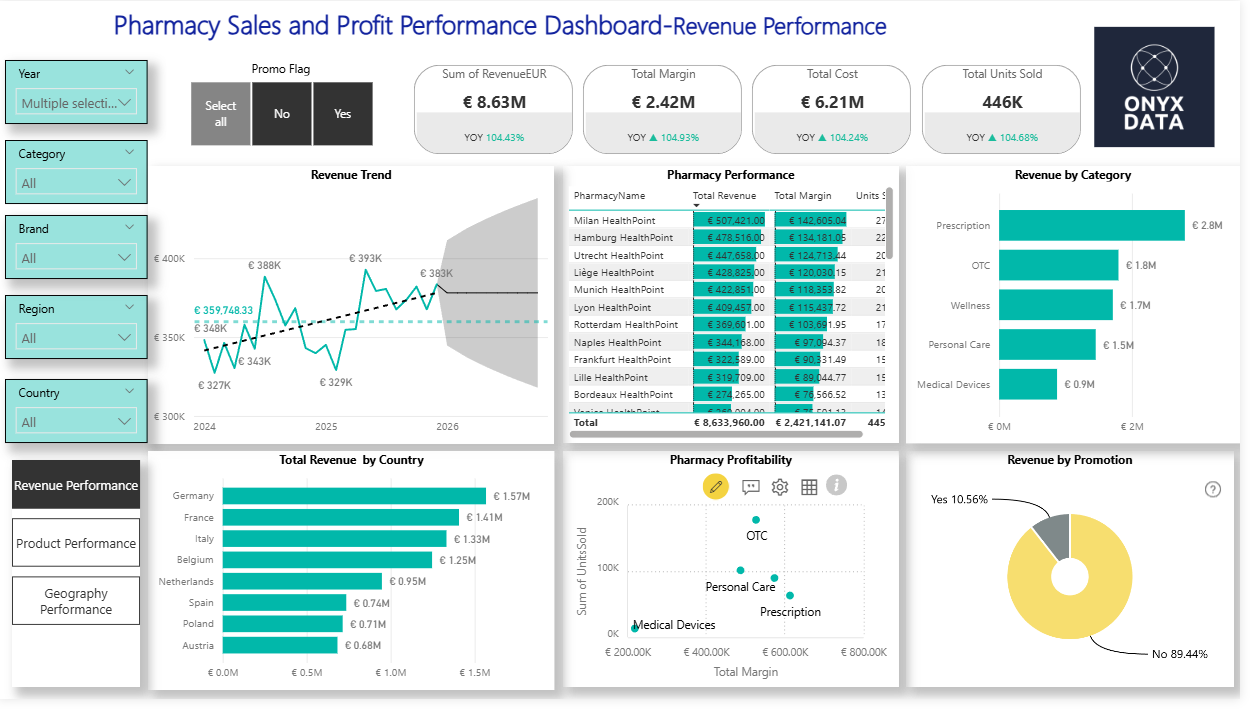

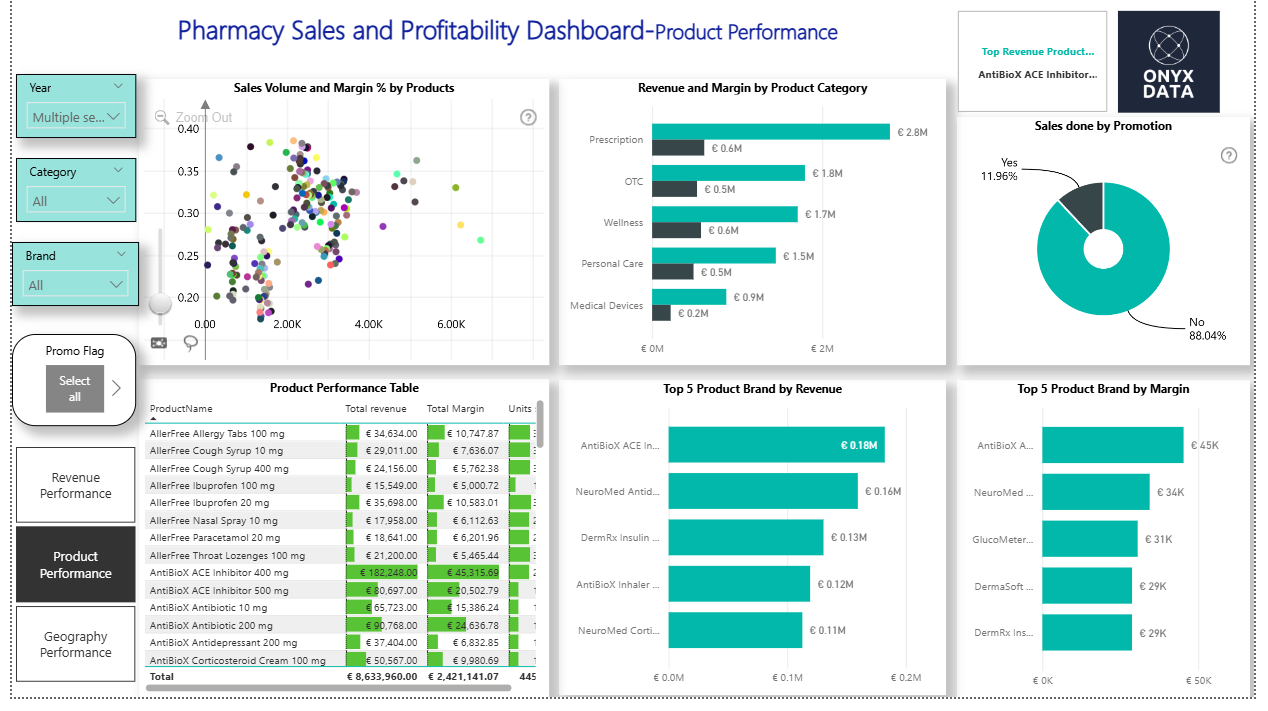
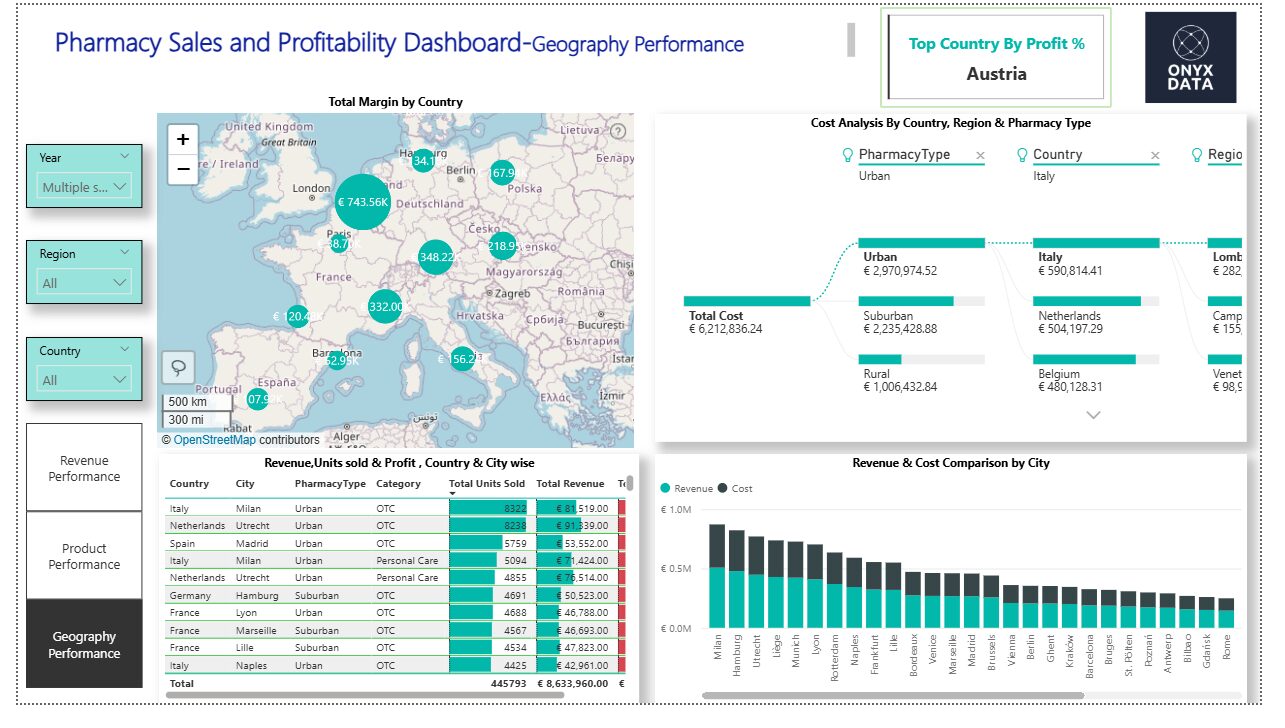
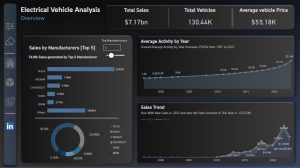
This Dashboard analyses sales and profitability across a European pharmacy chain, highlighting performance by country, region, pharmacy, product category, and brand to support data-driven business decisions. The dashboard demonstrates overall performance while also revealing deeper behavioural patterns in the data. It highlights whether revenue shows any seasonal trends across the period and whether promotional activity contributes to revenue growth. This dashboard also identifies the top revenue‑generating products and the strongest‑performing countries. In addition, it surfaces the five leading product brands based on both profitability and revenue. The dashboard also examines how high‑margin products relate to sales volume. Altogether, it provides stakeholders with clear, actionable insights that support confident and timely decision‑making.
Contact our team

16 Upper Woburn Place, London, Greater London, WC1H 0AF, United Kingdom


 Nana Kwesi Safo