Join a community of the most creative Business Intelligence Professionals
Join a community of the most creative Business Intelligence Professionals

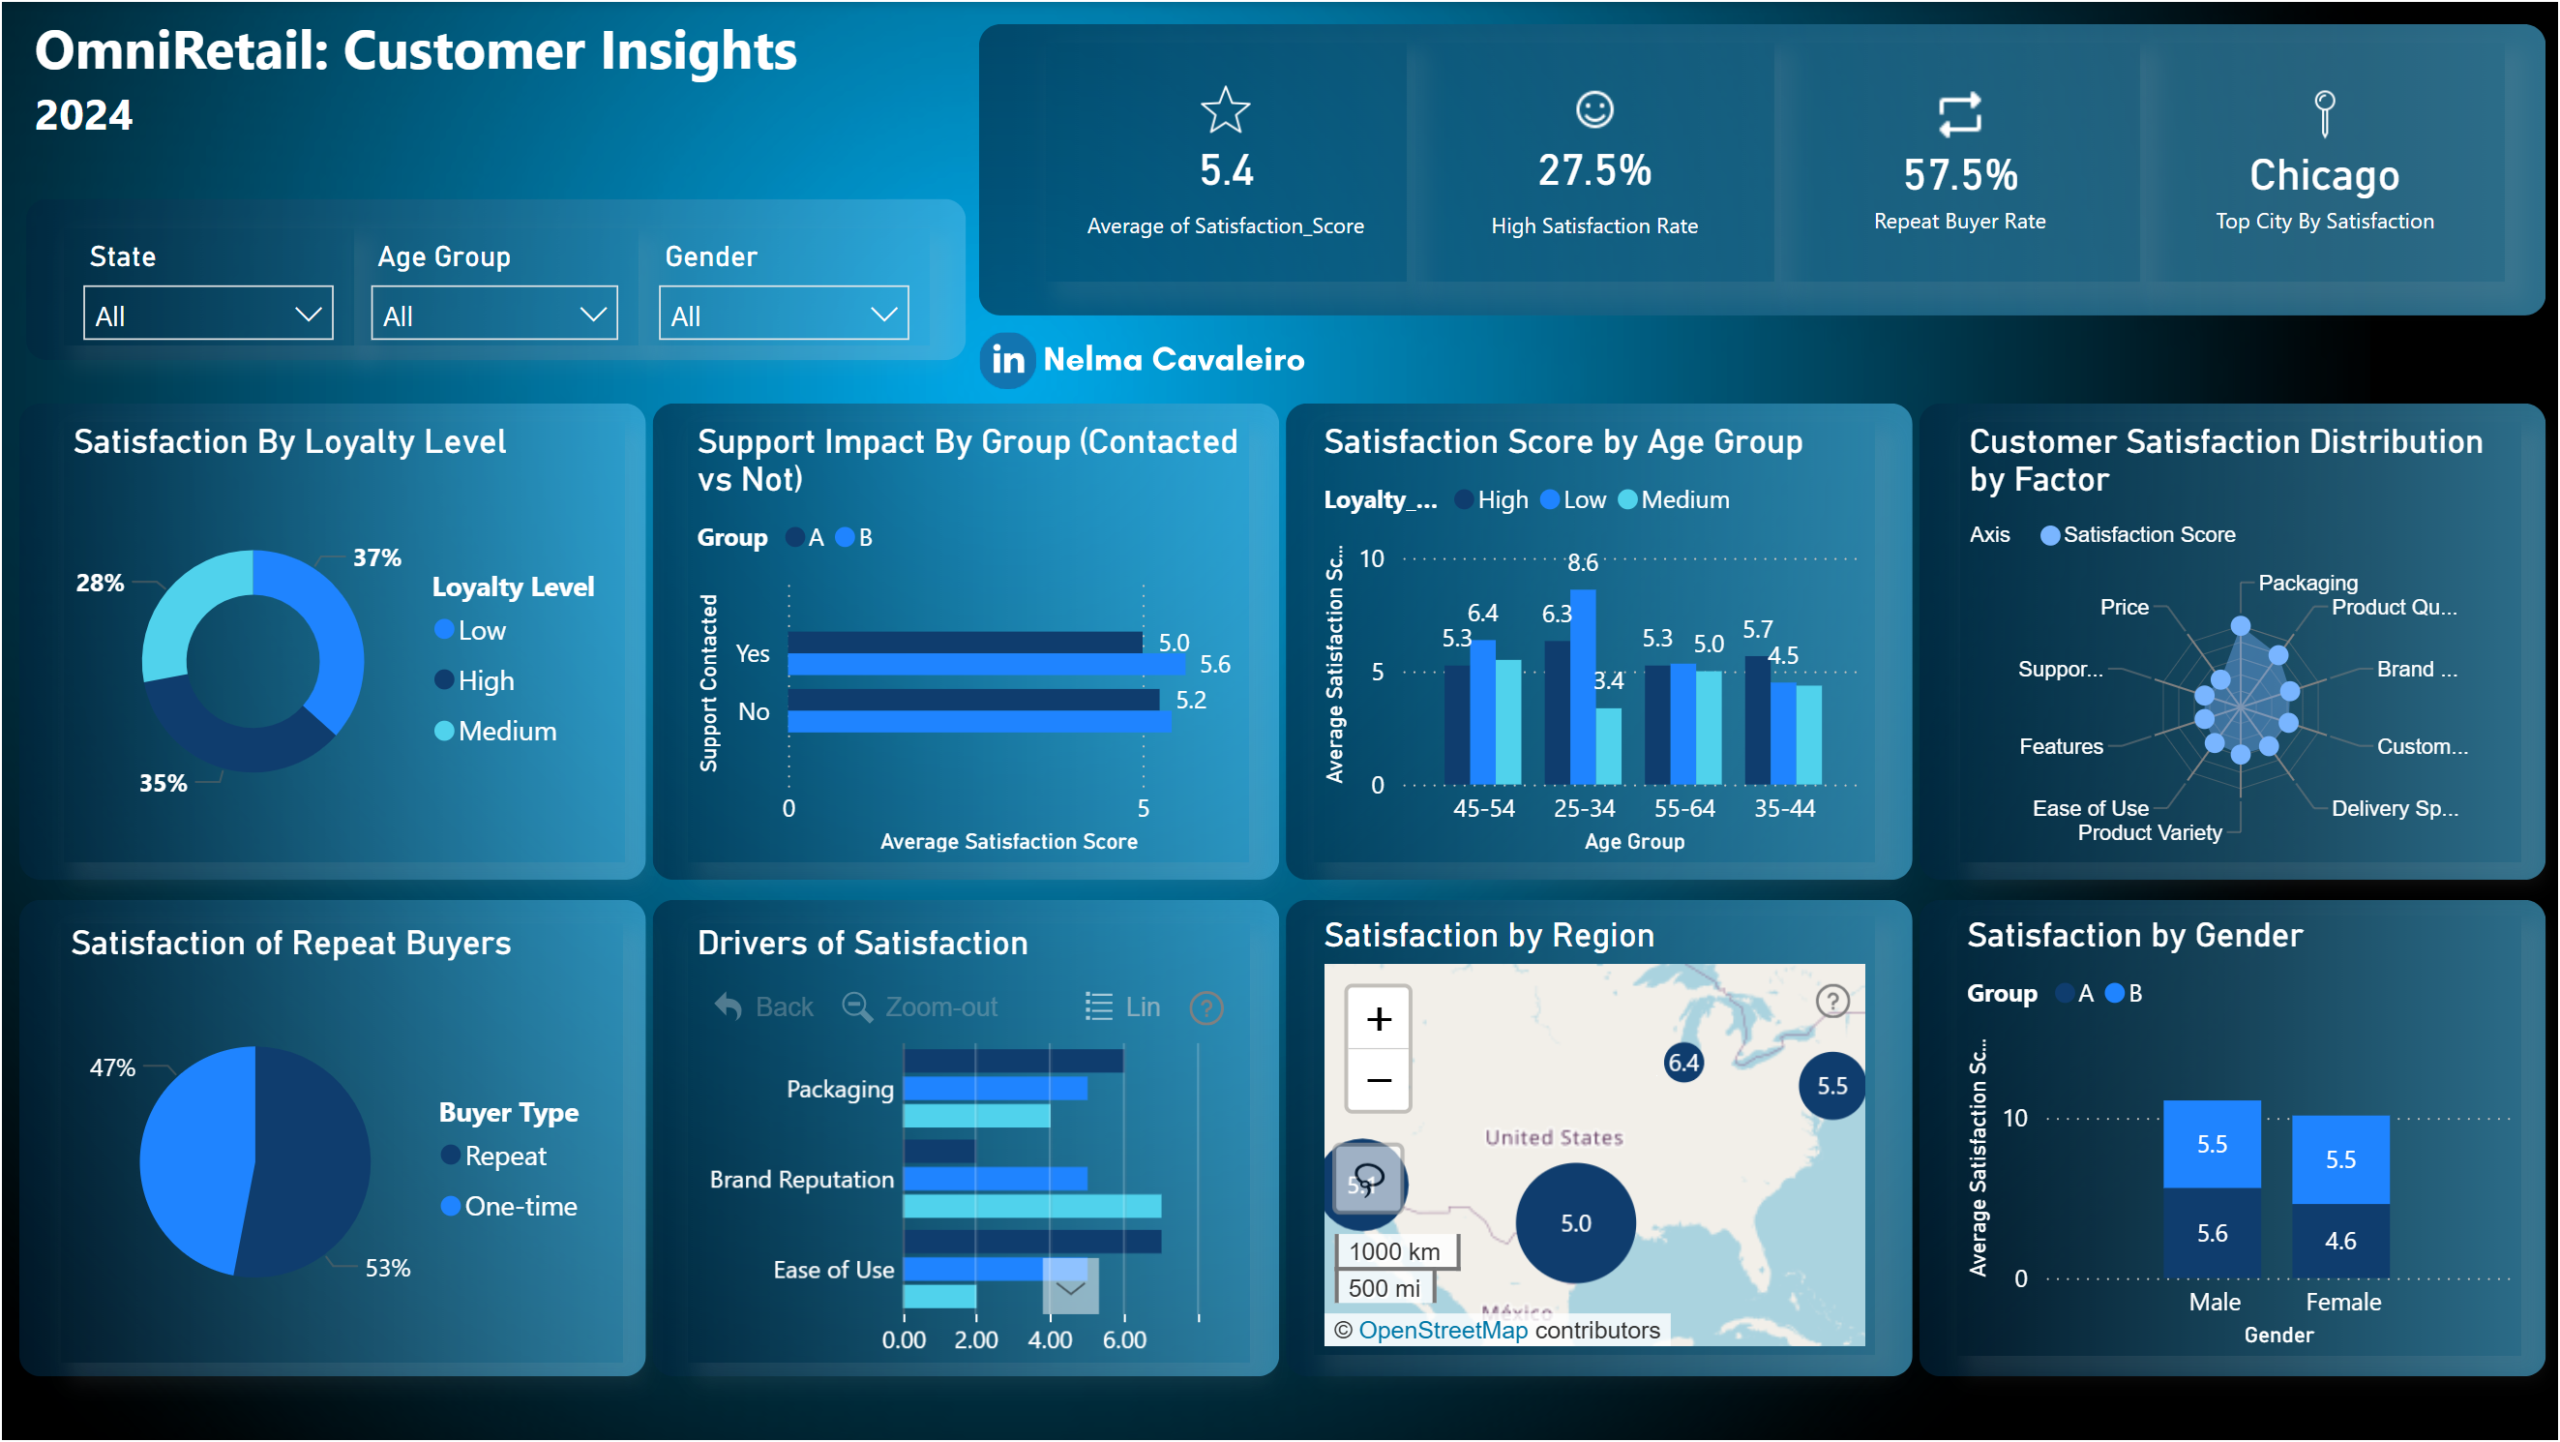
This Power BI dashboard was created for the DataDNA July 2025 Challenge. The project involved analysing customer satisfaction across demographics, loyalty levels, and support interactions to uncover actionable business insights. Key findings include: Chicago led in average satisfaction score Contact with support was linked to higher satisfaction Highest satisfaction was observed in loyal customers aged 25–34 Drivers like packaging and brand reputation stood out No significant satisfaction differences between genders The layout was enhanced using Canva to create a clear, visually aligned dashboard ready for stakeholder presentation.
Contact our team

16 Upper Woburn Place, London, Greater London, WC1H 0AF, United Kingdom


