Join a community of the most creative Business Intelligence Professionals
Join a community of the most creative Business Intelligence Professionals

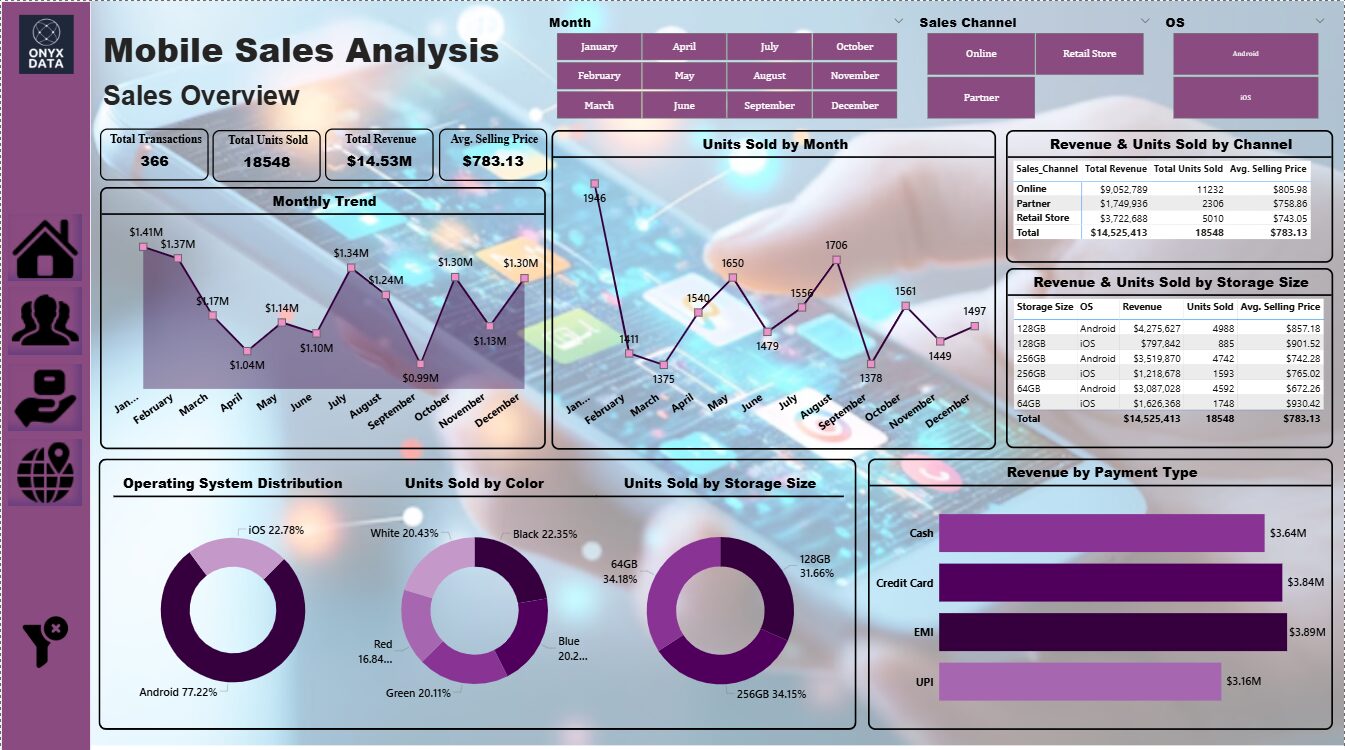
1. Sales Overview - Top Revenue Months = January ($1.41M), February ($1.37M) - Low revenue months = September ($988K) - Highest units sold = January (1946), August (1706) - Lowest units sold = March (1375) - Storage and OS = android leads across all storage types, iOS is strong in 64GB. - Sales Channel = Online sales leads in revenue, unit sold and Avg. Selling Price while Retail Stores has lowest ASP ($743.05) - Payment Method = EMI is top performing method ($3.89M) while UPI is least used ($3.16M) 2. Demographic Analysis - Revenue and Units Sold by Gender = Female customers contribute the most (~49%) and lead in quantity sold. - Top Models by Gender = Female: Z Fold 6 and Galaxy S25 Ultra. Male: OnePlus 12 Pro. Others: Z Fold 6 and Pixel 9 Pro. 3. Product Analysis - Top Brands = Apple and Samsung: ~49% of total revenue - Top Models = Samsung Z Fold 6 and Galaxy S25 Ultra (Revenue); OnePlus Nord 4 and OnePlus 12 Pro (Units Sold). 4. Regional Sales - By Country (Revenue and Units Sold) = India and Turkey lead in both. - Top cities by Revenue = Dominated by Turkish Cities: Bursa, Chennai, Antalya, Ankara, and Istanbul
Contact our team
16 Upper Woburn Place, London, Greater London, WC1H 0AF, United Kingdom
