Join a community of the most creative Business Intelligence Professionals
Join a community of the most creative Business Intelligence Professionals
Find data professionals with skills verified through real challenge performance.
Browse Talent DirectoryCreate realistic synthetic data for training, testing, and demonstrations.
Explore Dataset Generator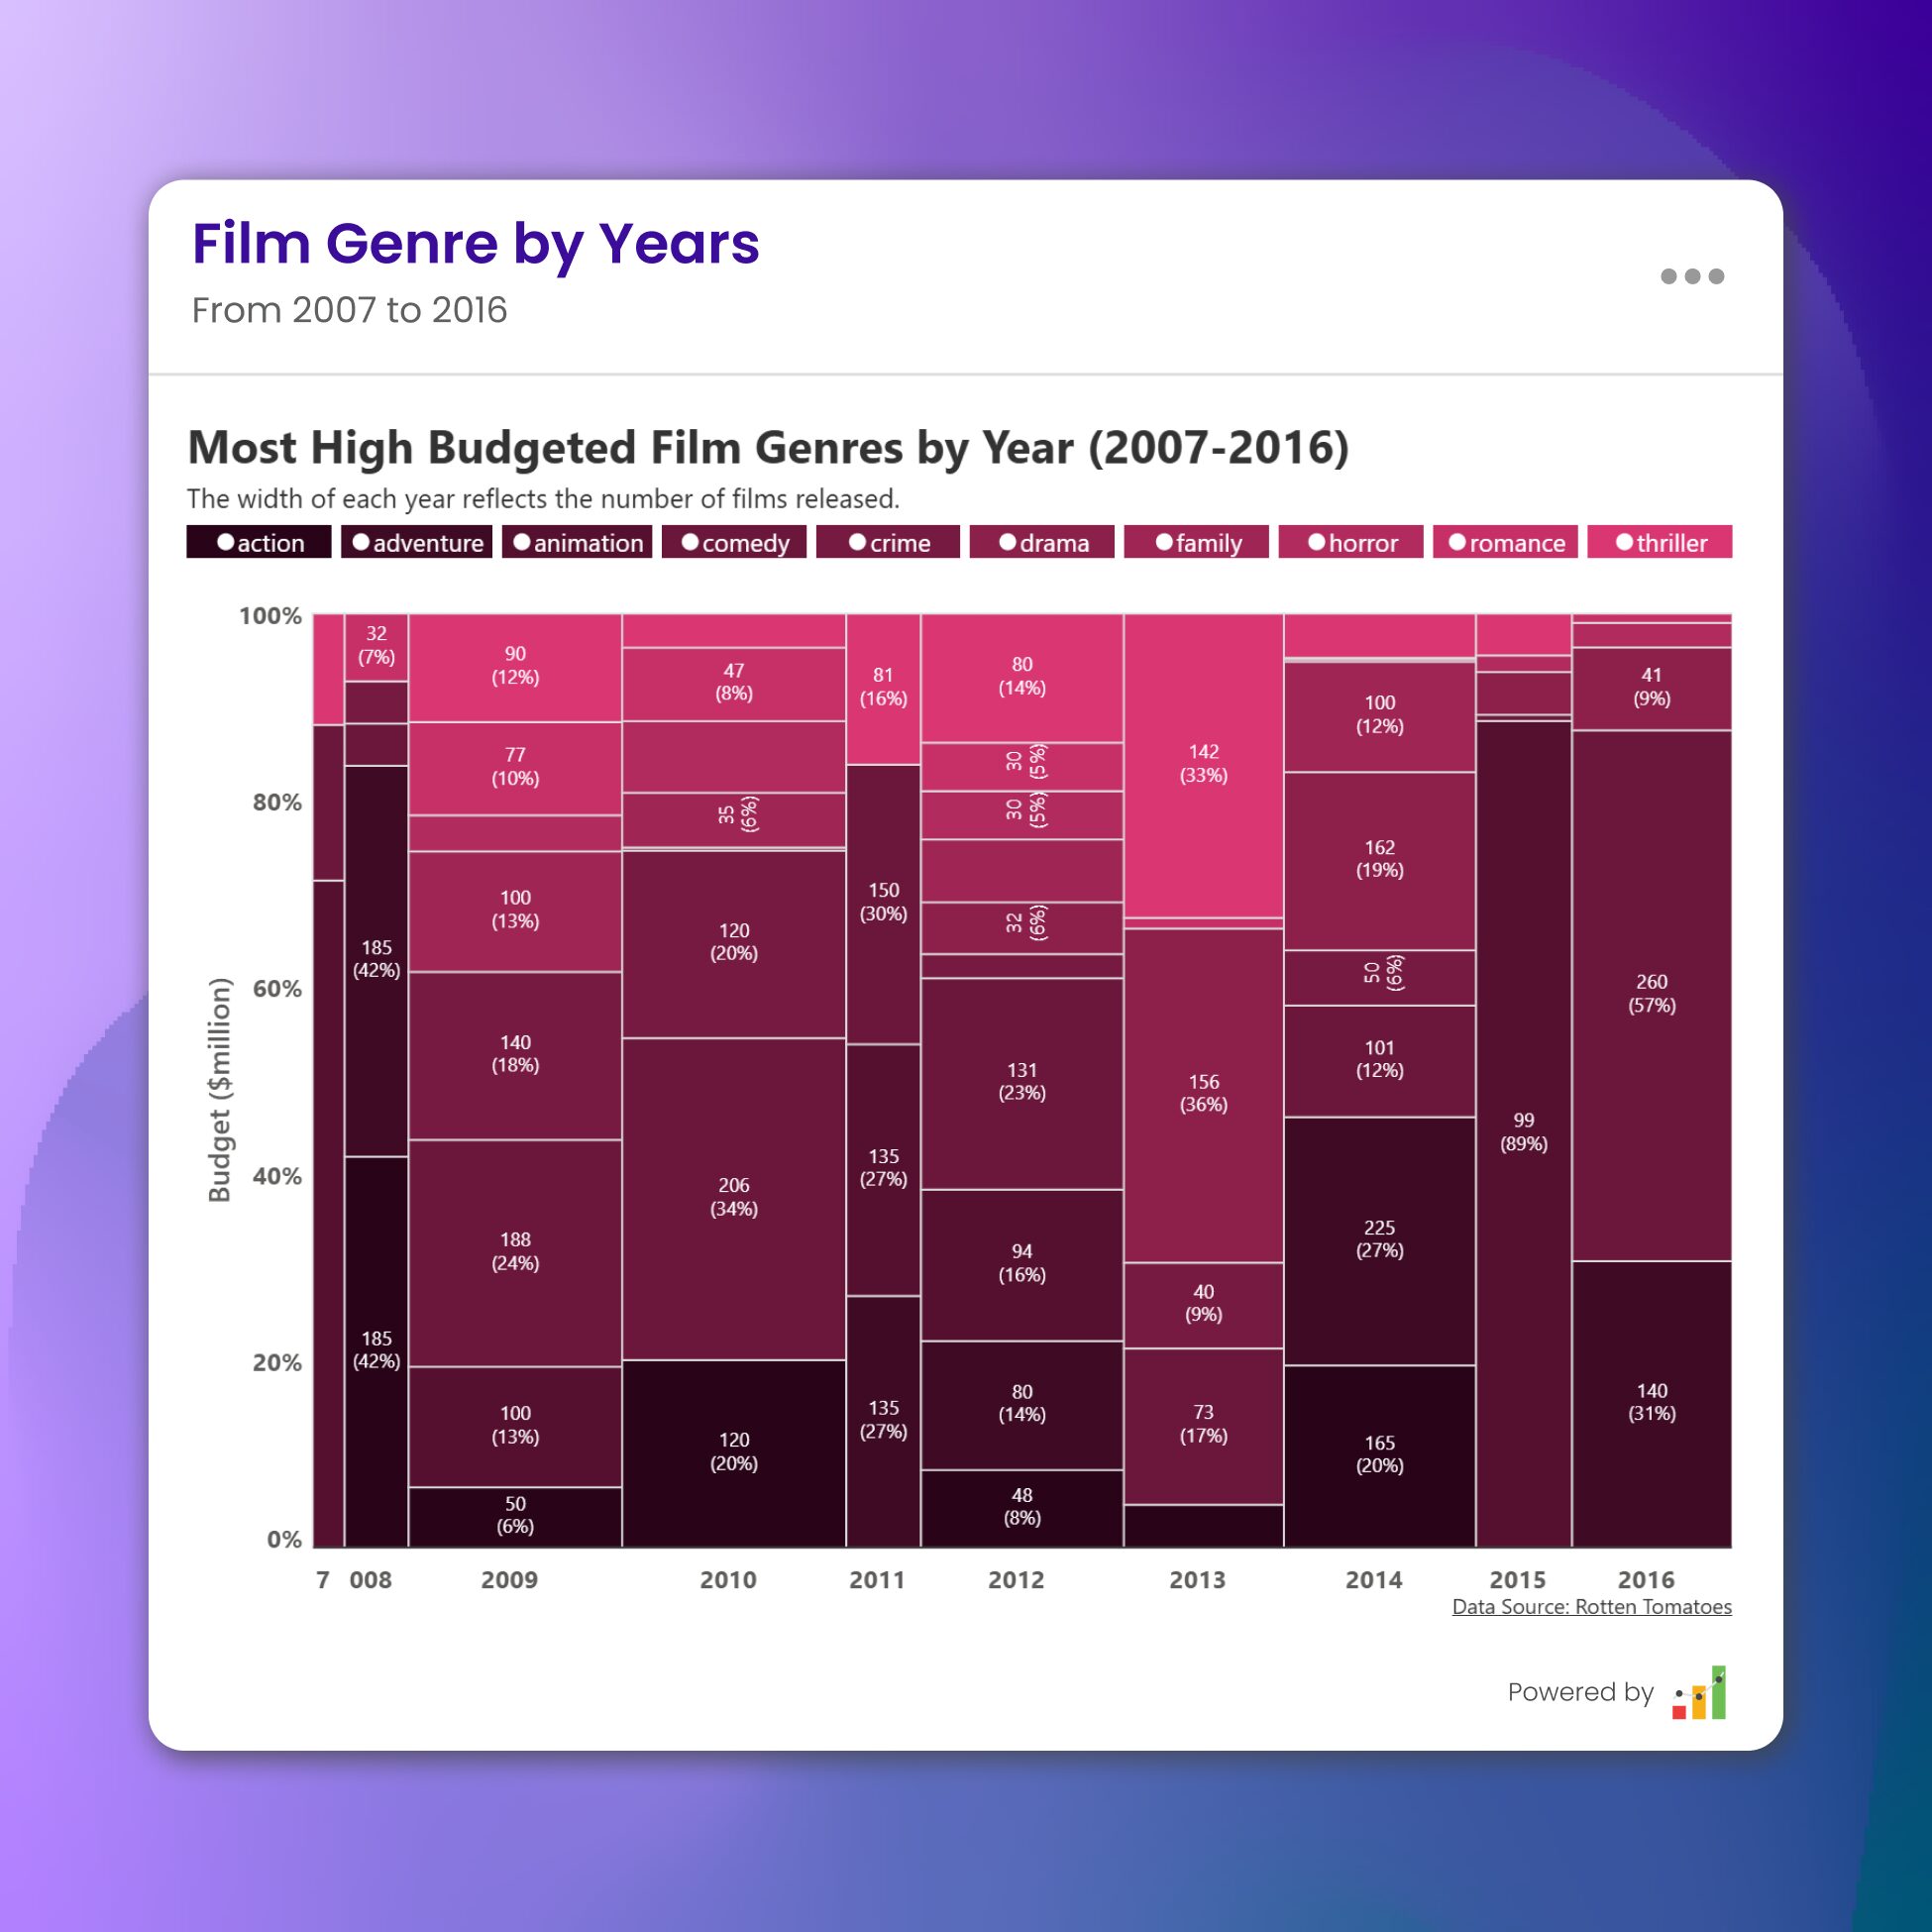

Shows the budget distribution of high-budget film genres each year from 2007 to 2016. Different colors represent genres like action, comedy, and drama, with budget amounts and percentages displayed within each segment. Built by Inforiver Analytics+ in Power BI
Contact our team

16 Upper Woburn Place, London, Greater London, WC1H 0AF, United Kingdom


 Innocent OWOBU
 Akindele Victor Omolayo