Join a community of the most creative Business Intelligence Professionals
Join a community of the most creative Business Intelligence Professionals

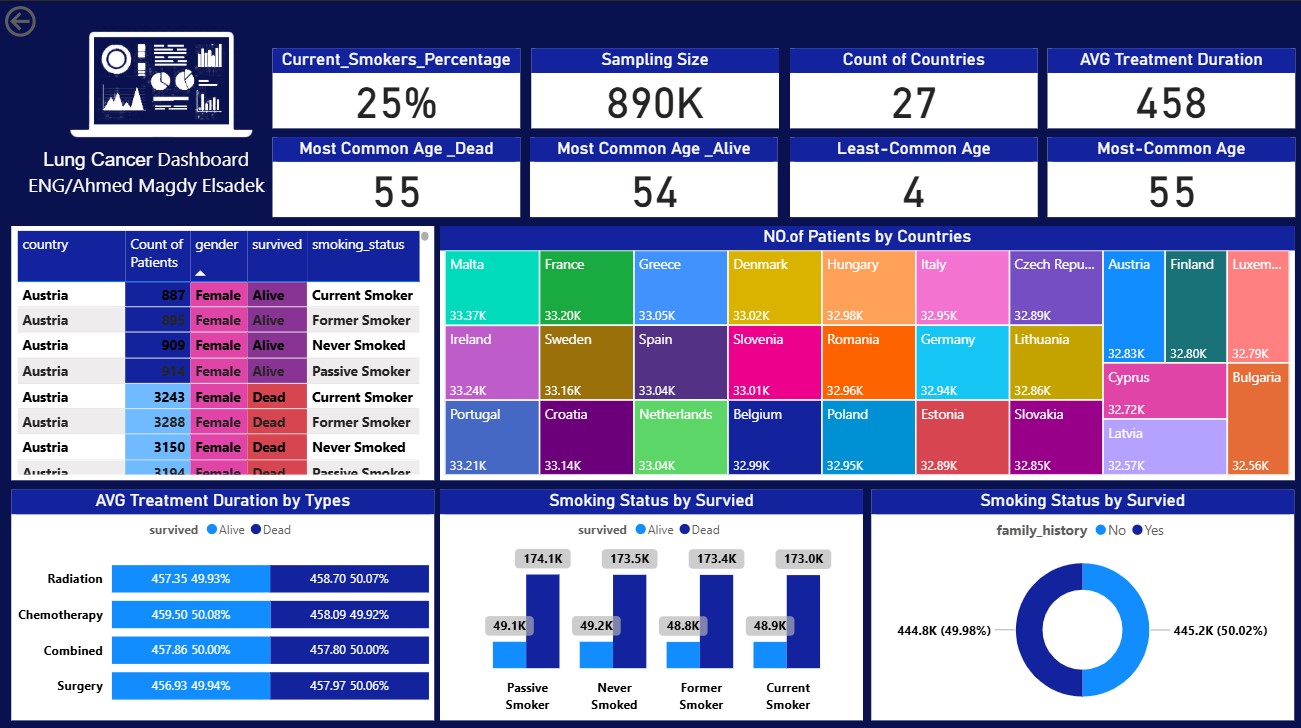
This Power BI dashboard visualizes key diagnostic indicators related to lung cancer, helping medical professionals identify patterns and correlations between symptoms, smoking status, age groups, and test results. The report is designed to support early detection and improve clinical decision-making by showcasing data trends across multiple dimensions. Key Visuals include: Patient distribution by diagnosis (Benign vs Malignant) Age vs Diagnosis patterns Smoking status impact Gender-based analysis Lung region correlation Built with Power BI using DAX and data modeling techniques to transform raw medical data into actionable insights
Contact our team

16 Upper Woburn Place, London, Greater London, WC1H 0AF, United Kingdom


