Join a community of the most creative Business Intelligence Professionals
Join a community of the most creative Business Intelligence Professionals
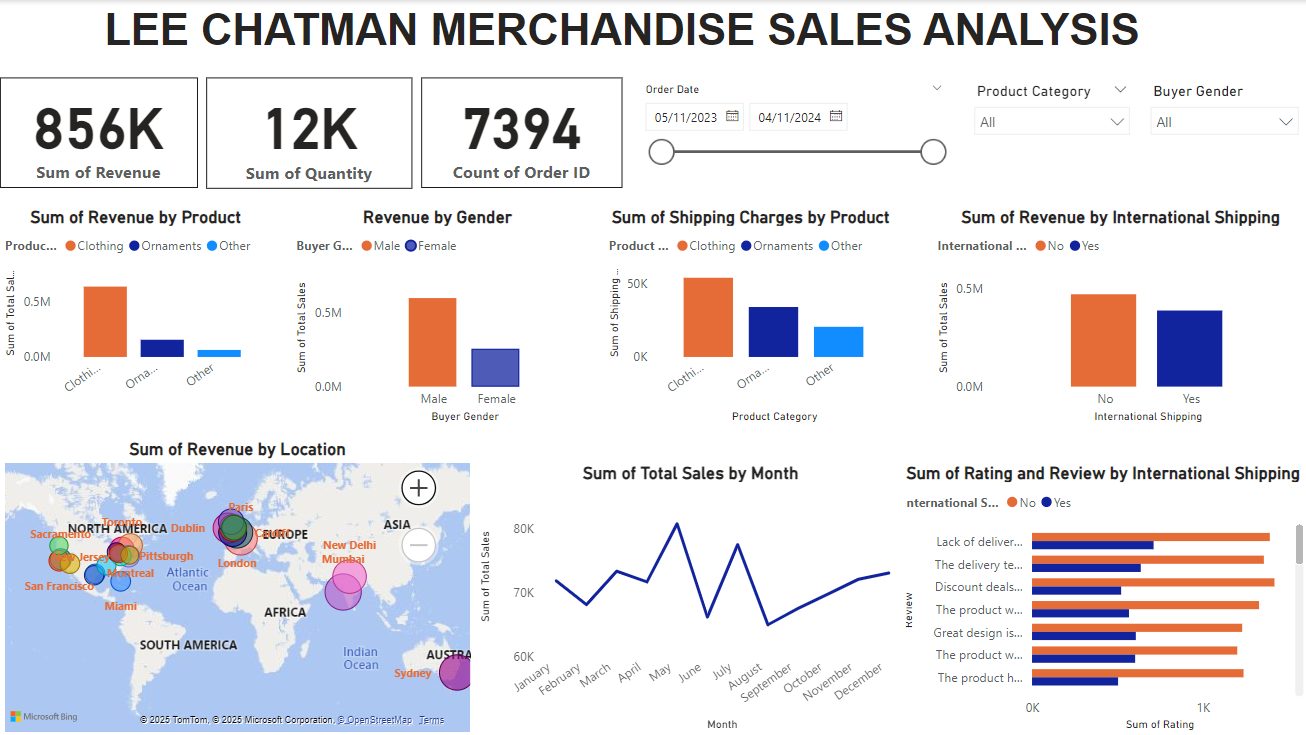

This interactive Power BI dashboard analyzes merchandise sales performance across key business dimensions such as product category, buyer demographics, shipping details, and geographic distribution. Key Highlights: 1. Breakdown of revenue and shipping costs by product type (Clothing, Ornaments, Other). 2. Geographic revenue analysis using a map to visualize location-based performance. 3. Gender-based insights into sales patterns and purchase behavior. 4. Trend analysis of monthly sales volumes and seasonal shifts. 5. Customer feedback insights segmented by international shipping preferences. 6. Slicers for dynamic filtering by date, product category, and buyer gender for enhanced interactivity. Objective: Delivered actionable insights into product profitability, sales drivers, and customer satisfaction to support data-informed business decisions. Tools Used: Power BI, DAX, Power Query, Data Modeling.
Contact our team

16 Upper Woburn Place, London, Greater London, WC1H 0AF, United Kingdom


