Join a community of the most creative Business Intelligence Professionals
Join a community of the most creative Business Intelligence Professionals
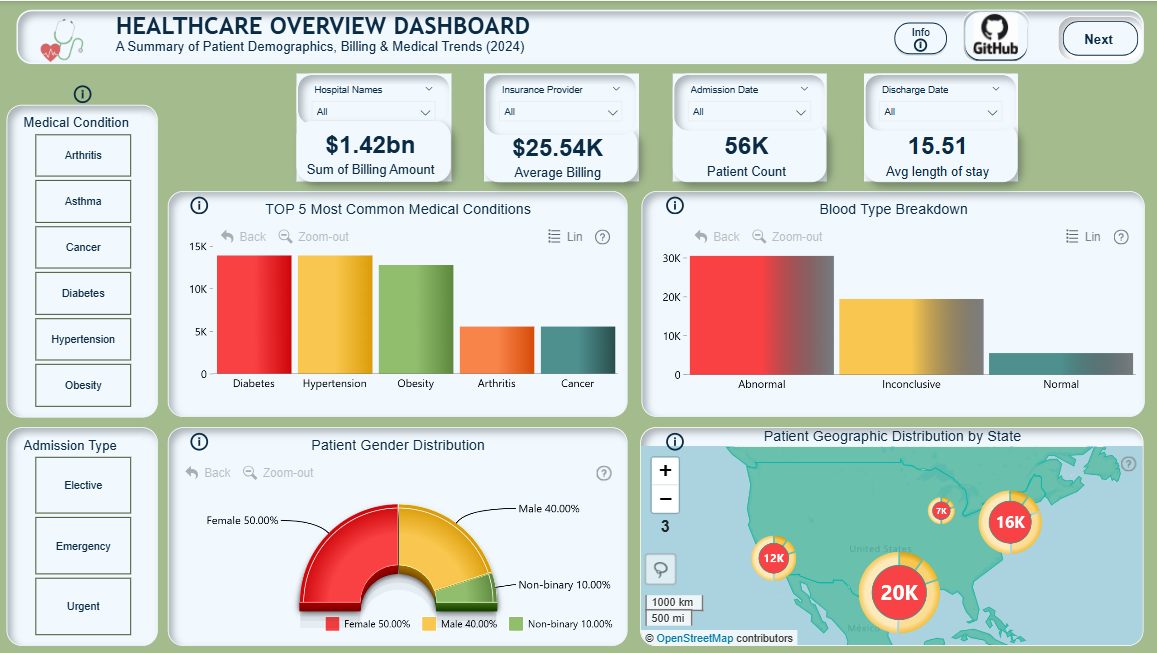

This Power BI dashboard provides a comprehensive analysis of patient demographics, healthcare service utilization, and clinical trends. The project emphasizes intuitive navigation, user experience, and dynamic data storytelling. Key Features: 1. Multi-page layout covering patient volumes, service categories, finance and treatment outcomes. 2. Interactive charts with drill-down capabilities and tooltip overlays for guided exploration. 3. Integrated KPIs, bookmarks, and info buttons for enhanced usability and insights delivery. 4. Focused on real-world application: supports healthcare decision-making through clean, accessible visuals. Tech Stack: Power BI, DAX, Power Query, Data Modeling, UX/UI Design
Contact our team

16 Upper Woburn Place, London, Greater London, WC1H 0AF, United Kingdom


