Join a community of the most creative Business Intelligence Professionals
Join a community of the most creative Business Intelligence Professionals
Find data professionals with skills verified through real challenge performance.
Browse Talent DirectoryCreate realistic synthetic data for training, testing, and demonstrations.
Explore Dataset Generator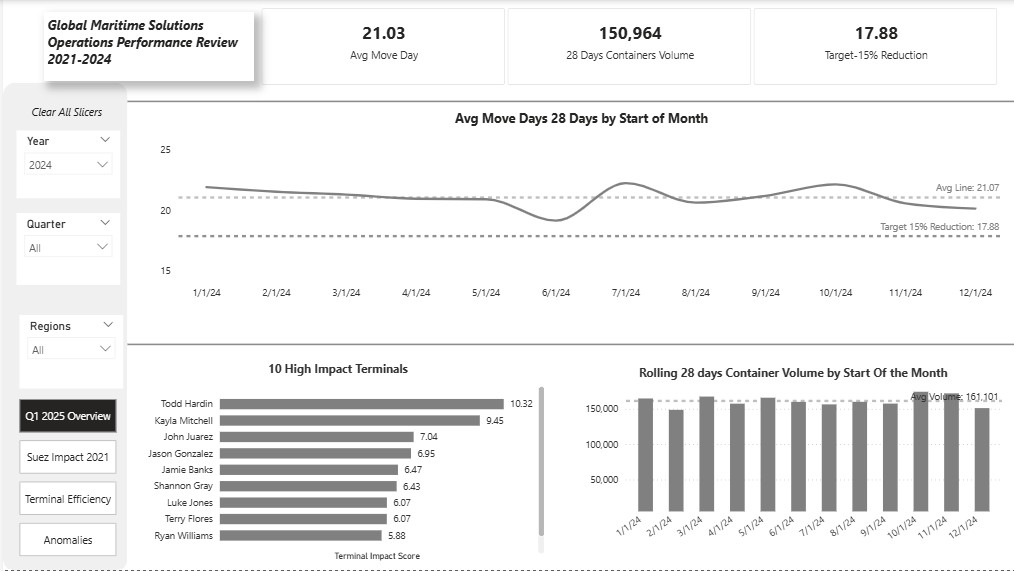
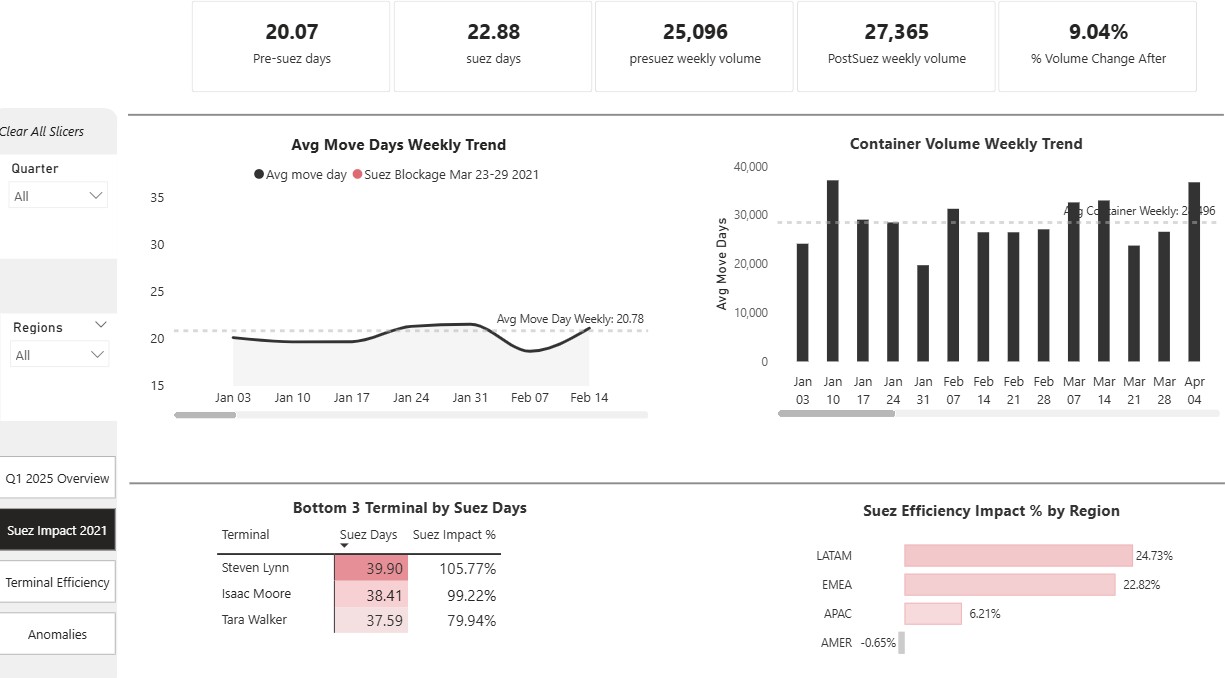
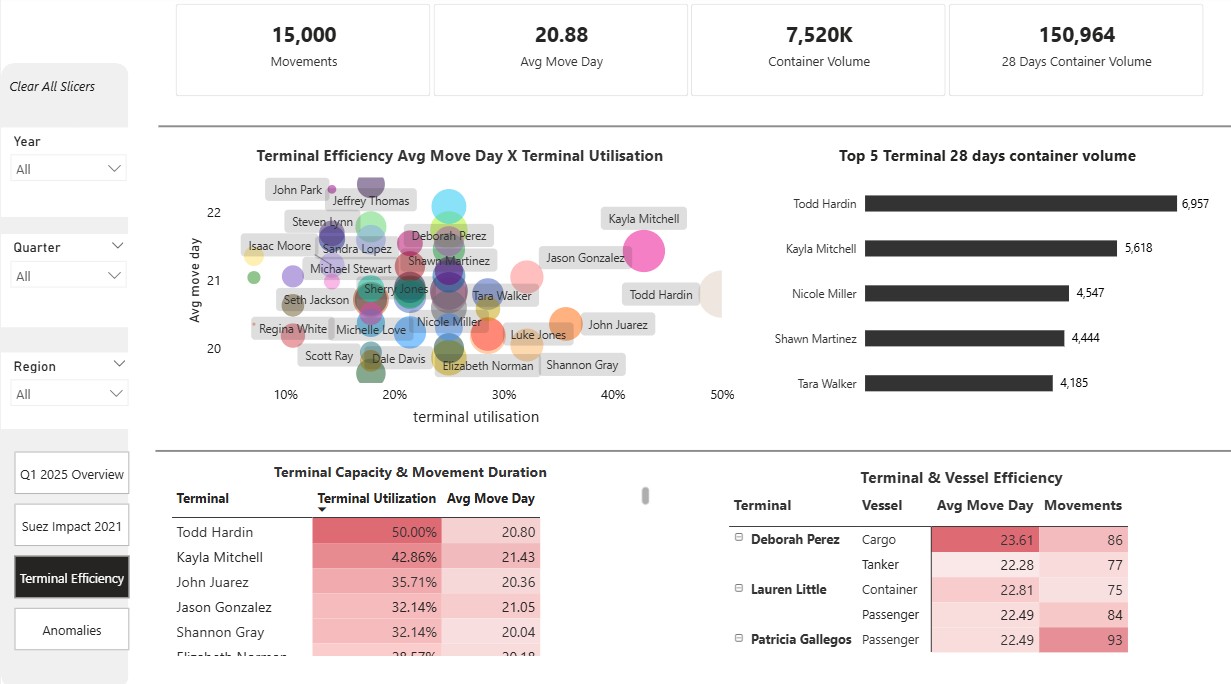
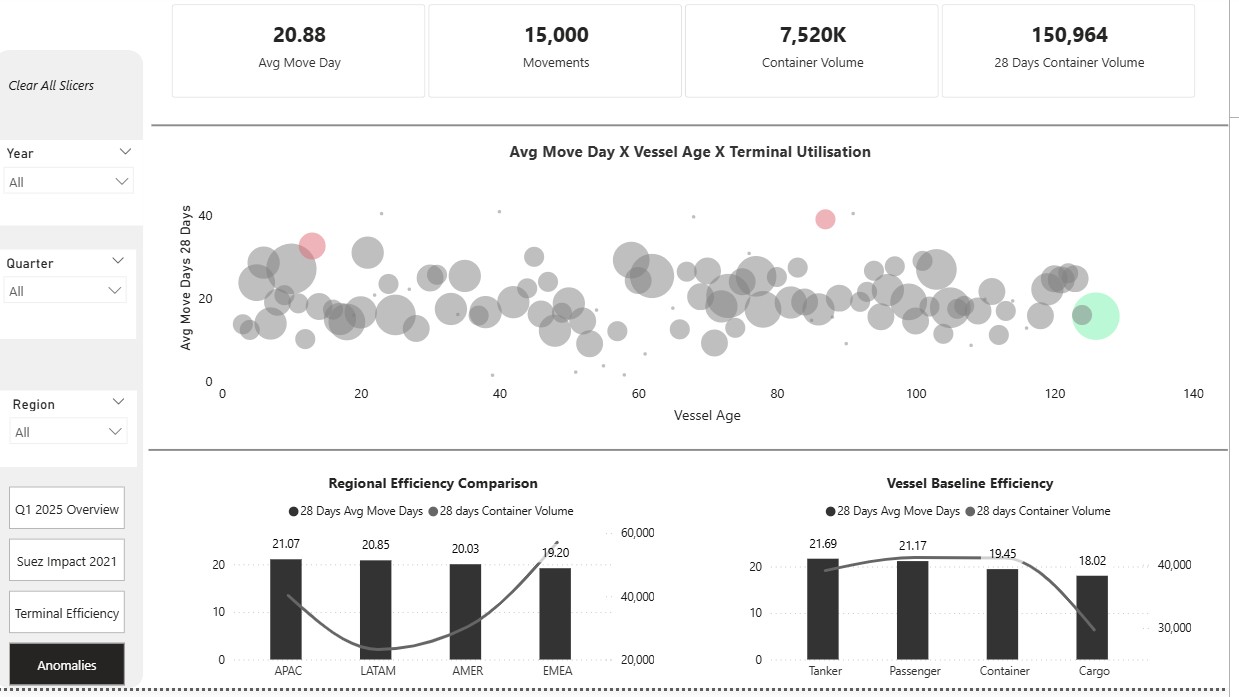

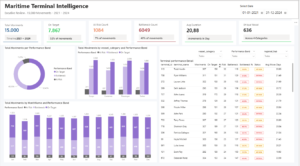
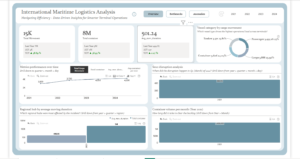
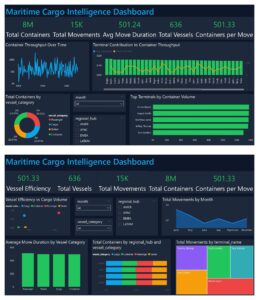
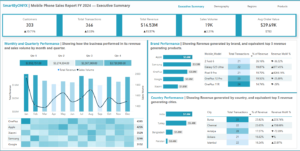
Page 1 Q1 2025 overview: It shows overall view of operations across years from 2021-2024 based on selected slicer period Year, Quarter and Regions. Each Visual in this page update based on slicer selection to provide operational context. KPI Avg move day and 28 days container volume gives context to other visuals, and Target 15% reduction is goal for q1 2025. Line chart and Column graph shows rolling 28 avg move day and rolling 28 container volume months to month comparison. Terminal Impact Bar Chart shows for selected period 2024 Todd Hardin shows busy terminal it utilized 50% of its capacity and avg move days 20.63 followed by Kayla Mitchell avg move day 22.05 and terminal utilization is 42.86.High Impact terminals are calculated based on Avg move days and Terminal utilization terminal utilization=divide (total containers 28 days, terminal capacity 28 days) If high Utilization high avg move days that terminal is under capacity strain and Terminal capacity is based on max daily volume X 28 days. Page 2 Suez Impact Analysis 2021: This page only shows year 2021 Suez disruption and its impact on following months. Pre Suez Jan 1-Mar 22, Suez Blockage Mar 23- Mar 29 Post-Suez Mar 30-June 30 LATAM-the most affected Suez Blockage post SUEZ volume dropped to 3%-SUEZ days 25.91 EMEA- 2nd most affected region post-SUEZ volume up 12.63%- SUEZ days 23.55 AMER- Remains stable on SUEZ blockage, post SUEZ volume up to 20.54%. APAC- has mild impact on Suez days however its terminal Shawn Martinez high impact on Suez days almost 39.83. Line chart shows it took overall 90 days to normalized avg move days compare, week of June 13th shows 23.12 avg move days, week of June 27 shows avg move day18.68 Page 3 Terminal Efficiency: This page shows overview of terminal performance and vessel category efficiency. KPI shows overall movements, avg move days overall container volume and 28 days container volume. All visuals are dynamic update with the slicer and filter. For selected period 2021 Terminal Angel Castillo avg utilization 17.86% avg move day 23.09 low utilization high avg move days are operational inefficiencies. Terminal Scott Ray utilization 17.86 avg move day 18.55 highly efficient terminal. Bar Graph shows top 5 terminal by 28 days container volume. Vessel category container and cargo have higher move day for selected period 2024. Selected year 2023 Terminal Matthew Ramirez terminal utilization 10.71% avg move days 23.71 higher than avg move day for year 2023. This is operational inefficiency. Page 4 Anomalies: This page shows vessels pattern. The bubble chart compares rolling 28 avg move days, vessel age, size container volume. It is interesting to know that selected year 2024 vessel age 126 has avg move days 15.71 28 days container volume 3700.Vessel age does not affect the movement time. However Regional hub LATAM affects the vessel category operational efficiency. LATAM Tanker has 23.96 avg days for selected period 2024.
Contact our team

16 Upper Woburn Place, London, Greater London, WC1H 0AF, United Kingdom


 hiral
hiral 
 Yug Kayasth
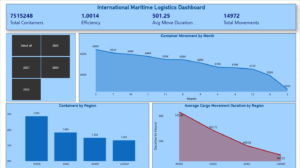
 Amey Joshi
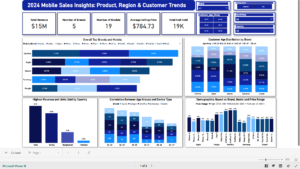
 Sandra Asagade
 Nana Kwesi Safo