Join a community of the most creative Business Intelligence Professionals
Join a community of the most creative Business Intelligence Professionals
Find data professionals with skills verified through real challenge performance.
Browse Talent DirectoryCreate realistic synthetic data for training, testing, and demonstrations.
Explore Dataset Generator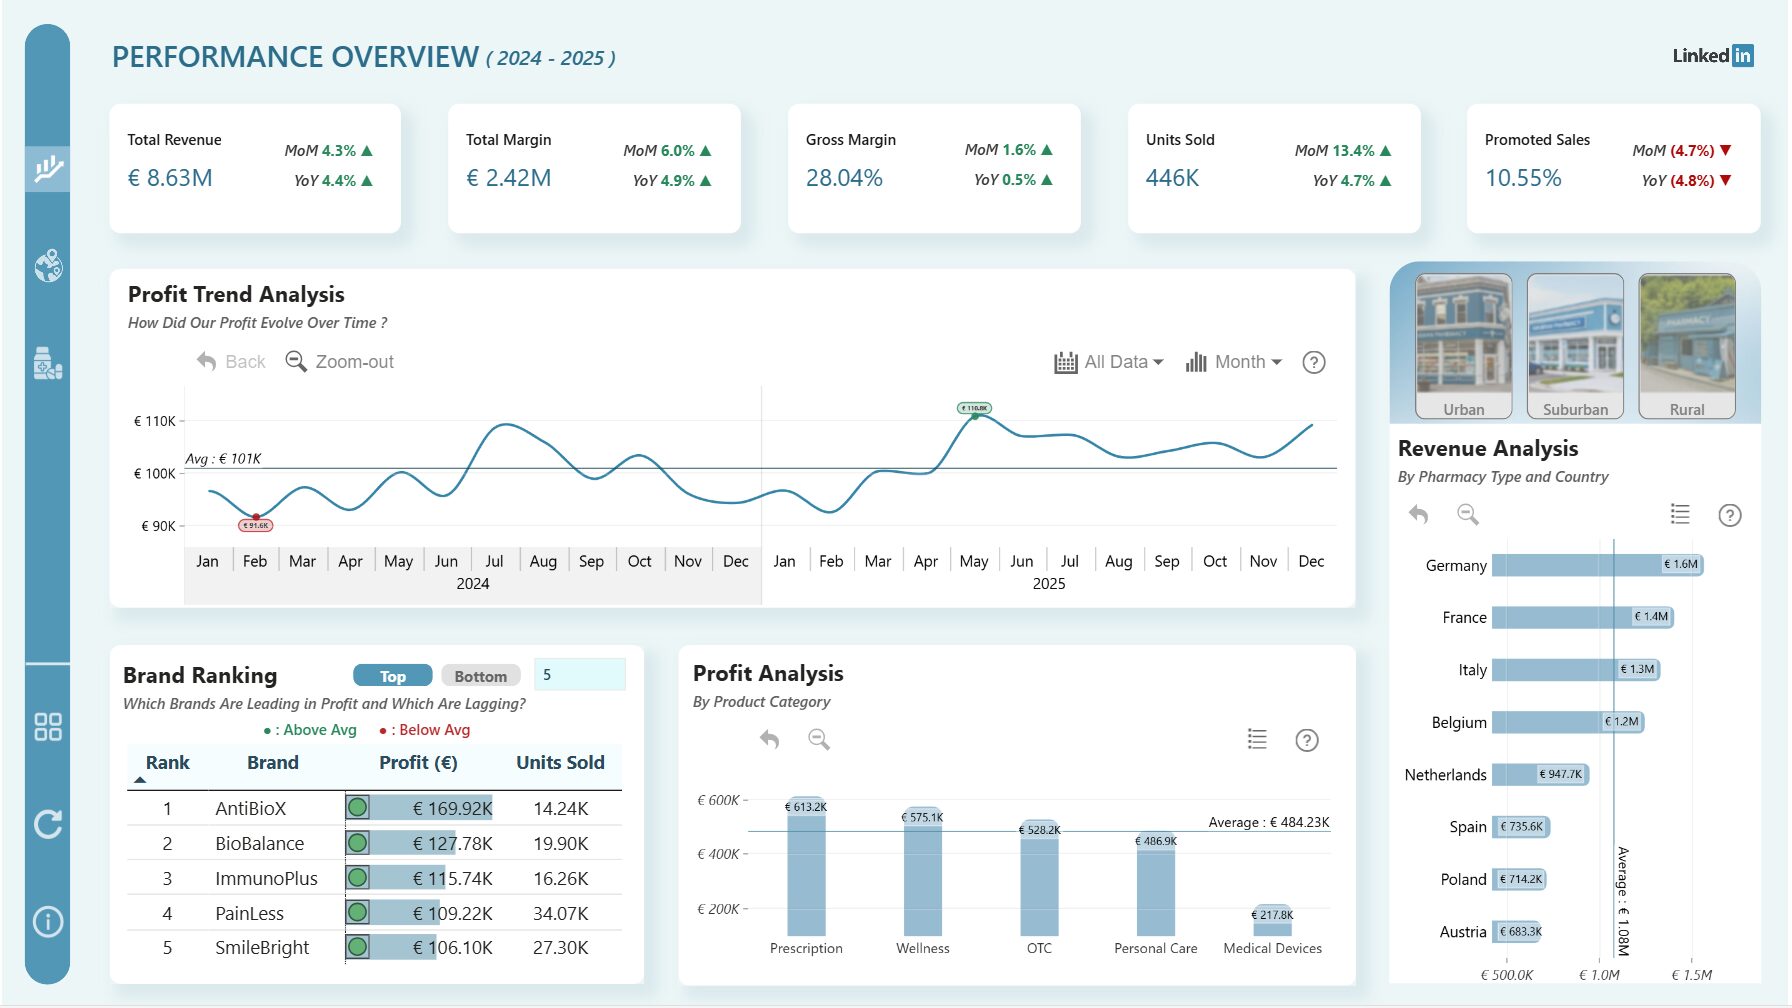
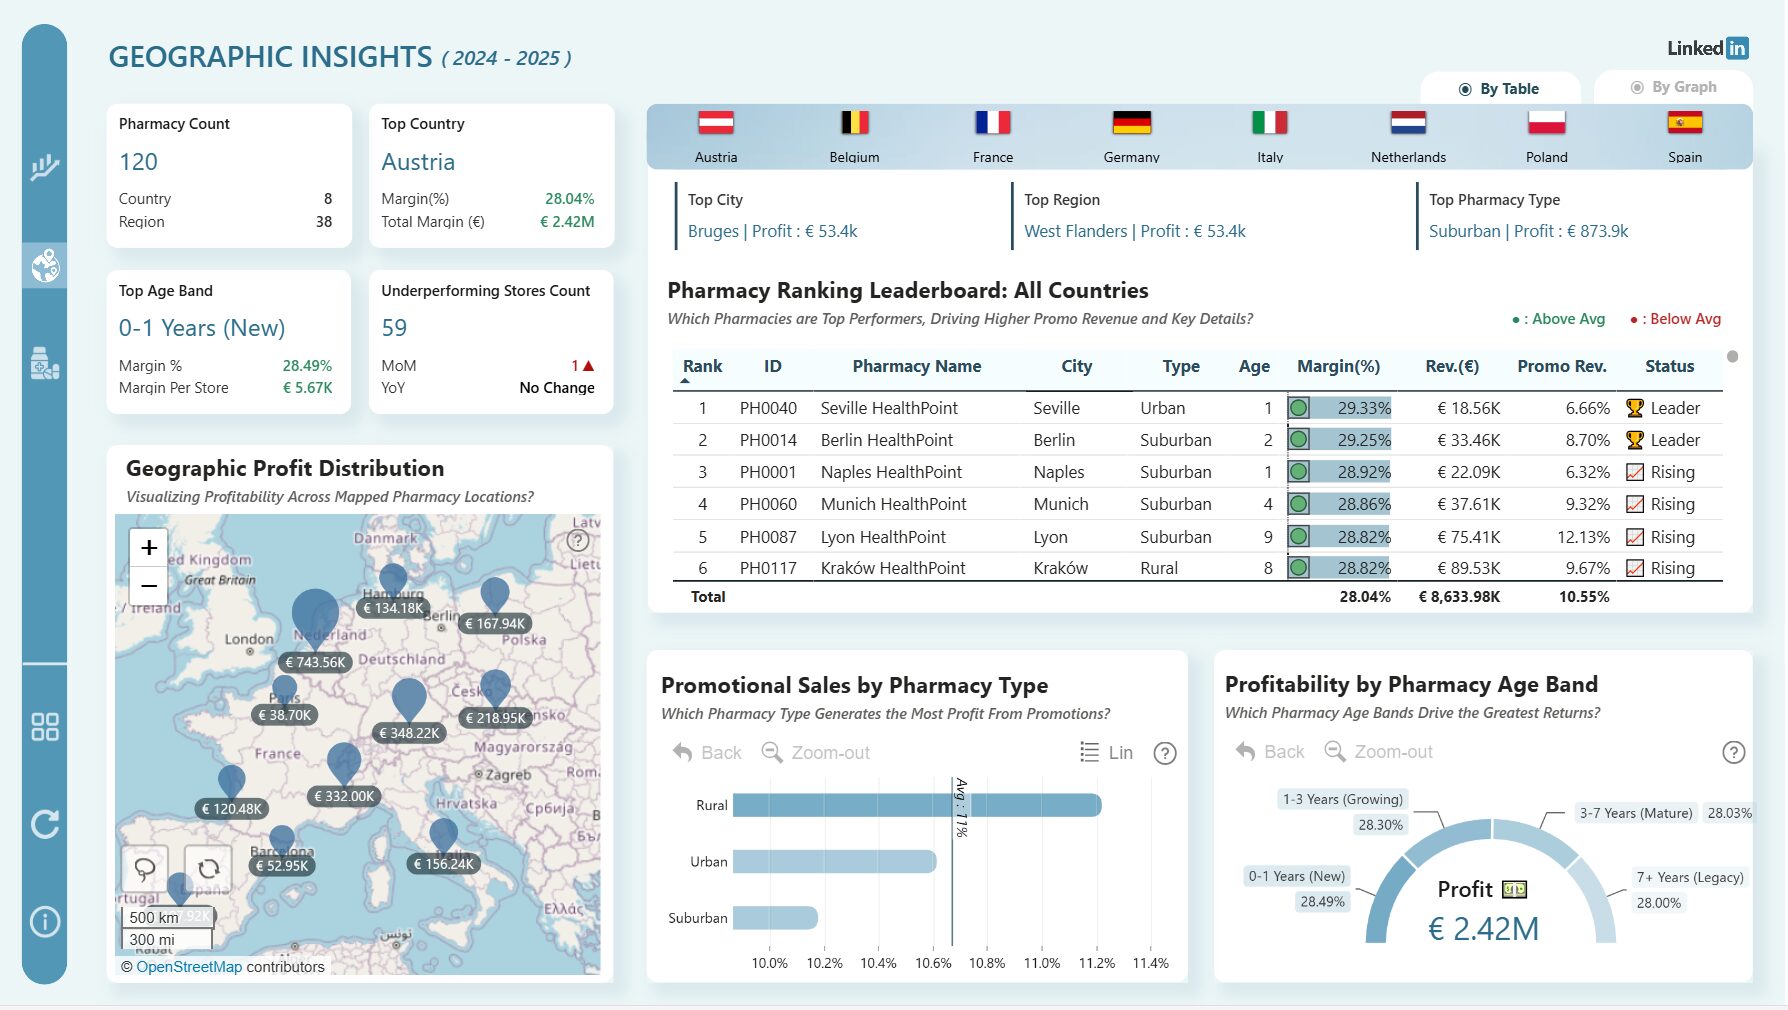
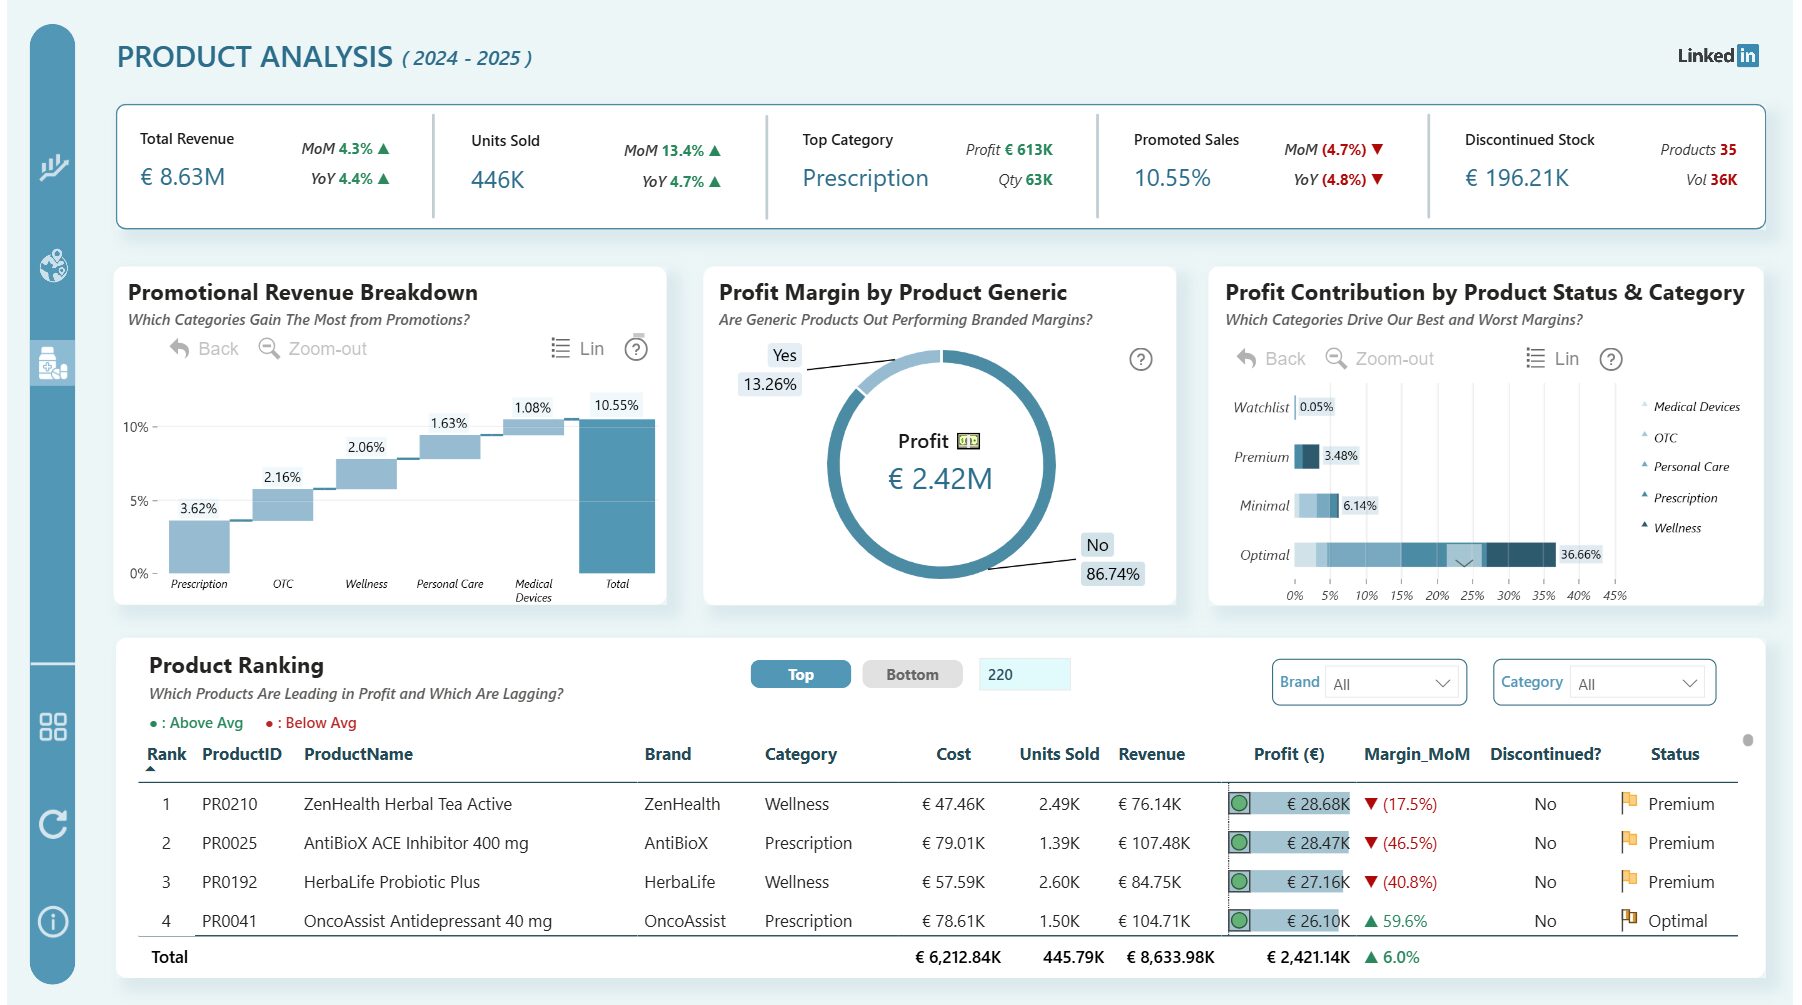
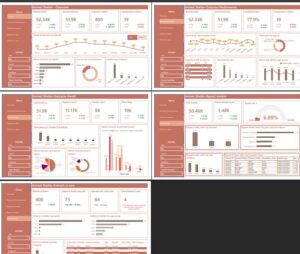
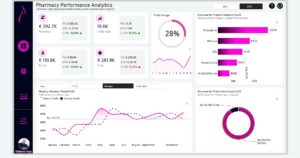
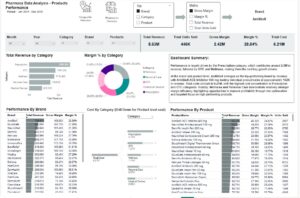
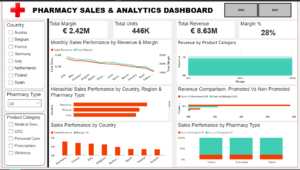
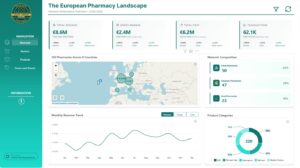
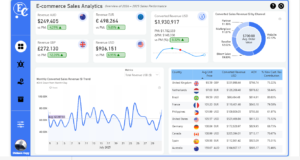
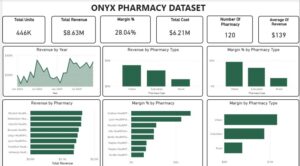
This dashboard analyzes over 62,000 pharmacy sales transactions across Europe (2024–2025), built in Power BI with ZoomCharts Drill Down Visuals. It highlights profitability trends, product lifecycle shifts, and regional performance, offering actionable insights for managers and stakeholders. Key views include margin vs. volume comparisons, geographical rankings, product profitability, and store maturity analysis — all designed to support smarter, data-driven decisions.
Contact our team

16 Upper Woburn Place, London, Greater London, WC1H 0AF, United Kingdom


 ewoma agbanoma
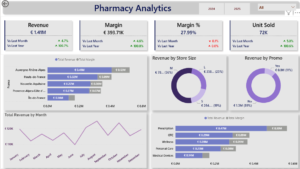
 Mahendrakumar Chaudhari